***Last / Change / Volume data in this table is the closing quote data***
Symbol/Exchange
Company Name
Industry Group |
PRICE |
CHANGE
(%Change) |
Day High |
Volume
(% DAV)
(% 50 day avg vol) |
52 Wk Hi
% From Hi |
Featured
Date |
Price
Featured |
Pivot Featured |
|
Max Buy |
ALXN
-
NASDAQ
Alexion Pharmaceuticals
DRUGS - Drug Manufacturers - Other
|
$117.82
|
+1.19
1.02% |
$117.95
|
837,349
72.61% of 50 DAV
50 DAV is 1,153,200
|
$117.65
0.14%
|
8/23/2012
|
$103.70
|
PP = $110.06
|
|
MB = $115.56
|
Most Recent Note - 10/2/2012 5:00:14 PM
G - Color code is changed to green after getting extended from its prior base and rallying above its "max buy" level. The prior highs in the $110 area define chart support along with its 50 DMA line (now $107.67)
>>> The latest Featured Stock Update with an annotated graph appeared on 9/26/2012. Click here.
View all notes |
Alert me of new notes |
CANSLIM.net Company Profile |
SEC |
Zacks Reports |
StockTalk |
News |
Chart |
Request a new note
C
A N
S L
I M


|
ASPS
-
NASDAQ
Altisource Ptf Sltns Sa
REAL ESTATE - Property Management/Developmen
|
$102.69
|
+14.64
16.63% |
$103.43
|
1,016,710
757.61% of 50 DAV
50 DAV is 134,200
|
$92.29
11.27%
|
9/24/2012
|
$87.24
|
PP = $92.39
|
|
MB = $97.01
|
 Most Recent Note - 10/3/2012 12:14:06 PM
Y - Today's volume-driven gain above its pivot point triggered a new (or add-on) technical buy signal and it is quickly getting extended beyond its "max buy" level.
>>> The latest Featured Stock Update with an annotated graph appeared on 9/11/2012. Click here.
View all notes |
Alert me of new notes |
CANSLIM.net Company Profile |
SEC |
Zacks Reports |
StockTalk |
News |
Chart |
Request a new note
C
A N
S L
I M
|
BRLI
-
NASDAQ
Bio Reference Labs Inc
HEALTH SERVICES - Medical Laboratories and Researc
|
$31.17
|
+1.38
4.63% |
$31.43
|
511,020
204.41% of 50 DAV
50 DAV is 250,000
|
$30.15
3.37%
|
10/3/2012
|
$30.90
|
PP = $30.25
|
|
MB = $31.76
|
Most Recent Note - 10/3/2012 1:04:28 PM
Y - Color code is changed to yellow with new pivot point cited based on its 8/20/12 high plus 10 cents. Gains above its pivot point backed by at least +40% above average volume may clinch a technical buy signal. It has maintained a good annual earnings history (A criteria) and quarterly earnings increases were above the +25% minimum guideline (C criteria) in the 3 latest comparisons through Jul '12 while prior comparisons were borderline or below the guideline. It survived but failed to impress since dropped from the Featured Stocks list on 7/02/10.

>>> The latest Featured Stock Update with an annotated graph appeared on 6/15/2010. Click here.
View all notes |
Alert me of new notes |
CANSLIM.net Company Profile |
SEC |
Zacks Reports |
StockTalk |
News |
Chart |
Request a new note
C
A N
S L
I M
|
CFNL
-
NASDAQ
Cardinal Financial Corp
BANKING - Regional - Southeast Banks
|
$14.05
|
-0.29
-2.02% |
$14.33
|
277,351
383.08% of 50 DAV
50 DAV is 72,400
|
$14.79
-5.00%
|
8/17/2012
|
$12.84
|
PP = $13.31
|
|
MB = $13.98
|
Most Recent Note - 10/3/2012 1:12:17 PM
G - Retreating from its 52-week high today with a damaging volume-driven loss. Distributional pressure is raising concerns while pulling back. Prior highs and 50 DMA line define important support to watch on pullbacks near the $13 level where violations would trigger technical sell signals.
>>> The latest Featured Stock Update with an annotated graph appeared on 9/25/2012. Click here.
View all notes |
Alert me of new notes |
CANSLIM.net Company Profile |
SEC |
Zacks Reports |
StockTalk |
News |
Chart |
Request a new note
C
A N
S L
I M
|
CMCSA
-
NASDAQ
Comcast Corp Cl A
MEDIA - CATV Systems
|
$36.20
|
+0.36
0.99% |
$36.47
|
10,391,356
81.36% of 50 DAV
50 DAV is 12,771,700
|
$36.90
-1.91%
|
6/11/2012
|
$29.94
|
PP = $30.98
|
|
MB = $32.53
|
Most Recent Note - 10/2/2012 5:03:06 PM
G - Consolidating above prior highs in the $35 area defining support to watch above its 50 DMA line where violations would trigger technical sell signals. Fundamental concerns have been repeatedly noted - "due to sub par sales and earnings growth in the Jun '12 quarter."
>>> The latest Featured Stock Update with an annotated graph appeared on 9/21/2012. Click here.
View all notes |
Alert me of new notes |
CANSLIM.net Company Profile |
SEC |
Zacks Reports |
StockTalk |
News |
Chart |
Request a new note
C
A N
S L
I M
|
Symbol/Exchange
Company Name
Industry Group |
PRICE |
CHANGE
(%Change) |
Day High |
Volume
(% DAV)
(% 50 day avg vol) |
52 Wk Hi
% From Hi |
Featured
Date |
Price
Featured |
Pivot Featured |
|
Max Buy |
DVA
-
NYSE
Davita Inc
HEALTH SERVICES - Specialized Health Services
|
$107.70
|
+3.59
3.45% |
$107.75
|
1,258,586
172.60% of 50 DAV
50 DAV is 729,200
|
$105.73
1.86%
|
9/5/2012
|
$102.92
|
PP = $100.62
|
|
MB = $105.65
|
Most Recent Note - 10/3/2012 1:31:59 PM
G - Gain today without great volume conviction helped it hit a new 52-week high above its "max buy" level and its color code is changed to green. Prior highs near $100 and its 50 DMA line define near term support to watch on pullbacks where violations may trigger technical sell signals.
>>> The latest Featured Stock Update with an annotated graph appeared on 9/5/2012. Click here.
View all notes |
Alert me of new notes |
CANSLIM.net Company Profile |
SEC |
Zacks Reports |
StockTalk |
News |
Chart |
Request a new note
C
A N
S L
I M
|
ECPG
-
NASDAQ
Encore Capital Group Inc
FINANCIAL SERVICES - Credit Services
|
$28.22
|
-0.08
-0.28% |
$28.64
|
285,743
208.57% of 50 DAV
50 DAV is 137,000
|
$30.91
-8.70%
|
8/3/2012
|
$29.91
|
PP = $30.45
|
|
MB = $31.97
|
Most Recent Note - 10/2/2012 5:08:33 PM
G - Color code is changed to green after today's gap up was followed by a worrisome "negative reversal" and close near the session low also slumping back below its 50 DMA line. Disciplined investors always limit losses if ever a stock falls more than -7% from their purchase price.
>>> The latest Featured Stock Update with an annotated graph appeared on 9/12/2012. Click here.
View all notes |
Alert me of new notes |
CANSLIM.net Company Profile |
SEC |
Zacks Reports |
StockTalk |
News |
Chart |
Request a new note
C
A N
S L
I M
|
EXPE
-
NASDAQ
Expedia Inc
INTERNET - Internet Information Providers
|
$58.35
|
+1.69
2.97% |
$58.50
|
2,506,323
77.23% of 50 DAV
50 DAV is 3,245,100
|
$60.29
-3.22%
|
4/27/2012
|
$41.80
|
PP = $35.57
|
|
MB = $37.35
|
Most Recent Note - 10/2/2012 5:16:06 PM
G - Forming a late-stage cup-with-handle type base and it is currently perched -6% off its 52-week high while quietly consolidating above its 50 DMA line. It has been noted 2 times in recently weeks - "No overhead supply remains to hinder its progress, however weak industry group action and iffy fundamentals were noted as causes for concern." See more details and an annotated graph in the latest FSU analysis under the headline "Online Travel Firm Resilient Despite Unfavorable Signs - Wednesday, September 19, 2012"
>>> The latest Featured Stock Update with an annotated graph appeared on 9/19/2012. Click here.
View all notes |
Alert me of new notes |
CANSLIM.net Company Profile |
SEC |
Zacks Reports |
StockTalk |
News |
Chart |
Request a new note
C
A N
S L
I M
|
GPX
-
NYSE
G P Strategies Corp
DIVERSIFIED SERVICES - Education and Training Services
|
$19.09
|
-0.41
-2.10% |
$19.60
|
34,140
45.46% of 50 DAV
50 DAV is 75,100
|
$20.67
-7.64%
|
6/29/2012
|
$18.01
|
PP = $18.15
|
|
MB = $19.06
|
Most Recent Note - 10/2/2012 5:17:29 PM
G - Consolidating -5.7% off its 52-week high today, after a streak of 6 consecutive losses it found support at its 50 DMA line. More damaging losses would raise concerns and trigger technical sell signals.
>>> The latest Featured Stock Update with an annotated graph appeared on 9/13/2012. Click here.
View all notes |
Alert me of new notes |
CANSLIM.net Company Profile |
SEC |
Zacks Reports |
StockTalk |
News |
Chart |
Request a new note
C
A N
S L
I M
|
KH
-
NYSE
China Kanghui Hldgs Ads
HEALTH SERVICES - Medical Appliances and Equipment
|
$30.32
|
-0.04
-0.13% |
$30.50
|
600,088
523.18% of 50 DAV
50 DAV is 114,700
|
$30.53
-0.69%
|
8/30/2012
|
$24.19
|
PP = $22.90
|
|
MB = $24.05
|
Most Recent Note - 10/3/2012 6:21:00 PM
It will be dropped from the Featured Stocks list tonight based on the recent M&A news. Holding its ground since gapping up for a considerable gain and new all-time high on 9/28/12 following news it will be acquired by Medtronic Inc (MDT). See the latest FSU analysis for more details and a new annotated graph.
>>> The latest Featured Stock Update with an annotated graph appeared on 10/1/2012. Click here.
View all notes |
Alert me of new notes |
CANSLIM.net Company Profile |
SEC |
Zacks Reports |
StockTalk |
News |
Chart |
Request a new note
C
A N
S L
I M
|
Symbol/Exchange
Company Name
Industry Group |
PRICE |
CHANGE
(%Change) |
Day High |
Volume
(% DAV)
(% 50 day avg vol) |
52 Wk Hi
% From Hi |
Featured
Date |
Price
Featured |
Pivot Featured |
|
Max Buy |
LKQ
-
NASDAQ
L K Q Corp
WHOLESALE - Auto Parts
|
$19.04
|
+0.41
2.20% |
$19.07
|
1,781,020
125.32% of 50 DAV
50 DAV is 1,421,200
|
$20.02
-4.87%
|
8/9/2012
|
$18.97
|
PP = $18.72
|
|
MB = $19.66
|
Most Recent Note - 10/3/2012 6:22:53 PM
Y - Rebounded above its 50 DMA line helping its technical stance with today's gain backed by above average volume, and its color code is changed to yellow again. Do not be confused by a 2:1 share split effective 9/19/12 (Featured Price, Pivot Point and Max Buy were adjusted).
>>> The latest Featured Stock Update with an annotated graph appeared on 9/17/2012. Click here.
View all notes |
Alert me of new notes |
CANSLIM.net Company Profile |
SEC |
Zacks Reports |
StockTalk |
News |
Chart |
Request a new note
C
A N
S L
I M
|
LNKD
-
NYSE
Linkedin Corp Class A
INTERNET - Internet Information Providers
|
$121.68
|
+2.91
2.45% |
$122.95
|
1,557,824
62.92% of 50 DAV
50 DAV is 2,475,700
|
$125.50
-3.04%
|
9/5/2012
|
$113.25
|
PP = $113.10
|
|
MB = $118.76
|
Most Recent Note - 10/3/2012 1:33:49 PM
G - Trading up on light volume today, within close striking distance of its best-ever close. Volume totals have been cooling in recent weeks. Prior highs near $113 and its 50 DMA line define support to watch on pullbacks.
>>> The latest Featured Stock Update with an annotated graph appeared on 9/6/2012. Click here.
View all notes |
Alert me of new notes |
CANSLIM.net Company Profile |
SEC |
Zacks Reports |
StockTalk |
News |
Chart |
Request a new note
C
A N
S L
I M
|
LULU
-
NASDAQ
Lululemon Athletica
MANUFACTURING - Textile Manufacturing
|
$75.02
|
-1.33
-1.74% |
$76.30
|
1,700,038
63.88% of 50 DAV
50 DAV is 2,661,100
|
$81.09
-7.49%
|
10/2/2012
|
$74.89
|
PP = $78.97
|
|
MB = $82.92
|
Most Recent Note - 10/2/2012 8:49:27 PM
Y - Tallied a gain with above average volume today after highlighted in yellow with a new pivot point cited based on its 9/14/12 high while building on a cup-with-handle base pattern. Volume-driven gains above its pivot point are necessary to confirm a technical buy signal before action may be justified by disciplined investors. Fundamentals remain strong (good C and A criteria). Rebounded impressively after a deep consolidation below its 200 DMA line since dropped from the Featured Stocks list on 5/17/12. See the latest FSU analysis for more details and a new annotated graph.
>>> The latest Featured Stock Update with an annotated graph appeared on 10/2/2012. Click here.
View all notes |
Alert me of new notes |
CANSLIM.net Company Profile |
SEC |
Zacks Reports |
StockTalk |
News |
Chart |
Request a new note
C
A N
S L
I M
|
MIDD
-
NASDAQ
Middleby Corp
MANUFACTURING - Diversified Machinery
|
$116.58
|
-1.57
-1.33% |
$119.07
|
57,110
54.91% of 50 DAV
50 DAV is 104,000
|
$122.57
-4.89%
|
8/9/2012
|
$118.60
|
PP = $104.92
|
|
MB = $110.17
|
Most Recent Note - 10/1/2012 5:59:10 PM
G - Perched -4.4% off its 52-week high after a gain today with higher (near average) volume. Extended from its prior base, and its 50 DMA line and recent lows define near-term chart support to watch.
>>> The latest Featured Stock Update with an annotated graph appeared on 9/18/2012. Click here.
View all notes |
Alert me of new notes |
CANSLIM.net Company Profile |
SEC |
Zacks Reports |
StockTalk |
News |
Chart |
Request a new note
C
A N
S L
I M
|
N
-
NYSE
Netsuite Inc
DIVERSIFIED SERVICES - Business/Management Services
|
$62.60
|
+0.11
0.18% |
$62.82
|
448,117
69.36% of 50 DAV
50 DAV is 646,100
|
$64.26
-2.58%
|
8/20/2012
|
$55.88
|
PP = $59.32
|
|
MB = $62.29
|
Most Recent Note - 10/2/2012 5:20:55 PM
G - Consolidating above its "max buy" level. Prior highs near $59 define initial support above its 50 DMA line where violations would trigger technical sell signals.
>>> The latest Featured Stock Update with an annotated graph appeared on 9/24/2012. Click here.
View all notes |
Alert me of new notes |
CANSLIM.net Company Profile |
SEC |
Zacks Reports |
StockTalk |
News |
Chart |
Request a new note
C
A N
S L
I M
|
Symbol/Exchange
Company Name
Industry Group |
PRICE |
CHANGE
(%Change) |
Day High |
Volume
(% DAV)
(% 50 day avg vol) |
52 Wk Hi
% From Hi |
Featured
Date |
Price
Featured |
Pivot Featured |
|
Max Buy |
NSM
-
NYSE
Nationstar Mtg Hldgs Inc
FINANCIAL SERVICES - Credit Services
|
$34.25
|
-0.41
-1.18% |
$37.20
|
3,788,222
352.39% of 50 DAV
50 DAV is 1,075,000
|
$36.12
-5.17%
|
8/29/2012
|
$27.96
|
PP = $28.85
|
|
MB = $30.29
|
Most Recent Note - 10/3/2012 12:42:41 PM
G - Hit yet another new 52-week high today. After a spurt of volume-driven gains it is extended from its prior base. Disciplined investors avoid chasing stocks more than +5% above their pivot point.
>>> The latest Featured Stock Update with an annotated graph appeared on 9/7/2012. Click here.
View all notes |
Alert me of new notes |
CANSLIM.net Company Profile |
SEC |
Zacks Reports |
StockTalk |
News |
Chart |
Request a new note
C
A N
S L
I M
|
OSIS
-
NASDAQ
O S I Systems Inc
ELECTRONICS - Semiconductor Equipment and Mate
|
$75.93
|
-0.61
-0.80% |
$76.89
|
101,857
77.63% of 50 DAV
50 DAV is 131,200
|
$78.93
-3.80%
|
9/5/2012
|
$74.39
|
PP = $75.10
|
|
MB = $78.86
|
Most Recent Note - 10/2/2012 5:23:44 PM
Y - Consolidating just -3% off its 52-week high today. It remains below its "max buy" level after bullish action recently confirmed a technical buy signal. Near term support is at its 50 DMA line.
>>> The latest Featured Stock Update with an annotated graph appeared on 9/14/2012. Click here.
View all notes |
Alert me of new notes |
CANSLIM.net Company Profile |
SEC |
Zacks Reports |
StockTalk |
News |
Chart |
Request a new note
C
A N
S L
I M
|
RNF
-
NYSE
Rentech Nitrogen Ptnr Lp
CHEMICALS - Agricultural Chemicals
|
$35.92
|
-1.79
-4.75% |
$37.33
|
1,474,364
335.24% of 50 DAV
50 DAV is 439,800
|
$40.05
-10.31%
|
7/27/2012
|
$29.58
|
PP = $30.60
|
|
MB = $32.13
|
Most Recent Note - 10/3/2012 1:17:40 PM
G - Gapped down today for another volume-driven loss and it violated an upward trendline defining near-term chart support in the $37 area which may be considered an early sell signal. A strong finish in the upper third of its intra-day rage would be a reassuring sign, however, the next important support comes into play at its 50 DMA line (now $34.14).
>>> The latest Featured Stock Update with an annotated graph appeared on 8/31/2012. Click here.
View all notes |
Alert me of new notes |
CANSLIM.net Company Profile |
SEC |
Zacks Reports |
StockTalk |
News |
Chart |
Request a new note
C
A N
S L
I M
|
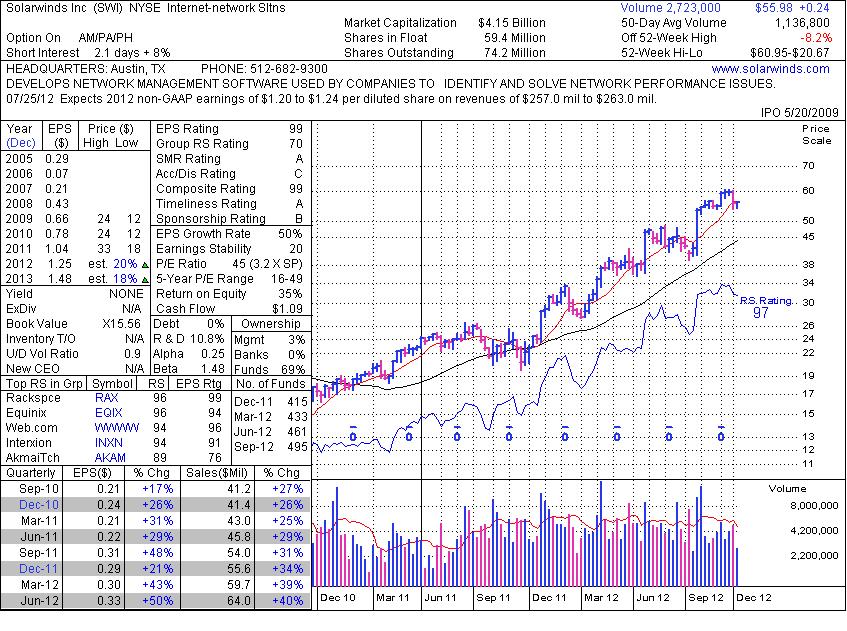
SWI
-
NYSE
Solarwinds Inc
COMPUTER SOFTWARE and SERVICES - Application Software
|
$55.98
|
+0.41
0.74% |
$56.57
|
858,736
75.54% of 50 DAV
50 DAV is 1,136,800
|
$60.95
-8.15%
|
7/25/2012
|
$47.82
|
PP = $47.89
|
|
MB = $50.28
|
Most Recent Note - 10/3/2012 6:24:50 PM
Y - Color code is changed to yellow based on the secondary buy point explained in the latest FSU analysis along with a new annotated graph. A subsequent violation of the 9/26/12 low ($53.78) would raise more serious concerns and trigger technical sell signals.
>>> The latest Featured Stock Update with an annotated graph appeared on 10/3/2012. Click here.
View all notes |
Alert me of new notes |
CANSLIM.net Company Profile |
SEC |
Zacks Reports |
StockTalk |
News |
Chart |
Request a new note
C
A N
S L
I M
|
TDG
-
NYSE
Transdigm Group Inc
AEROSPACE/DEFENSE - Aerospace/Defense Products and; Services
|
$145.31
|
+3.23
2.27% |
$145.31
|
742,029
175.30% of 50 DAV
50 DAV is 423,300
|
$146.72
-0.96%
|
8/16/2012
|
$132.23
|
PP = $136.44
|
|
MB = $143.26
|
Most Recent Note - 10/3/2012 1:21:08 PM
G - Color code is changed to green after rising back above its "max buy" level with today's 2nd consecutive gain. Its 50 DMA line and prior highs define near-term support to watch in the $135-136 area on pullbacks.
>>> The latest Featured Stock Update with an annotated graph appeared on 9/20/2012. Click here.
View all notes |
Alert me of new notes |
CANSLIM.net Company Profile |
SEC |
Zacks Reports |
StockTalk |
News |
Chart |
Request a new note
C
A N
S L
I M
|
Symbol/Exchange
Company Name
Industry Group |
PRICE |
CHANGE
(%Change) |
Day High |
Volume
(% DAV)
(% 50 day avg vol) |
52 Wk Hi
% From Hi |
Featured
Date |
Price
Featured |
Pivot Featured |
|
Max Buy |
ULTA
-
NASDAQ
Ulta Salon Cosm & Frag
SPECIALTY RETAIL - Specialty Retail, Other
|
$97.54
|
+1.24
1.29% |
$97.81
|
369,336
48.02% of 50 DAV
50 DAV is 769,200
|
$103.52
-5.78%
|
9/4/2012
|
$93.17
|
PP = $98.52
|
|
MB = $103.45
|
Most Recent Note - 10/3/2012 1:23:33 PM
Y - Still lingering just below its pivot point today. Volume totals have been cooling in recent weeks following its 9/07/12 breakaway gap. Disciplined investors always limit losses if ever any stock falls -7% or more from their purchase price.
>>> The latest Featured Stock Update with an annotated graph appeared on 9/4/2012. Click here.
View all notes |
Alert me of new notes |
CANSLIM.net Company Profile |
SEC |
Zacks Reports |
StockTalk |
News |
Chart |
Request a new note
C
A N
S L
I M
|
ULTI
-
NASDAQ
Ultimate Software Group
INTERNET - Internet Software and Services
|
$102.04
|
+0.28
0.28% |
$102.76
|
96,996
58.33% of 50 DAV
50 DAV is 166,300
|
$106.40
-4.10%
|
8/27/2012
|
$98.36
|
PP = $99.19
|
|
MB = $104.15
|
Most Recent Note - 10/3/2012 1:26:33 PM
Y - Perched -4% from its 52-week and all-time highs today. Recent lows define initial support to watch along with its 50 DMA line in the $96 area where violations would raise concerns and trigger technical sell signals.
>>> The latest Featured Stock Update with an annotated graph appeared on 9/27/2012. Click here.
View all notes |
Alert me of new notes |
CANSLIM.net Company Profile |
SEC |
Zacks Reports |
StockTalk |
News |
Chart |
Request a new note
C
A N
S L
I M
|
VSI
-
NYSE
Vitamin Shoppe Inc
SPECIALTY RETAIL - Specialty Retail, Other
|
$58.41
|
+0.32
0.55% |
$58.48
|
188,663
51.63% of 50 DAV
50 DAV is 365,400
|
$61.83
-5.52%
|
6/29/2012
|
$54.93
|
PP = $55.03
|
|
MB = $57.78
|
Most Recent Note - 10/3/2012 1:28:13 PM
G - Volume totals have been cooling in recent weeks while consolidating. Prior lows near $52 define important chart support below its 50 DMA line.
>>> The latest Featured Stock Update with an annotated graph appeared on 9/10/2012. Click here.
View all notes |
Alert me of new notes |
CANSLIM.net Company Profile |
SEC |
Zacks Reports |
StockTalk |
News |
Chart |
Request a new note
C
A N
S L
I M
|
WPI
-
NYSE
Watson Pharmaceuticals
DRUGS - Drugs - Generic
|
$86.43
|
+1.00
1.17% |
$87.32
|
874,943
83.19% of 50 DAV
50 DAV is 1,051,800
|
$86.20
0.27%
|
8/24/2012
|
$82.90
|
PP = $81.10
|
|
MB = $85.16
|
Most Recent Note - 10/3/2012 1:29:39 PM
G - Hit a new 52-week high with today's small gain on light volume, getting more extended from its prior base. Prior lows and its 50 DMA line in the $82 area define important support to watch on pullbacks.
>>> The latest Featured Stock Update with an annotated graph appeared on 9/28/2012. Click here.
View all notes |
Alert me of new notes |
CANSLIM.net Company Profile |
SEC |
Zacks Reports |
StockTalk |
News |
Chart |
Request a new note
C
A N
S L
I M
|