***Last / Change / Volume data in this table is the closing quote data***
Symbol/Exchange
Company Name
Industry Group |
PRICE |
CHANGE
(%Change) |
Day High |
Volume
(% DAV)
(% 50 day avg vol) |
52 Wk Hi
% From Hi |
Featured
Date |
Price
Featured |
Pivot Featured |
|
Max Buy |
ALXN
-
NASDAQ
Alexion Pharmaceuticals
DRUGS - Drug Manufacturers - Other
|
$116.63
|
+0.63
0.54% |
$116.87
|
901,293
76.89% of 50 DAV
50 DAV is 1,172,200
|
$117.65
-0.87%
|
8/23/2012
|
$103.70
|
PP = $110.06
|
|
MB = $115.56
|
 Most Recent Note - 10/2/2012 5:00:14 PM
G - Color code is changed to green after getting extended from its prior base and rallying above its "max buy" level. The prior highs in the $110 area define chart support along with its 50 DMA line (now $107.67)
>>> The latest Featured Stock Update with an annotated graph appeared on 9/26/2012. Click here.
View all notes |
Alert me of new notes |
CANSLIM.net Company Profile |
SEC |
Zacks Reports |
StockTalk |
News |
Chart |
Request a new note
C
A N
S L
I M


|
ASPS
-
NASDAQ
Altisource Ptf Sltns Sa
REAL ESTATE - Property Management/Developmen
|
$88.05
|
-0.44
-0.50% |
$89.61
|
88,493
66.49% of 50 DAV
50 DAV is 133,100
|
$92.29
-4.59%
|
9/24/2012
|
$87.24
|
PP = $92.39
|
|
MB = $97.01
|
Most Recent Note - 10/1/2012 6:38:00 PM
Y - Today's 3rd consecutive gain had above average volume while rallying up from its 50 DMA line in the $82 area. Volume-driven gains above its pivot point may trigger a new (or add-on) technical buy signal.
>>> The latest Featured Stock Update with an annotated graph appeared on 9/11/2012. Click here.
View all notes |
Alert me of new notes |
CANSLIM.net Company Profile |
SEC |
Zacks Reports |
StockTalk |
News |
Chart |
Request a new note
C
A N
S L
I M
|
CFNL
-
NASDAQ
Cardinal Financial Corp
BANKING - Regional - Southeast Banks
|
$14.34
|
+0.07
0.49% |
$14.49
|
119,231
167.22% of 50 DAV
50 DAV is 71,300
|
$14.79
-3.04%
|
8/17/2012
|
$12.84
|
PP = $13.31
|
|
MB = $13.98
|
Most Recent Note - 10/1/2012 12:22:07 PM
G - Still consolidating near its 52-week high today, holding its ground stubbornly after a spurt of volume-driven gains. Extended from its prior base, and its prior highs and 50 DMA line define support to watch on pullbacks near the $13 level.
>>> The latest Featured Stock Update with an annotated graph appeared on 9/25/2012. Click here.
View all notes |
Alert me of new notes |
CANSLIM.net Company Profile |
SEC |
Zacks Reports |
StockTalk |
News |
Chart |
Request a new note
C
A N
S L
I M
|
CMCSA
-
NASDAQ
Comcast Corp Cl A
MEDIA - CATV Systems
|
$35.84
|
+0.46
1.30% |
$36.07
|
12,708,648
99.28% of 50 DAV
50 DAV is 12,800,600
|
$36.90
-2.87%
|
6/11/2012
|
$29.94
|
PP = $30.98
|
|
MB = $32.53
|
Most Recent Note - 10/2/2012 5:03:06 PM
G - Consolidating above prior highs in the $35 area defining support to watch above its 50 DMA line where violations would trigger technical sell signals. Fundamental concerns have been repeatedly noted - "due to sub par sales and earnings growth in the Jun '12 quarter."
>>> The latest Featured Stock Update with an annotated graph appeared on 9/21/2012. Click here.
View all notes |
Alert me of new notes |
CANSLIM.net Company Profile |
SEC |
Zacks Reports |
StockTalk |
News |
Chart |
Request a new note
C
A N
S L
I M
|
DVA
-
NYSE
Davita Inc
HEALTH SERVICES - Specialized Health Services
|
$104.11
|
+0.67
0.65% |
$105.54
|
781,254
107.79% of 50 DAV
50 DAV is 724,800
|
$105.73
-1.53%
|
9/5/2012
|
$102.92
|
PP = $100.62
|
|
MB = $105.65
|
Most Recent Note - 10/2/2012 5:06:43 PM
Y - Gain today with average volume led to its best-ever close, yet it remains below its "max buy" level. Prior highs near $100 and its 50 DMA line define near term support to watch on pullbacks where violations may trigger technical sell signals.
>>> The latest Featured Stock Update with an annotated graph appeared on 9/5/2012. Click here.
View all notes |
Alert me of new notes |
CANSLIM.net Company Profile |
SEC |
Zacks Reports |
StockTalk |
News |
Chart |
Request a new note
C
A N
S L
I M
|
Symbol/Exchange
Company Name
Industry Group |
PRICE |
CHANGE
(%Change) |
Day High |
Volume
(% DAV)
(% 50 day avg vol) |
52 Wk Hi
% From Hi |
Featured
Date |
Price
Featured |
Pivot Featured |
|
Max Buy |
ECPG
-
NASDAQ
Encore Capital Group Inc
FINANCIAL SERVICES - Credit Services
|
$28.30
|
-0.55
-1.91% |
$29.37
|
153,479
113.35% of 50 DAV
50 DAV is 135,400
|
$30.91
-8.44%
|
8/3/2012
|
$29.91
|
PP = $30.45
|
|
MB = $31.97
|
Most Recent Note - 10/2/2012 5:08:33 PM
G - Color code is changed to green after today's gap up was followed by a worrisome "negative reversal" and close near the session low also slumping back below its 50 DMA line. Disciplined investors always limit losses if ever a stock falls more than -7% from their purchase price.
>>> The latest Featured Stock Update with an annotated graph appeared on 9/12/2012. Click here.
View all notes |
Alert me of new notes |
CANSLIM.net Company Profile |
SEC |
Zacks Reports |
StockTalk |
News |
Chart |
Request a new note
C
A N
S L
I M
|
EXPE
-
NASDAQ
Expedia Inc
INTERNET - Internet Information Providers
|
$56.67
|
-0.27
-0.47% |
$57.77
|
2,357,560
72.46% of 50 DAV
50 DAV is 3,253,800
|
$60.29
-6.01%
|
4/27/2012
|
$41.80
|
PP = $35.57
|
|
MB = $37.35
|
Most Recent Note - 10/2/2012 5:16:06 PM
G - Forming a late-stage cup-with-handle type base and it is currently perched -6% off its 52-week high while quietly consolidating above its 50 DMA line. It has been noted 2 times in recently weeks - "No overhead supply remains to hinder its progress, however weak industry group action and iffy fundamentals were noted as causes for concern." See more details and an annotated graph in the latest FSU analysis under the headline "Online Travel Firm Resilient Despite Unfavorable Signs - Wednesday, September 19, 2012"
>>> The latest Featured Stock Update with an annotated graph appeared on 9/19/2012. Click here.
View all notes |
Alert me of new notes |
CANSLIM.net Company Profile |
SEC |
Zacks Reports |
StockTalk |
News |
Chart |
Request a new note
C
A N
S L
I M
|
GPX
-
NYSE
G P Strategies Corp
DIVERSIFIED SERVICES - Education and Training Services
|
$19.50
|
+0.06
0.31% |
$19.68
|
69,200
92.02% of 50 DAV
50 DAV is 75,200
|
$20.67
-5.66%
|
6/29/2012
|
$18.01
|
PP = $18.15
|
|
MB = $19.06
|
Most Recent Note - 10/2/2012 5:17:29 PM
G - Consolidating -5.7% off its 52-week high today, after a streak of 6 consecutive losses it found support at its 50 DMA line. More damaging losses would raise concerns and trigger technical sell signals.
>>> The latest Featured Stock Update with an annotated graph appeared on 9/13/2012. Click here.
View all notes |
Alert me of new notes |
CANSLIM.net Company Profile |
SEC |
Zacks Reports |
StockTalk |
News |
Chart |
Request a new note
C
A N
S L
I M
|
KH
-
NYSE
China Kanghui Hldgs Ads
HEALTH SERVICES - Medical Appliances and Equipment
|
$30.36
|
-0.04
-0.13% |
$30.44
|
1,017,065
1,064.99% of 50 DAV
50 DAV is 95,500
|
$30.53
-0.56%
|
8/30/2012
|
$24.19
|
PP = $22.90
|
|
MB = $24.05
|
Most Recent Note - 10/2/2012 12:13:09 PM
G - Holding its ground today. Gapped up for a considerable gain and new all-time high on 9/28/12 following news it will be acquired by Medtronic Inc (MDT). See the latest FSU analysis for more details and a new annotated graph.
>>> The latest Featured Stock Update with an annotated graph appeared on 10/1/2012. Click here.
View all notes |
Alert me of new notes |
CANSLIM.net Company Profile |
SEC |
Zacks Reports |
StockTalk |
News |
Chart |
Request a new note
C
A N
S L
I M
|
LKQ
-
NASDAQ
L K Q Corp
WHOLESALE - Auto Parts
|
$18.63
|
+0.06
0.33% |
$18.68
|
1,378,022
98.00% of 50 DAV
50 DAV is 1,406,200
|
$20.02
-6.92%
|
8/9/2012
|
$18.97
|
PP = $18.72
|
|
MB = $19.66
|
Most Recent Note - 10/1/2012 6:29:56 PM
G - Posted a gain on higher volume today but it remains below its 50 DMA line which may now act as resistance. Color code is changed to green. Do not be confused by a 2:1 share split effective 9/19/12 (Featured Price, Pivot Point and Max Buy were adjusted).
>>> The latest Featured Stock Update with an annotated graph appeared on 9/17/2012. Click here.
View all notes |
Alert me of new notes |
CANSLIM.net Company Profile |
SEC |
Zacks Reports |
StockTalk |
News |
Chart |
Request a new note
C
A N
S L
I M
|
Symbol/Exchange
Company Name
Industry Group |
PRICE |
CHANGE
(%Change) |
Day High |
Volume
(% DAV)
(% 50 day avg vol) |
52 Wk Hi
% From Hi |
Featured
Date |
Price
Featured |
Pivot Featured |
|
Max Buy |
LNKD
-
NYSE
Linkedin Corp Class A
INTERNET - Internet Information Providers
|
$118.77
|
+0.83
0.70% |
$120.20
|
1,011,448
40.77% of 50 DAV
50 DAV is 2,480,800
|
$125.50
-5.36%
|
9/5/2012
|
$113.25
|
PP = $113.10
|
|
MB = $118.76
|
Most Recent Note - 10/1/2012 6:31:28 PM
G - Consolidating -6.0% off its 52-week and all-time highs today with volume totals cooling in recent weeks. Prior highs near $113 define initial support to watch on pullbacks.
>>> The latest Featured Stock Update with an annotated graph appeared on 9/6/2012. Click here.
View all notes |
Alert me of new notes |
CANSLIM.net Company Profile |
SEC |
Zacks Reports |
StockTalk |
News |
Chart |
Request a new note
C
A N
S L
I M
|
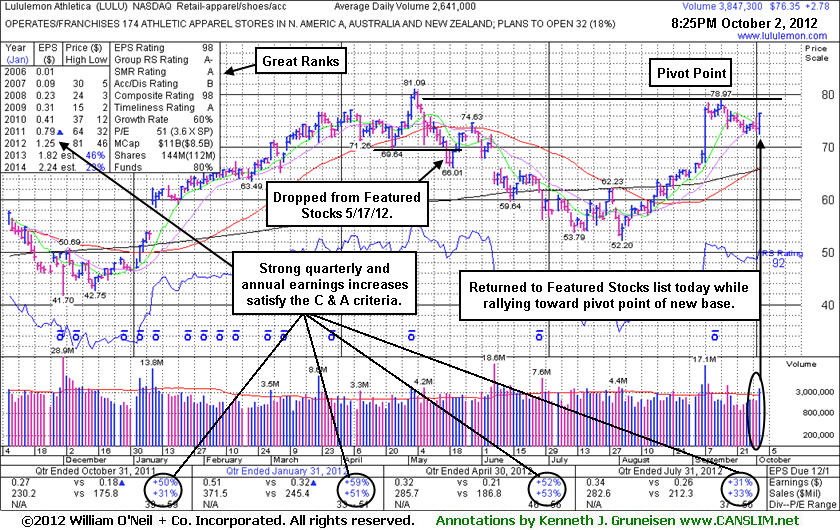
LULU
-
NASDAQ
Lululemon Athletica
MANUFACTURING - Textile Manufacturing
|
$76.35
|
+2.78
3.78% |
$76.42
|
3,852,458
145.87% of 50 DAV
50 DAV is 2,641,000
|
$81.09
-5.85%
|
10/2/2012
|
$74.89
|
PP = $78.97
|
|
MB = $82.92
|
Most Recent Note - 10/2/2012 8:49:27 PM
Y - Tallied a gain with above average volume today after highlighted in yellow with a new pivot point cited based on its 9/14/12 high while building on a cup-with-handle base pattern. Volume-driven gains above its pivot point are necessary to confirm a technical buy signal before action may be justified by disciplined investors. Fundamentals remain strong (good C and A criteria). Rebounded impressively after a deep consolidation below its 200 DMA line since dropped from the Featured Stocks list on 5/17/12. See the latest FSU analysis for more details and a new annotated graph.
>>> The latest Featured Stock Update with an annotated graph appeared on 10/2/2012. Click here.
View all notes |
Alert me of new notes |
CANSLIM.net Company Profile |
SEC |
Zacks Reports |
StockTalk |
News |
Chart |
Request a new note
C
A N
S L
I M
|
MIDD
-
NASDAQ
Middleby Corp
MANUFACTURING - Diversified Machinery
|
$118.15
|
+0.93
0.79% |
$118.58
|
76,352
73.70% of 50 DAV
50 DAV is 103,600
|
$122.57
-3.61%
|
8/9/2012
|
$118.60
|
PP = $104.92
|
|
MB = $110.17
|
Most Recent Note - 10/1/2012 5:59:10 PM
G - Perched -4.4% off its 52-week high after a gain today with higher (near average) volume. Extended from its prior base, and its 50 DMA line and recent lows define near-term chart support to watch.
>>> The latest Featured Stock Update with an annotated graph appeared on 9/18/2012. Click here.
View all notes |
Alert me of new notes |
CANSLIM.net Company Profile |
SEC |
Zacks Reports |
StockTalk |
News |
Chart |
Request a new note
C
A N
S L
I M
|
N
-
NYSE
Netsuite Inc
DIVERSIFIED SERVICES - Business/Management Services
|
$62.49
|
-0.19
-0.30% |
$63.90
|
691,876
107.70% of 50 DAV
50 DAV is 642,400
|
$64.26
-2.75%
|
8/20/2012
|
$55.88
|
PP = $59.32
|
|
MB = $62.29
|
Most Recent Note - 10/2/2012 5:20:55 PM
G - Consolidating above its "max buy" level. Prior highs near $59 define initial support above its 50 DMA line where violations would trigger technical sell signals.
>>> The latest Featured Stock Update with an annotated graph appeared on 9/24/2012. Click here.
View all notes |
Alert me of new notes |
CANSLIM.net Company Profile |
SEC |
Zacks Reports |
StockTalk |
News |
Chart |
Request a new note
C
A N
S L
I M
|
NSM
-
NYSE
Nationstar Mtg Hldgs Inc
FINANCIAL SERVICES - Credit Services
|
$34.66
|
-0.23
-0.66% |
$35.82
|
1,596,573
152.14% of 50 DAV
50 DAV is 1,049,400
|
$36.12
-4.04%
|
8/29/2012
|
$27.96
|
PP = $28.85
|
|
MB = $30.29
|
Most Recent Note - 10/1/2012 12:37:58 PM
G - Hit another new 52-week high today. After a spurt of volume-driven gains it is extended from its prior base. Disciplined investors avoid chasing stocks more than +5% above their pivot point.
>>> The latest Featured Stock Update with an annotated graph appeared on 9/7/2012. Click here.
View all notes |
Alert me of new notes |
CANSLIM.net Company Profile |
SEC |
Zacks Reports |
StockTalk |
News |
Chart |
Request a new note
C
A N
S L
I M
|
Symbol/Exchange
Company Name
Industry Group |
PRICE |
CHANGE
(%Change) |
Day High |
Volume
(% DAV)
(% 50 day avg vol) |
52 Wk Hi
% From Hi |
Featured
Date |
Price
Featured |
Pivot Featured |
|
Max Buy |
OSIS
-
NASDAQ
O S I Systems Inc
ELECTRONICS - Semiconductor Equipment and Mate
|
$76.54
|
-0.12
-0.16% |
$77.43
|
89,307
68.54% of 50 DAV
50 DAV is 130,300
|
$78.93
-3.03%
|
9/5/2012
|
$74.39
|
PP = $75.10
|
|
MB = $78.86
|
Most Recent Note - 10/2/2012 5:23:44 PM
Y - Consolidating just -3% off its 52-week high today. It remains below its "max buy" level after bullish action recently confirmed a technical buy signal. Near term support is at its 50 DMA line.
>>> The latest Featured Stock Update with an annotated graph appeared on 9/14/2012. Click here.
View all notes |
Alert me of new notes |
CANSLIM.net Company Profile |
SEC |
Zacks Reports |
StockTalk |
News |
Chart |
Request a new note
C
A N
S L
I M
|
RNF
-
NYSE
Rentech Nitrogen Ptnr Lp
CHEMICALS - Agricultural Chemicals
|
$37.71
|
-1.56
-3.97% |
$38.90
|
557,305
126.86% of 50 DAV
50 DAV is 439,300
|
$40.05
-5.84%
|
7/27/2012
|
$29.58
|
PP = $30.60
|
|
MB = $32.13
|
Most Recent Note - 9/27/2012 3:47:40 PM
G - Gapped up today, rebounding after a volume-driven loss on the prior session. It is extended from its prior base. An upward trendline defines near-term chart support that comes into play above its 50 DMA line.
>>> The latest Featured Stock Update with an annotated graph appeared on 8/31/2012. Click here.
View all notes |
Alert me of new notes |
CANSLIM.net Company Profile |
SEC |
Zacks Reports |
StockTalk |
News |
Chart |
Request a new note
C
A N
S L
I M
|
SWI
-
NYSE
Solarwinds Inc
COMPUTER SOFTWARE and SERVICES - Application Software
|
$55.57
|
+1.05
1.93% |
$55.78
|
677,309
59.58% of 50 DAV
50 DAV is 1,136,800
|
$60.95
-8.83%
|
7/25/2012
|
$47.82
|
PP = $47.89
|
|
MB = $50.28
|
Most Recent Note - 10/1/2012 6:59:04 PM
G - Slumped under its 50 DMA line today with a loss on near average volume. A subsequent violation of the 9/26/12 low ($53.78) would raise more serious concerns.
>>> The latest Featured Stock Update with an annotated graph appeared on 8/29/2012. Click here.
View all notes |
Alert me of new notes |
CANSLIM.net Company Profile |
SEC |
Zacks Reports |
StockTalk |
News |
Chart |
Request a new note
C
A N
S L
I M
|
TDG
-
NYSE
Transdigm Group Inc
AEROSPACE/DEFENSE - Aerospace/Defense Products and; Services
|
$142.08
|
+0.39
0.28% |
$143.37
|
363,667
86.46% of 50 DAV
50 DAV is 420,600
|
$146.72
-3.16%
|
8/16/2012
|
$132.23
|
PP = $136.44
|
|
MB = $143.26
|
Most Recent Note - 9/27/2012 12:58:09 PM
Y - Consolidating below its "max buy" level with volume running at an above average pace behind today's 2nd consecutive loss. Its 50 DMA line and prior highs define near-term support to watch on pullbacks.
>>> The latest Featured Stock Update with an annotated graph appeared on 9/20/2012. Click here.
View all notes |
Alert me of new notes |
CANSLIM.net Company Profile |
SEC |
Zacks Reports |
StockTalk |
News |
Chart |
Request a new note
C
A N
S L
I M
|
ULTA
-
NASDAQ
Ulta Salon Cosm & Frag
SPECIALTY RETAIL - Specialty Retail, Other
|
$96.30
|
-0.51
-0.53% |
$97.16
|
370,872
47.01% of 50 DAV
50 DAV is 789,000
|
$103.52
-6.97%
|
9/4/2012
|
$93.17
|
PP = $98.52
|
|
MB = $103.45
|
Most Recent Note - 9/26/2012 1:11:16 PM
Y - Slumping further below its pivot point with a loss on light volume today, raising concerns. Disciplined investors always limit losses if ever any stock falls -7% or more from their purchase price.
>>> The latest Featured Stock Update with an annotated graph appeared on 9/4/2012. Click here.
View all notes |
Alert me of new notes |
CANSLIM.net Company Profile |
SEC |
Zacks Reports |
StockTalk |
News |
Chart |
Request a new note
C
A N
S L
I M
|
Symbol/Exchange
Company Name
Industry Group |
PRICE |
CHANGE
(%Change) |
Day High |
Volume
(% DAV)
(% 50 day avg vol) |
52 Wk Hi
% From Hi |
Featured
Date |
Price
Featured |
Pivot Featured |
|
Max Buy |
ULTI
-
NASDAQ
Ultimate Software Group
INTERNET - Internet Software and Services
|
$101.76
|
-1.11
-1.08% |
$103.59
|
132,020
79.48% of 50 DAV
50 DAV is 166,100
|
$106.40
-4.36%
|
8/27/2012
|
$98.36
|
PP = $99.19
|
|
MB = $104.15
|
Most Recent Note - 9/27/2012 6:01:25 PM
Y - Today's solid gain with higher volume has halted a streak of 7 consecutive small losses. Prior chart highs define initial support to watch above its 50 DMA line. See the latest FSU analysis for more details and a new annotated graph.
>>> The latest Featured Stock Update with an annotated graph appeared on 9/27/2012. Click here.
View all notes |
Alert me of new notes |
CANSLIM.net Company Profile |
SEC |
Zacks Reports |
StockTalk |
News |
Chart |
Request a new note
C
A N
S L
I M
|
VSI
-
NYSE
Vitamin Shoppe Inc
SPECIALTY RETAIL - Specialty Retail, Other
|
$58.09
|
+0.35
0.61% |
$58.21
|
244,089
66.76% of 50 DAV
50 DAV is 365,600
|
$61.83
-6.04%
|
6/29/2012
|
$54.93
|
PP = $55.03
|
|
MB = $57.78
|
Most Recent Note - 9/27/2012 3:43:38 PM
G - Overcame early weakness today and managed a positive reversal. Prior lows near $52 define important chart support below its 50 DMA line.
>>> The latest Featured Stock Update with an annotated graph appeared on 9/10/2012. Click here.
View all notes |
Alert me of new notes |
CANSLIM.net Company Profile |
SEC |
Zacks Reports |
StockTalk |
News |
Chart |
Request a new note
C
A N
S L
I M
|
WPI
-
NYSE
Watson Pharmaceuticals
DRUGS - Drugs - Generic
|
$85.43
|
+0.29
0.34% |
$85.64
|
647,304
61.05% of 50 DAV
50 DAV is 1,060,200
|
$86.20
-0.89%
|
8/24/2012
|
$82.90
|
PP = $81.10
|
|
MB = $85.16
|
Most Recent Note - 9/28/2012 12:36:43 PM
G - Hitting a new 52-week high with today's volume-driven gain lifting it above the "max buy" level. Color code is changed to green after getting extended from its prior base. Prior highs in the $81 area and its 50 DMA line define important support to watch on pullbacks.
>>> The latest Featured Stock Update with an annotated graph appeared on 9/28/2012. Click here.
View all notes |
Alert me of new notes |
CANSLIM.net Company Profile |
SEC |
Zacks Reports |
StockTalk |
News |
Chart |
Request a new note
C
A N
S L
I M
|