***Last / Change / Volume data in this table is the closing quote data***
Symbol/Exchange
Company Name
Industry Group |
PRICE |
CHANGE
(%Change) |
Day High |
Volume
(% DAV)
(% 50 day avg vol) |
52 Wk Hi
% From Hi |
Featured
Date |
Price
Featured |
Pivot Featured |
|
Max Buy |
ALXN
-
NASDAQ
Alexion Pharmaceuticals
DRUGS - Drug Manufacturers - Other
|
$116.00
|
+1.60
1.40% |
$117.65
|
1,519,958
129.27% of 50 DAV
50 DAV is 1,175,800
|
$116.43
-0.37%
|
8/23/2012
|
$103.70
|
PP = $110.06
|
|
MB = $115.56
|
Most Recent Note - 9/26/2012 5:15:16 PM
Y - Pulled back from its 52 week high today. Color code is changed to yellow after retreating below its "max buy" level. See the latest FSU analysis for more details and a new annotated graph.
>>> The latest Featured Stock Update with an annotated graph appeared on 9/26/2012. Click here.
View all notes |
Alert me of new notes |
CANSLIM.net Company Profile |
SEC |
Zacks Reports |
StockTalk |
News |
Chart |
Request a new note
C
A N
S L
I M


|
ASPS
-
NASDAQ
Altisource Ptf Sltns Sa
REAL ESTATE - Property Management/Developmen
|
$88.49
|
+2.24
2.60% |
$88.59
|
189,310
144.95% of 50 DAV
50 DAV is 130,600
|
$92.29
-4.12%
|
9/24/2012
|
$87.24
|
PP = $92.39
|
|
MB = $97.01
|
 Most Recent Note - 10/1/2012 6:38:00 PM
Y - Today's 3rd consecutive gain had above average volume while rallying up from its 50 DMA line in the $82 area. Volume-driven gains above its pivot point may trigger a new (or add-on) technical buy signal.
>>> The latest Featured Stock Update with an annotated graph appeared on 9/11/2012. Click here.
View all notes |
Alert me of new notes |
CANSLIM.net Company Profile |
SEC |
Zacks Reports |
StockTalk |
News |
Chart |
Request a new note
C
A N
S L
I M
|
CFNL
-
NASDAQ
Cardinal Financial Corp
BANKING - Regional - Southeast Banks
|
$14.27
|
-0.03
-0.21% |
$14.53
|
168,595
239.48% of 50 DAV
50 DAV is 70,400
|
$14.79
-3.52%
|
8/17/2012
|
$12.84
|
PP = $13.31
|
|
MB = $13.98
|
Most Recent Note - 10/1/2012 12:22:07 PM
G - Still consolidating near its 52-week high today, holding its ground stubbornly after a spurt of volume-driven gains. Extended from its prior base, and its prior highs and 50 DMA line define support to watch on pullbacks near the $13 level.
>>> The latest Featured Stock Update with an annotated graph appeared on 9/25/2012. Click here.
View all notes |
Alert me of new notes |
CANSLIM.net Company Profile |
SEC |
Zacks Reports |
StockTalk |
News |
Chart |
Request a new note
C
A N
S L
I M
|
CMCSA
-
NASDAQ
Comcast Corp Cl A
MEDIA - CATV Systems
|
$35.38
|
-0.20
-0.57% |
$36.16
|
11,387,581
88.82% of 50 DAV
50 DAV is 12,820,500
|
$36.90
-4.12%
|
6/11/2012
|
$29.94
|
PP = $30.98
|
|
MB = $32.53
|
Most Recent Note - 9/27/2012 3:53:47 PM
G - Consolidating above prior highs after recently rallying from an orderly flat base. No new pivot point was cited because of fundamental concerns raised by sub par sales and earnings growth in the Jun '12 quarter.
>>> The latest Featured Stock Update with an annotated graph appeared on 9/21/2012. Click here.
View all notes |
Alert me of new notes |
CANSLIM.net Company Profile |
SEC |
Zacks Reports |
StockTalk |
News |
Chart |
Request a new note
C
A N
S L
I M
|
DVA
-
NYSE
Davita Inc
HEALTH SERVICES - Specialized Health Services
|
$103.44
|
-0.17
-0.16% |
$105.73
|
1,000,920
139.29% of 50 DAV
50 DAV is 718,600
|
$103.97
-0.51%
|
9/5/2012
|
$102.92
|
PP = $100.62
|
|
MB = $105.65
|
Most Recent Note - 9/27/2012 3:55:19 PM
Y - Gain today with light volume has it poised for a best-ever close. Considerable gain on 9/21/12 above its pivot point was backed by more than 3 times average volume confirming a technical buy signal.
>>> The latest Featured Stock Update with an annotated graph appeared on 9/5/2012. Click here.
View all notes |
Alert me of new notes |
CANSLIM.net Company Profile |
SEC |
Zacks Reports |
StockTalk |
News |
Chart |
Request a new note
C
A N
S L
I M
|
Symbol/Exchange
Company Name
Industry Group |
PRICE |
CHANGE
(%Change) |
Day High |
Volume
(% DAV)
(% 50 day avg vol) |
52 Wk Hi
% From Hi |
Featured
Date |
Price
Featured |
Pivot Featured |
|
Max Buy |
ECPG
-
NASDAQ
Encore Capital Group Inc
FINANCIAL SERVICES - Credit Services
|
$28.85
|
+0.59
2.09% |
$28.86
|
186,942
140.66% of 50 DAV
50 DAV is 132,900
|
$30.91
-6.66%
|
8/3/2012
|
$29.91
|
PP = $30.45
|
|
MB = $31.97
|
Most Recent Note - 10/1/2012 6:51:23 PM
Y - Color code is changed to yellow after today's rebound above its 50 DMA line with a gain on higher volume. Disciplined investors always limit losses if ever a stock falls more than -7% from their purchase price.
>>> The latest Featured Stock Update with an annotated graph appeared on 9/12/2012. Click here.
View all notes |
Alert me of new notes |
CANSLIM.net Company Profile |
SEC |
Zacks Reports |
StockTalk |
News |
Chart |
Request a new note
C
A N
S L
I M
|
EXPE
-
NASDAQ
Expedia Inc
INTERNET - Internet Information Providers
|
$56.94
|
-0.90
-1.56% |
$58.30
|
1,788,075
54.73% of 50 DAV
50 DAV is 3,267,100
|
$60.29
-5.56%
|
4/27/2012
|
$41.80
|
PP = $35.57
|
|
MB = $37.35
|
Most Recent Note - 9/27/2012 3:58:26 PM
G - Holding its ground perched near its 52-week high. No overhead supply remains to hinder its progress, however weak industry group action and iffy fundamentals were noted as causes for concern.
>>> The latest Featured Stock Update with an annotated graph appeared on 9/19/2012. Click here.
View all notes |
Alert me of new notes |
CANSLIM.net Company Profile |
SEC |
Zacks Reports |
StockTalk |
News |
Chart |
Request a new note
C
A N
S L
I M
|
GPX
-
NYSE
G P Strategies Corp
DIVERSIFIED SERVICES - Education and Training Services
|
$19.44
|
+0.12
0.62% |
$19.75
|
48,716
64.52% of 50 DAV
50 DAV is 75,500
|
$20.67
-5.95%
|
6/29/2012
|
$18.01
|
PP = $18.15
|
|
MB = $19.06
|
Most Recent Note - 9/26/2012 1:15:39 PM
G - Consolidating -6.9% off its 52-week high today after 6 consecutive losses, now testing support at its 50 DMA line. More damaging losses would raise concerns and trigger a technical sell signal.
>>> The latest Featured Stock Update with an annotated graph appeared on 9/13/2012. Click here.
View all notes |
Alert me of new notes |
CANSLIM.net Company Profile |
SEC |
Zacks Reports |
StockTalk |
News |
Chart |
Request a new note
C
A N
S L
I M
|
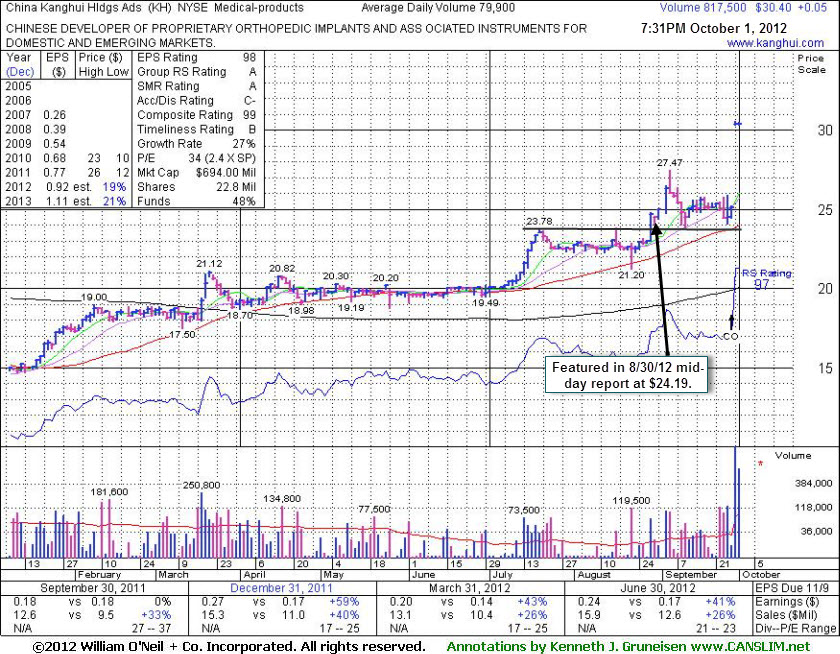
KH
-
NYSE
China Kanghui Hldgs Ads
HEALTH SERVICES - Medical Appliances and Equipment
|
$30.40
|
+0.05
0.16% |
$30.48
|
817,591
1,023.27% of 50 DAV
50 DAV is 79,900
|
$30.53
-0.43%
|
8/30/2012
|
$24.19
|
PP = $22.90
|
|
MB = $24.05
|
Most Recent Note - 10/1/2012 12:35:33 PM
G - Holding its ground today. Gapped up for a considerable gain and new all-time high on 9/28/12 following news it will be acquired by Medtronic Inc (MDT).
>>> The latest Featured Stock Update with an annotated graph appeared on 10/1/2012. Click here.
View all notes |
Alert me of new notes |
CANSLIM.net Company Profile |
SEC |
Zacks Reports |
StockTalk |
News |
Chart |
Request a new note
C
A N
S L
I M
|
LKQ
-
NASDAQ
L K Q Corp
WHOLESALE - Auto Parts
|
$18.57
|
+0.09
0.51% |
$18.70
|
2,608,805
190.48% of 50 DAV
50 DAV is 1,369,600
|
$20.02
-7.22%
|
8/9/2012
|
$18.97
|
PP = $18.72
|
|
MB = $19.66
|
Most Recent Note - 10/1/2012 6:29:56 PM
G - Posted a gain on higher volume today but it remains below its 50 DMA line which may now act as resistance. Color code is changed to green. Do not be confused by a 2:1 share split effective 9/19/12 (Featured Price, Pivot Point and Max Buy were adjusted).
>>> The latest Featured Stock Update with an annotated graph appeared on 9/17/2012. Click here.
View all notes |
Alert me of new notes |
CANSLIM.net Company Profile |
SEC |
Zacks Reports |
StockTalk |
News |
Chart |
Request a new note
C
A N
S L
I M
|
Symbol/Exchange
Company Name
Industry Group |
PRICE |
CHANGE
(%Change) |
Day High |
Volume
(% DAV)
(% 50 day avg vol) |
52 Wk Hi
% From Hi |
Featured
Date |
Price
Featured |
Pivot Featured |
|
Max Buy |
LNKD
-
NYSE
Linkedin Corp Class A
INTERNET - Internet Information Providers
|
$117.94
|
-2.46
-2.04% |
$120.97
|
1,736,654
70.27% of 50 DAV
50 DAV is 2,471,500
|
$125.50
-6.02%
|
9/5/2012
|
$113.25
|
PP = $113.10
|
|
MB = $118.76
|
Most Recent Note - 10/1/2012 6:31:28 PM
G - Consolidating -6.0% off its 52-week and all-time highs today with volume totals cooling in recent weeks. Prior highs near $113 define initial support to watch on pullbacks.
>>> The latest Featured Stock Update with an annotated graph appeared on 9/6/2012. Click here.
View all notes |
Alert me of new notes |
CANSLIM.net Company Profile |
SEC |
Zacks Reports |
StockTalk |
News |
Chart |
Request a new note
C
A N
S L
I M
|
MIDD
-
NASDAQ
Middleby Corp
MANUFACTURING - Diversified Machinery
|
$117.22
|
+1.58
1.37% |
$118.42
|
87,822
85.35% of 50 DAV
50 DAV is 102,900
|
$122.57
-4.36%
|
8/9/2012
|
$118.60
|
PP = $104.92
|
|
MB = $110.17
|
Most Recent Note - 10/1/2012 5:59:10 PM
G - Perched -4.4% off its 52-week high after a gain today with higher (near average) volume. Extended from its prior base, and its 50 DMA line and recent lows define near-term chart support to watch.
>>> The latest Featured Stock Update with an annotated graph appeared on 9/18/2012. Click here.
View all notes |
Alert me of new notes |
CANSLIM.net Company Profile |
SEC |
Zacks Reports |
StockTalk |
News |
Chart |
Request a new note
C
A N
S L
I M
|
N
-
NYSE
Netsuite Inc
DIVERSIFIED SERVICES - Business/Management Services
|
$62.68
|
-1.12
-1.76% |
$64.20
|
625,315
96.71% of 50 DAV
50 DAV is 646,600
|
$64.26
-2.46%
|
8/20/2012
|
$55.88
|
PP = $59.32
|
|
MB = $62.29
|
Most Recent Note - 9/27/2012 3:46:19 PM
G - Rallying above its "max buy" level with today's gain and its color code is changed to green. Prior highs near $59 define initial support above its 50 DMA line.
>>> The latest Featured Stock Update with an annotated graph appeared on 9/24/2012. Click here.
View all notes |
Alert me of new notes |
CANSLIM.net Company Profile |
SEC |
Zacks Reports |
StockTalk |
News |
Chart |
Request a new note
C
A N
S L
I M
|
NSM
-
NYSE
Nationstar Mtg Hldgs Inc
FINANCIAL SERVICES - Credit Services
|
$34.89
|
+1.71
5.15% |
$36.12
|
3,197,021
322.35% of 50 DAV
50 DAV is 991,800
|
$34.90
-0.03%
|
8/29/2012
|
$27.96
|
PP = $28.85
|
|
MB = $30.29
|
Most Recent Note - 10/1/2012 12:37:58 PM
G - Hit another new 52-week high today. After a spurt of volume-driven gains it is extended from its prior base. Disciplined investors avoid chasing stocks more than +5% above their pivot point.
>>> The latest Featured Stock Update with an annotated graph appeared on 9/7/2012. Click here.
View all notes |
Alert me of new notes |
CANSLIM.net Company Profile |
SEC |
Zacks Reports |
StockTalk |
News |
Chart |
Request a new note
C
A N
S L
I M
|
OSIS
-
NASDAQ
O S I Systems Inc
ELECTRONICS - Semiconductor Equipment and Mate
|
$76.66
|
-1.18
-1.52% |
$78.93
|
142,702
110.79% of 50 DAV
50 DAV is 128,800
|
$78.88
-2.81%
|
9/5/2012
|
$74.39
|
PP = $75.10
|
|
MB = $78.86
|
Most Recent Note - 9/27/2012 3:39:13 PM
Y - Hitting a new 52-week high today with a volume-driven gain, approaching its "max buy" level. Near term support is at its 50 DMA line.
>>> The latest Featured Stock Update with an annotated graph appeared on 9/14/2012. Click here.
View all notes |
Alert me of new notes |
CANSLIM.net Company Profile |
SEC |
Zacks Reports |
StockTalk |
News |
Chart |
Request a new note
C
A N
S L
I M
|
Symbol/Exchange
Company Name
Industry Group |
PRICE |
CHANGE
(%Change) |
Day High |
Volume
(% DAV)
(% 50 day avg vol) |
52 Wk Hi
% From Hi |
Featured
Date |
Price
Featured |
Pivot Featured |
|
Max Buy |
RNF
-
NYSE
Rentech Nitrogen Ptnr Lp
CHEMICALS - Agricultural Chemicals
|
$39.27
|
+0.51
1.32% |
$39.95
|
429,093
98.82% of 50 DAV
50 DAV is 434,200
|
$40.05
-1.95%
|
7/27/2012
|
$29.58
|
PP = $30.60
|
|
MB = $32.13
|
Most Recent Note - 9/27/2012 3:47:40 PM
G - Gapped up today, rebounding after a volume-driven loss on the prior session. It is extended from its prior base. An upward trendline defines near-term chart support that comes into play above its 50 DMA line.
>>> The latest Featured Stock Update with an annotated graph appeared on 8/31/2012. Click here.
View all notes |
Alert me of new notes |
CANSLIM.net Company Profile |
SEC |
Zacks Reports |
StockTalk |
News |
Chart |
Request a new note
C
A N
S L
I M
|
SWI
-
NYSE
Solarwinds Inc
COMPUTER SOFTWARE and SERVICES - Application Software
|
$54.52
|
-1.22
-2.19% |
$56.52
|
1,190,062
106.23% of 50 DAV
50 DAV is 1,120,300
|
$60.95
-10.55%
|
7/25/2012
|
$47.82
|
PP = $47.89
|
|
MB = $50.28
|
Most Recent Note - 10/1/2012 6:59:04 PM
G - Slumped under its 50 DMA line today with a loss on near average volume. A subsequent violation of the 9/26/12 low ($53.78) would raise more serious concerns.
>>> The latest Featured Stock Update with an annotated graph appeared on 8/29/2012. Click here.
View all notes |
Alert me of new notes |
CANSLIM.net Company Profile |
SEC |
Zacks Reports |
StockTalk |
News |
Chart |
Request a new note
C
A N
S L
I M
|
TDG
-
NYSE
Transdigm Group Inc
AEROSPACE/DEFENSE - Aerospace/Defense Products and; Services
|
$141.69
|
-0.18
-0.13% |
$142.83
|
453,224
108.74% of 50 DAV
50 DAV is 416,800
|
$146.72
-3.43%
|
8/16/2012
|
$132.23
|
PP = $136.44
|
|
MB = $143.26
|
Most Recent Note - 9/27/2012 12:58:09 PM
Y - Consolidating below its "max buy" level with volume running at an above average pace behind today's 2nd consecutive loss. Its 50 DMA line and prior highs define near-term support to watch on pullbacks.
>>> The latest Featured Stock Update with an annotated graph appeared on 9/20/2012. Click here.
View all notes |
Alert me of new notes |
CANSLIM.net Company Profile |
SEC |
Zacks Reports |
StockTalk |
News |
Chart |
Request a new note
C
A N
S L
I M
|
ULTA
-
NASDAQ
Ulta Salon Cosm & Frag
SPECIALTY RETAIL - Specialty Retail, Other
|
$96.81
|
+0.51
0.52% |
$97.97
|
460,451
57.39% of 50 DAV
50 DAV is 802,300
|
$103.52
-6.48%
|
9/4/2012
|
$93.17
|
PP = $98.52
|
|
MB = $103.45
|
Most Recent Note - 9/26/2012 1:11:16 PM
Y - Slumping further below its pivot point with a loss on light volume today, raising concerns. Disciplined investors always limit losses if ever any stock falls -7% or more from their purchase price.
>>> The latest Featured Stock Update with an annotated graph appeared on 9/4/2012. Click here.
View all notes |
Alert me of new notes |
CANSLIM.net Company Profile |
SEC |
Zacks Reports |
StockTalk |
News |
Chart |
Request a new note
C
A N
S L
I M
|
ULTI
-
NASDAQ
Ultimate Software Group
INTERNET - Internet Software and Services
|
$102.87
|
+0.77
0.75% |
$103.05
|
217,806
132.57% of 50 DAV
50 DAV is 164,300
|
$106.40
-3.32%
|
8/27/2012
|
$98.36
|
PP = $99.19
|
|
MB = $104.15
|
Most Recent Note - 9/27/2012 6:01:25 PM
Y - Today's solid gain with higher volume has halted a streak of 7 consecutive small losses. Prior chart highs define initial support to watch above its 50 DMA line. See the latest FSU analysis for more details and a new annotated graph.
>>> The latest Featured Stock Update with an annotated graph appeared on 9/27/2012. Click here.
View all notes |
Alert me of new notes |
CANSLIM.net Company Profile |
SEC |
Zacks Reports |
StockTalk |
News |
Chart |
Request a new note
C
A N
S L
I M
|
Symbol/Exchange
Company Name
Industry Group |
PRICE |
CHANGE
(%Change) |
Day High |
Volume
(% DAV)
(% 50 day avg vol) |
52 Wk Hi
% From Hi |
Featured
Date |
Price
Featured |
Pivot Featured |
|
Max Buy |
VSI
-
NYSE
Vitamin Shoppe Inc
SPECIALTY RETAIL - Specialty Retail, Other
|
$57.74
|
-0.58
-0.99% |
$58.80
|
278,002
76.29% of 50 DAV
50 DAV is 364,400
|
$61.83
-6.61%
|
6/29/2012
|
$54.93
|
PP = $55.03
|
|
MB = $57.78
|
Most Recent Note - 9/27/2012 3:43:38 PM
G - Overcame early weakness today and managed a positive reversal. Prior lows near $52 define important chart support below its 50 DMA line.
>>> The latest Featured Stock Update with an annotated graph appeared on 9/10/2012. Click here.
View all notes |
Alert me of new notes |
CANSLIM.net Company Profile |
SEC |
Zacks Reports |
StockTalk |
News |
Chart |
Request a new note
C
A N
S L
I M
|
WPI
-
NYSE
Watson Pharmaceuticals
DRUGS - Drugs - Generic
|
$85.14
|
-0.02
-0.02% |
$86.20
|
994,847
92.36% of 50 DAV
50 DAV is 1,077,100
|
$86.07
-1.08%
|
8/24/2012
|
$82.90
|
PP = $81.10
|
|
MB = $85.16
|
Most Recent Note - 9/28/2012 12:36:43 PM
G - Hitting a new 52-week high with today's volume-driven gain lifting it above the "max buy" level. Color code is changed to green after getting extended from its prior base. Prior highs in the $81 area and its 50 DMA line define important support to watch on pullbacks.
>>> The latest Featured Stock Update with an annotated graph appeared on 9/28/2012. Click here.
View all notes |
Alert me of new notes |
CANSLIM.net Company Profile |
SEC |
Zacks Reports |
StockTalk |
News |
Chart |
Request a new note
C
A N
S L
I M
|