You are not logged in.
This means you
CAN ONLY VIEW reports that were published prior to Monday, April 14, 2025.
You
MUST UPGRADE YOUR MEMBERSHIP if you want to see any current reports.
AFTER MARKET UPDATE - THURSDAY, OCTOBER 1ST, 2009
Previous After Market Report Next After Market Report >>>
|
|
|
|
DOW |
-203.00 |
9,509.28 |
-2.09% |
|
Volume |
1,602,100,900 |
-10% |
|
Volume |
2,758,907,380 |
-0% |
|
NASDAQ |
-64.94 |
2,057.48 |
-3.06% |
|
Advancers |
503 |
16% |
|
Advancers |
479 |
17% |
|
S&P 500 |
-27.23 |
1,029.85 |
-2.58% |
|
Decliners |
2,519 |
81% |
|
Decliners |
2,237 |
79% |
|
Russell 2000 |
-20.53 |
583.75 |
-3.40% |
|
52 Wk Highs |
124 |
|
|
52 Wk Highs |
37 |
|
|
S&P 600 |
-9.90 |
307.53 |
-3.12% |
|
52 Wk Lows |
3 |
|
|
52 Wk Lows |
11 |
|
|
 |
Above Average Volume And Negative Breadth As Major Averages Fall Again
Adam Sarhan, Contributing Writer,
The major averages experienced their largest single day-decline in over a month after a key manufacturing report unexpectedly fell and jobless claims grew more than forecast. Volume was reported at above average levels near but just under the prior session's totals on the NYSE and on the Nasdaq exchange. The lower volume helped the market indices avoid another distribution day, however breadth was very negative as decliners led advancers by a 5-to-1 ratio on the NYSE and by a 4-to-1 ratio on the Nasdaq exchange. There were only 8 high-ranked companies from the CANSLIM.net Leaders List that made a new 52-week high and appeared on the CANSLIM.net BreakOuts Page, down markedly from the 21 issues that appeared on the prior session. New 52-week highs still outnumbered new 52-week lows on both exchanges.
Stocks got smacked on the first day of the fourth quarter after a batch of weaker than expected economic data was released. The Labor Department said the number of Americans filing first-time claims for unemployment benefits rose by +17,000 to 551,000 last week. Before Friday's opening bell, the Labor Department is slated to report a last month's unemployment data. The concern here is that unemployment has been raising for the past few months and many pundits are concerned that the effects of the world-wide stimulus program are beginning to wane. The International Monetary Fund (IMF) believes that these two factors will hinder economic growth for 2010. The IMF believes that the US economy will grow by +1.5% in 2010, after contracting -2.7% in 2009.
The bears showed up and sent the market lower after the Institute for Supply Management (ISM) said its manufacturing index slid to 52.6 in September which was lower than the reading of 54 projected by economists. This echoed yesterday's weaker than expected Chicago PMI report. The benchmark S&P 500 Index surged nearly +15% in the third quarter which was the strongest quarterly gain in over a decade. The S&P 500 Index rallied a stunning +34% in the past two quarters which is the largest back-to-back quarterly gain since a +42% surge in the first half of 1975. The blue chip Dow Industrial Average vaulted +15% last quarter and advanced +29% since the end of Q1, which is the largest two-quarter rally since 1986! From our perspective, the current rally which is currently in its 30th week is getting tired and appears to be under pressure since the September 23, 2009 negative reversal. Since then, there have been a flurry of distribution days and a series of leading stocks have been hit. Looking forward, the next area of support is the 7-month upward trendline and 50-day moving average (DMA) line for each of the major averages. If those technical levels are breached, downward momentum could more likely build and be expected to bring even lower prices.
Raising cash and avoiding a considerable setback is easy, and it is definitely the thing to do if the market conditions continue to erode. Take a look carefully at each of your holdings on a case by case basis, and simply remove the weakest performers first. Never let any losses grow larger than 7-8% without taking action and selling. PICTURED: The Nasdaq Composite Index's 7-month upward trendline and 50 DMA line closely coincide as important support levels all chart readers will be watching in the near-term. Deterioration in the market's technical trend would be undeniable if they are decisively violated.
|
|
|
 |
Banks, Gold, and Tech Groups Among Worst Decliners
Kenneth J. Gruneisen - Passed the CAN SLIM® Master's Exam
The Healthcare Index ($HMO -1.07%) held its ground better than most groups on Thursday, meanwhile, other defensive "safe haven" areas didn't hold up well at all. The Gold & Silver Index ($XAU -4.60%) fell hard and weaker energy shares dragged the Oil Services Index ($OSX -3.56%) and Integrated Oil Index ($XOI -2.64%) lower. Tech shares also were zapped with large losses as the Semiconductor Index ($SOX -4.84%) spiraled nearly -5% lower. The Networking Index ($NWX -4.16%), Biotechnology Index ($BTK -3.52%), and Internet Index ($IIX -2.63%) also suffered big losses. The influential Retail Index ($RLX -1.88%) and Broker/Dealer Index ($XBD -2.53%) also fell moderately.
Charts courtesy www.stockcharts.com
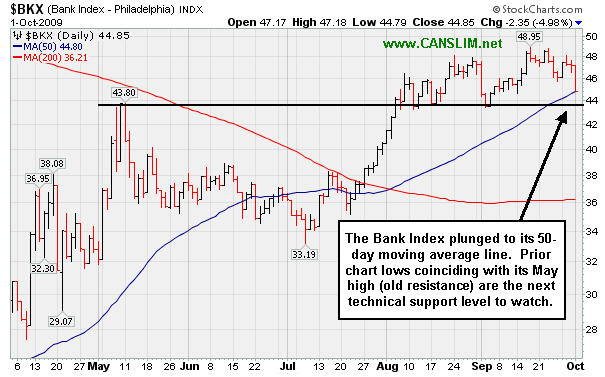
PICTURED: The Bank Index ($BKX -4.98%) was a standout decliner, sinking right to its 50-day moving average line. Prior chart lows coinciding with its May high (old resistance) are the next technical support level to watch. Long-time CANSLIM.net members know how important it is to monitor financial shares' direction, since they are a proven leading indicator.
| Oil Services |
$OSX |
185.71 |
-6.85 |
-3.56% |
+52.99% |
| Healthcare |
$HMO |
1,145.90 |
-12.42 |
-1.07% |
+19.34% |
| Integrated Oil |
$XOI |
997.42 |
-27.02 |
-2.64% |
+1.81% |
| Semiconductor |
$SOX |
309.97 |
-15.78 |
-4.84% |
+46.10% |
| Networking |
$NWX |
227.65 |
-9.88 |
-4.16% |
+58.21% |
| Internet |
$IIX |
213.20 |
-5.76 |
-2.63% |
+59.38% |
| Broker/Dealer |
$XBD |
116.43 |
-3.02 |
-2.53% |
+50.29% |
| Retail |
$RLX |
370.40 |
-7.10 |
-1.88% |
+32.64% |
| Gold & Silver |
$XAU |
157.80 |
-7.61 |
-4.60% |
+27.41% |
| Bank |
$BKX |
44.85 |
-2.35 |
-4.98% |
+1.20% |
| Biotech |
$BTK |
890.42 |
-32.53 |
-3.52% |
+37.59% |
|
|
|
 |
|
|
|
Color Codes Explained :
Y - Better candidates highlighted by our
staff of experts.
G - Previously featured
in past reports as yellow but may no longer be buyable under the
guidelines.
***Last / Change / Volume quote data in this table corresponds with the timestamp on the note***
Symbol/Exchange
Company Name
Industry Group |
Last |
Chg. |
Vol
% DAV |
Date Featured |
Price Featured |
Latest Pivot Point
Featured |
Status |
| Latest Max Buy Price |
ARO
- NYSE
Aeropostale Inc
RETAIL - Apparel Stores
|
$42.02
|
-1.45
|
2,977,427
111% DAV
2,673,900
|
8/21/2009
(Date
Featured) |
$39.21
(Price
Featured) |
PP = $38.84 |
G |
| MB = $40.78 |
Most Recent Note - 10/1/2009 4:26:45 PM
G - Gapped down today for a loss on higher volume. This high-ranked leader in the Retail - Clothing/shoe group is extended from a sound base and not buyable under the investment system guidelines now. Support to watch is at prior highs in the $38 area. It was featured in yellow in the 8/21/09 Mid-Day BreakOuts Report (read here).
>>> The latest Featured Stock Update with an annotated graph appeared on 9/18/2009. click here.
|
|
C
A
S
I |
News |
Chart |
SEC
View all notes Alert
me of new notes
Company
Profile
|
ARST
-
|
$22.39
|
-1.68
|
731,177
105% DAV
693,800
|
9/1/2009
(Date
Featured) |
$19.91
(Price
Featured) |
PP = $20.90 |
G |
| MB = $21.95 |
Most Recent Note - 10/1/2009 4:33:38 PM
G - Gapped down today and suffered a considerable loss on average volume, amid widespread market weakness. Recent lows may be considered an initial support level. Prior chart highs and its 50 DMA line, coinciding in the $20 area, define an important technical support level to watch on pullbacks.
>>> The latest Featured Stock Update with an annotated graph appeared on 9/17/2009. click here.
|
|
C
A
S
I |
News |
Chart |
SEC
View all notes Alert
me of new notes
Company
Profile
|
BIDU
- NASDAQ
Baidu Inc Ads
INTERNET - Internet Information Providers
|
$372.02
|
-19.03
|
2,611,994
151% DAV
1,726,300
|
9/8/2009
(Date
Featured) |
$351.80
(Price
Featured) |
PP = $368.59 |
Y |
| MB = $387.02 |
Most Recent Note - 10/1/2009 4:38:53 PM
Y - Loss today on higher volume was indicative of moderate distributional pressure, sending it toward its latest pivot point. Color code is changed to yellow, yet deteriorating market conditions (the M criteria) give cause for great caution. BIDU was featured in yellow in the 9/08/09 Mid-Day BreakOuts Report (read here).
>>> The latest Featured Stock Update with an annotated graph appeared on 9/21/2009. click here.
|
|
C
A
S
I |
News |
Chart |
SEC
View all notes Alert
me of new notes
Company
Profile
|
CACC
- NASDAQ
Credit Acceptance Corp
FINANCIAL SERVICES - Credit Services
|
$30.96
|
-1.23
|
58,826
144% DAV
40,800
|
9/29/2009
(Date
Featured) |
$33.48
(Price
Featured) |
PP = $32.60 |
Y |
| MB = $34.23 |
Most Recent Note - 10/1/2009 4:49:37 PM
Y - Loss today on above average but lighter volume raised concerns as it finished below August's high closes. Technically it has negated its latest breakout after a heavy dose of distributional pressure. On 9/29/09 it rose from a 6-week base after consolidating and finding support near its 50 DMA line. The Finance - Consumer/Commercial Loans firm has maintained a great track record of annual and quarterly sales revenues and earnings increases. It was featured on 9/29/09 in yellow in the mid-day report (read here).
>>> The latest Featured Stock Update with an annotated graph appeared on 9/29/2009. click here.
|
|
C
A
S
I |
News |
Chart |
SEC
View all notes Alert
me of new notes
Company
Profile
|
CRM
- NYSE
Salesforce.com Inc
INTERNET - Internet Software & Services
|
$54.55
|
-2.38
|
1,546,656
75% DAV
2,074,000
|
8/16/2009
(Date
Featured) |
$47.12
(Price
Featured) |
PP = $45.59 |
G |
| MB = $47.87 |
Most Recent Note - 10/1/2009 4:55:57 PM
G -After wedging higher in recent weeks, today's third consecutive loss on light volume leaves it near prior highs in the $55 area, an intial support level. More substantial technical support to watch is at its upward trendline and 50 DMA line now coinciding in the $51 area.
>>> The latest Featured Stock Update with an annotated graph appeared on 9/15/2009. click here.
|
|
C
A
S
I |
News |
Chart |
SEC
View all notes Alert
me of new notes
Company
Profile
|
EBIX
- NASDAQ
Ebix Inc
COMPUTER SOFTWARE & SERVICES - Business Software & Services
|
$52.47
|
-2.89
|
488,548
311% DAV
157,100
|
8/28/2009
(Date
Featured) |
$45.86
(Price
Featured) |
PP = $45.35 |
G |
| MB = $47.62 |
Most Recent Note - 10/1/2009 4:57:28 PM
G - Hit a new all-time high today and then negatively reversed and closed near its session low, a sign of distributional pressure after 3 consecutive big gains on heavy volume. It has not formed a new sound base since heavy distributional pressure led to a pullback near support at early-August chart highs and its 50 DMA line in the $45 area.
>>> The latest Featured Stock Update with an annotated graph appeared on 9/24/2009. click here.
|
|
C
A
S
I |
News |
Chart |
SEC
View all notes Alert
me of new notes
Company
Profile
|
GMCR
- NASDAQ
Green Mtn Coffee Roastrs
FOOD & BEVERAGE - Processed & Packaged Goods
|
$70.80
|
-3.04
|
1,223,199
82% DAV
1,495,300
|
7/17/2009
(Date
Featured) |
$60.15
(Price
Featured) |
PP = $63.79 |
G |
| MB = $66.98 |
Most Recent Note - 10/1/2009 5:02:21 PM
G - Loss today on light volume, closing just above its July-September high closes in the $70 area, possibly forming a high handle.
>>> The latest Featured Stock Update with an annotated graph appeared on 9/23/2009. click here.
|
|
C
A
S
I |
News |
Chart |
SEC
View all notes Alert
me of new notes
Company
Profile
|
NTES
- NASDAQ
Netease Inc Adr
INTERNET - Internet Information Providers
|
$44.78
|
-0.90
|
1,236,350
60% DAV
2,048,400
|
9/23/2009
(Date
Featured) |
$47.11
(Price
Featured) |
PP = $47.04 |
G |
| MB = $49.39 |
Most Recent Note - 10/1/2009 5:05:43 PM
G- Quietly consolidating near important support at its 50 DMA line and upward trendline. Deterioration below those levels would raise more serious concerns and trigger technical sell signals. Color code was changed to green based on promptly negating its latest breakout and then trading more than -7% below its pivot point. This may also be considered a riskier late-stage base.
>>> The latest Featured Stock Update with an annotated graph appeared on 9/25/2009. click here.
|
|
C
A
S
I |
News |
Chart |
SEC
View all notes Alert
me of new notes
Company
Profile
|
NVEC
- NASDAQ
N V E Corp
ELECTRONICS - Semiconductor - Specialized
|
$50.74
|
-2.42
|
72,447
77% DAV
94,200
|
8/26/2009
(Date
Featured) |
$55.32
(Price
Featured) |
PP = $57.60 |
G |
| MB = $60.48 |
Most Recent Note - 10/1/2009 5:15:38 PM
G - Loss again today on light volume, slumping further below its 50 DMA line and near prior chart lows in the $49 area. Any further deterioration leading to a new low close, especially if on heavy volume, negating its 7/23/09 breakaway gap would raise serious concerns and trigger a more worrisome technical sell signal.
>>> The latest Featured Stock Update with an annotated graph appeared on 9/30/2009. click here.
|
|
C
A
S
I |
News |
Chart |
SEC
View all notes Alert
me of new notes
Company
Profile
|
PEGA
- NASDAQ
Pegasystems Inc
COMPUTER SOFTWARE & SERVICES - Business Software & Services
|
$32.68
|
-1.85
|
313,902
80% DAV
392,300
|
9/9/2009
(Date
Featured) |
$31.14
(Price
Featured) |
PP = $33.35 |
Y |
| MB = $35.02 |
Most Recent Note - 10/1/2009 5:20:14 PM
Y - Considerable loss today with volume still below average, pulling back near an upward trendline connecting its July-September chart lows that may be considered an initial support level just above its 50 DMA line. Since 9/16/09 volume has been below average, or average, behind recent gains and losses for this high-ranked Computer Software - Financial firm.
>>> The latest Featured Stock Update with an annotated graph appeared on 9/22/2009. click here.
|
|
C
A
S
I |
News |
Chart |
SEC
View all notes Alert
me of new notes
Company
Profile
|
SWI
- NYSE
Solarwinds Inc
COMPUTER SOFTWARE & SERVICES - Application Software
|
$21.43
|
-0.60
|
382,529
76% DAV
501,700
|
9/30/2029
(Date
Featured) |
$22.03
(Price
Featured) |
PP = $21.72 |
Y |
| MB = $22.81 |
Most Recent Note - 10/1/2009 5:25:03 PM
Y - Today's third consecutive loss on light volume left it near its 8/04/09 high close of $21.35 , where a lower close would completely negate its latest breakout. It was featured today in the just-published October issue of CANSLIM.net News (read here).
>>> The latest Featured Stock Update with an annotated graph appeared on 9/30/2009. click here.
|
|
C
A
S
I |
News |
Chart |
SEC
View all notes Alert
me of new notes
Company
Profile
|
WNS
- NYSE
W N S Holdings Ltd Ads
DIVERSIFIED SERVICES - Business/Management Services
|
$15.82
|
-0.16
|
59,691
122% DAV
48,900
|
9/28/2009
(Date
Featured) |
$15.28
(Price
Featured) |
PP = $16.10 |
Y |
| MB = $16.91 |
Most Recent Note - 10/1/2009 5:27:53 PM
Y - Small loss on near average volume today. It traded up as high as $16.50 on the two prior sessions but it has encountered stubborn resistance in the $16 area despite its considerable 9/29/09 gain for a new 52-week high and new high close with volume 11 times its daily average volume. It formed an orderly flat base for at least 5-weeks, and it was featured in yellow in the 9/28/09 mid-day report (read here). Quarterly earnings have been above the +25% guideline and its annual earnings history has been great, satisfying the C & A criteria. However, sales revenues growth has decelerated.
>>> The latest Featured Stock Update with an annotated graph appeared on 9/28/2009. click here.
|
|
C
A
S
I |
News |
Chart |
SEC
View all notes Alert
me of new notes
Company
Profile
|
|
|
|
THESE ARE NOT BUY RECOMMENDATIONS!
Comments contained in the body of this report are technical
opinions only. The material herein has been obtained
from sources believed to be reliable and accurate, however,
its accuracy and completeness cannot be guaranteed.
This site is not an investment advisor, hence it does
not endorse or recommend any securities or other investments.
Any recommendation contained in this report may not
be suitable for all investors and it is not to be deemed
an offer or solicitation on our part with respect to
the purchase or sale of any securities. All trademarks,
service marks and trade names appearing in this report
are the property of their respective owners, and are
likewise used for identification purposes only.
This report is a service available
only to active Paid Premium Members.
You may opt-out of receiving report notifications
at any time. Questions or comments may be submitted
by writing to Premium Membership Services 665 S.E. 10 Street, Suite 201 Deerfield Beach, FL 33441-5634 or by calling 1-800-965-8307
or 954-785-1121.
|
|
|


