You are not logged in.
This means you
CAN ONLY VIEW reports that were published prior to Monday, April 14, 2025.
You
MUST UPGRADE YOUR MEMBERSHIP if you want to see any current reports.
AFTER MARKET UPDATE - FRIDAY, SEPTEMBER 30TH, 2011
Previous After Market Report Next After Market Report >>>
|
|
|
|
DOW |
-240.60 |
10,913.38 |
-2.16% |
|
Volume |
1,323,204,660 |
+18% |
|
Volume |
1,984,427,990 |
-11% |
|
NASDAQ |
-65.36 |
2,415.40 |
-2.63% |
|
Advancers |
615 |
20% |
|
Advancers |
582 |
22% |
|
S&P 500 |
-28.98 |
1,131.42 |
-2.50% |
|
Decliners |
2,457 |
79% |
|
Decliners |
1,997 |
75% |
|
Russell 2000 |
-18.64 |
644.16 |
-2.81% |
|
52 Wk Highs |
29 |
|
|
52 Wk Highs |
3 |
|
|
S&P 600 |
-10.07 |
355.39 |
-2.76% |
|
52 Wk Lows |
275 |
|
|
52 Wk Lows |
247 |
|
|
 |
S&P 500 Index Fell -14.3% in Third Quarter
Kenneth J. Gruneisen - Passed the CAN SLIM® Master's Exam
For the week, the Dow Jones Industrial Average was up +1.3%, the S&P 500 Index fell -0.4%, and the Nasdaq Composite Index dropped -2.7%. Higher volume was reported on the NYSE on Friday while the Nasdaq exchange saw lighter volume. Breadth was negative as declining issues beat advancers by 4-1 on the NYSE and by more than 3-1 on the Nasdaq exchange. The new 52-week lows totals increased and easily outnumbered new 52-week highs on both the Nasdaq exchange and the NYSE, and the new highs total on the Nasdaq exchange remained in the single digits. There were only 2 high-ranked companies from the CANSLIM.net Leaders List that made new 52-week highs and appeared on the CANSLIM.net BreakOuts Page, down from 3 on the prior session. There were losses for all 13 high-ranked companies currently included on the Featured Stocks Page.
The recent themes prevailed as a difficult quarter ended on Wall Street with another sharp loss. Data from overseas reinforced the perception that the global economy is slowing, and overshadowed U.S. economic reports on business activity and consumer sentiment that were better than expected. A report out of China got the most attention. A gauge of Chinese manufacturing dropped for the third straight month.
Basic materials, industrials and financials brought up the rear. Ingersoll Rand Plc (IR -12.11%) after lowering its earnings outlook. Micron Technology Inc (MU -14.14%) sank after posting an unexpected net loss in the latest quarter. Eastman Kodak Co (EK -53.84%) plunged to 78 cents following a report the company is weighing a bankruptcy filing. The 10-year Treasury note rallied 26/32 to yield 1.91%.
The market environment (M criteria) is clearly under pressure and back in a correction after the heavy wave of distributional action last week. The latest confirmed rally may, at best, be considered barely alive by the fact that the Nasdaq Composite Index and S&P 500 Index are still fighting to stay above their respective Day 1 (8/09/11) lows.
View the Q3 2011 Webcast (aired on September 28th) now available "ON DEMAND" - (CLICK HERE) for an informative review of current market conditions, leading groups, and best buy candidates. All upgraded members are eligible to access the webcast presentation at no additional cost! Via the Premium Member Homepage links to all prior reports and webcasts are always available.
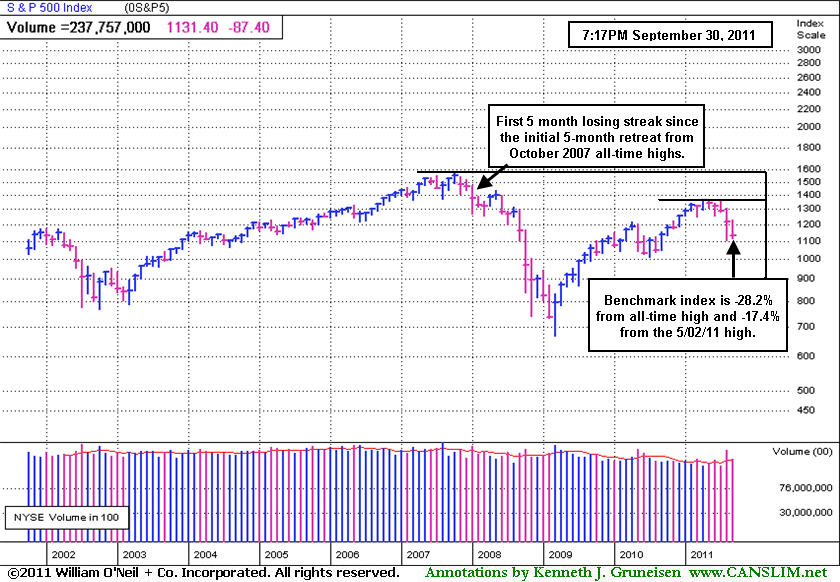
PICTURED: The S&P 500 Index dropped for the fifth straight month, the longest losing streak since 2008, and finished the quarter down -14.3%. The benchmark index is -28.2% off its October 2007 all-time high and -17.4% off its high from May 2, 2011.
|
 Kenneth J. Gruneisen started out as a licensed stockbroker in August 1987, a couple of months prior to the historic stock market crash that took the Dow Jones Industrial Average down -22.6% in a single day. He has published daily fact-based fundamental and technical analysis on high-ranked stocks online for two decades. Through FACTBASEDINVESTING.COM, Kenneth provides educational articles, news, market commentary, and other information regarding proven investment systems that work in good times and bad.
Comments contained in the body of this report are technical opinions only and are not necessarily those of Gruneisen Growth Corp. The material herein has been obtained from sources believed to be reliable and accurate, however, its accuracy and completeness cannot be guaranteed. Our firm, employees, and customers may effect transactions, including transactions contrary to any recommendation herein, or have positions in the securities mentioned herein or options with respect thereto. Any recommendation contained in this report may not be suitable for all investors and it is not to be deemed an offer or solicitation on our part with respect to the purchase or sale of any securities. |
|
 |
Financial Groups' Weakness Still Poisoning Broader Market
Kenneth J. Gruneisen - Passed the CAN SLIM® Master's Exam
Financial shares' weakness continued to poison the market as the Broker/Dealer Index ($XBD -4.78%) and Bank Index ($BKX -3.81%) had a heavy negative influence on Friday. The tech sector was led lower by big losses from the Networking Index ($NWX -3.74%), Semiconductor Index ($SOX -3.42%), Internet Index ($IIX -3.09%), and Biotechnology Index ($BTK -1.99%). Energy-related shares faced pressure as the Oil Services Index ($OSX -4.00%) and Integrated Oil Index ($XOI -3.26%) both sank. The Retail Index ($RLX -2.64%) and Healthcare Index ($HMO -1.89%) also created a drag on the major averages, meanwhile the Gold & Silver Index ($XAU +0.30%) was a standout performer with its modest closing gain.
Charts courtesy www.stockcharts.com
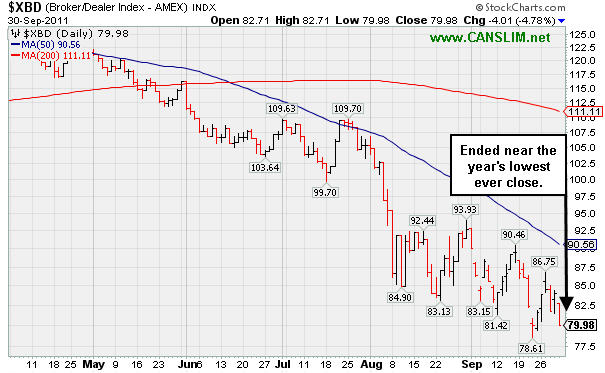
PICTURED: The Broker/Dealer Index ($XBD -4.78%) ended near the year's lowest close. Persistent weakness in the financial group has been a "leading indicator" which has again followed historic precedent while leading the broader market lower in recent months.
| Oil Services |
$OSX |
190.23 |
-7.93 |
-4.00% |
-22.39% |
| Healthcare |
$HMO |
1,872.96 |
-36.08 |
-1.89% |
+10.70% |
| Integrated Oil |
$XOI |
1,031.82 |
-34.81 |
-3.26% |
-14.95% |
| Semiconductor |
$SOX |
338.82 |
-12.00 |
-3.42% |
-17.73% |
| Networking |
$NWX |
213.44 |
-8.29 |
-3.74% |
-23.92% |
| Internet |
$IIX |
261.36 |
-8.33 |
-3.09% |
-15.07% |
| Broker/Dealer |
$XBD |
79.98 |
-4.02 |
-4.78% |
-34.18% |
| Retail |
$RLX |
492.91 |
-13.39 |
-2.64% |
-3.04% |
| Gold & Silver |
$XAU |
185.00 |
+0.56 |
+0.30% |
-18.35% |
| Bank |
$BKX |
35.34 |
-1.40 |
-3.81% |
-32.31% |
| Biotech |
$BTK |
1,102.56 |
-22.41 |
-1.99% |
-15.03% |
|
|
|
 |
Slump Under Old Highs Near Prior Pivot Point Cited
Kenneth J. Gruneisen - Passed the CAN SLIM® Master's Exam
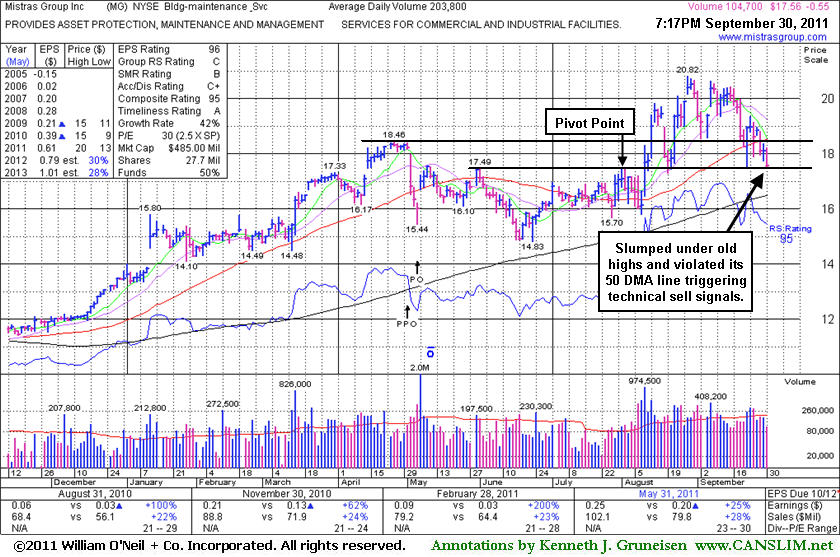
Mistras Group Inc (MG -$0.55 or -3.04% to $17.56) has slumped under its old highs and violated its 50-day moving average line triggering technical sell signals. It finished near the pivot point cited in the mid-day report on 8/10/11 when it was then charging toward its April highs. After rallying above them to new highs its prior resistance acted as a support level while consolidating. Any subsequent losses could lead to more worrisome technical damage, meanwhile a rebound above its 50 DMA is needed for its outlook to improve. Its last appearance in this FSU section was on 9/09/11 with an annotated daily graph under the headline, "Hovering Near Highs Well Above Support".
Since its last FSU analysis was published the Building - Maintenance Services group has seen its Group Relative Strength Rating slump to (42), which is mediocre, whereas the L criteria calls for leadership in the industry group. The chart below shows the stock slumping under its 50 DMA line and under old (April) highs, trading near its previously cited pivot point. It has maintained its solid earnings history concerning the C and A criteria. The number of top-rated funds owning its shares rose from 99 in Sep '10 to 153 in Jun '11, a very reassuring sign concerning the I criteria. After its 5/05/11 Public Offering the company management's still large 47% ownership interest keeps them very motivated to look after and build shareholder value. The small supply (S criteria) of only 27.7 million shares outstanding and 14.7 million in the public float can contribute to greater price volatility in the event of institutional buying or selling. Disciplined investors always limit losses at 7-8% if ever a stock falls that much after purchased. If the market environment (M criteria) is not favorable, 3 out of 4 stocks typically follow the direction of the major averages. Disciplined investors do not fight the tape!
|
|
|
Color Codes Explained :
Y - Better candidates highlighted by our
staff of experts.
G - Previously featured
in past reports as yellow but may no longer be buyable under the
guidelines.
***Last / Change / Volume data in this table is the closing quote data***
Symbol/Exchange
Company Name
Industry Group |
PRICE |
CHANGE
(%Change) |
Day High |
Volume
(% DAV)
(% 50 day avg vol) |
52 Wk Hi
% From Hi |
Featured
Date |
Price
Featured |
Pivot Featured |
|
Max Buy |
AAPL
-
NASDAQ
Apple Inc
COMPUTER HARDWARE - Personal Computers
|
$381.32
|
-9.25
-2.37% |
$388.89
|
19,557,847
86.74% of 50 DAV
50 DAV is 22,547,900
|
$422.86
-9.82%
|
9/16/2011
|
$399.14
|
PP = $404.60
|
|
MB = $424.83
|
 Most Recent Note - 9/30/2011 6:53:56 PM
G - Loss today with lighter than average volume violated its 50 DMA line raising concerns. Color code is changed to green, meanwhile a prompt rebound above that important chart support level is needed for its outlook to improve.
>>> The latest Featured Stock Update with an annotated graph appeared on 9/19/2011. Click here.
View all notes |
Alert me of new notes |
CANSLIM.net Company Profile |
SEC |
Zacks Reports |
StockTalk |
News |
Chart |
Request a new note
C
A N
S L
I M


|
ALXN
-
NASDAQ
Alexion Pharmaceuticals
DRUGS - Drug Manufacturers - Other
|
$64.06
|
-0.17
-0.26% |
$65.12
|
1,722,057
103.53% of 50 DAV
50 DAV is 1,663,400
|
$68.50
-6.48%
|
9/15/2011
|
$63.20
|
PP = $60.81
|
|
MB = $63.85
|
Most Recent Note - 9/30/2011 6:55:42 PM
G - Held its ground today. It is extended from its prior base after a spurt of gains with above average volume. Prior resistance in the $59-60 area defines initial support to watch on pullbacks.
>>> The latest Featured Stock Update with an annotated graph appeared on 9/15/2011. Click here.
View all notes |
Alert me of new notes |
CANSLIM.net Company Profile |
SEC |
Zacks Reports |
StockTalk |
News |
Chart |
Request a new note
C
A N
S L
I M
|
ATHN
-
NASDAQ
Athenahealth Inc
DIVERSIFIED SERVICES - Business/Management Services
|
$59.55
|
-3.54
-5.61% |
$62.59
|
857,389
100.50% of 50 DAV
50 DAV is 853,100
|
$72.70
-18.09%
|
9/8/2011
|
$61.93
|
PP = $61.78
|
|
MB = $64.87
|
Most Recent Note - 9/30/2011 6:58:15 PM
G - Gapped down today and finished below a significant prior high close ($60.00 on 8/03/11) which technically negated its recent breakout, raising concerns. Its 50 DMA line is the next nearest support level. See the latest FSU analysis for more details and a new annotated graph.
>>> The latest Featured Stock Update with an annotated graph appeared on 9/29/2011. Click here.
View all notes |
Alert me of new notes |
CANSLIM.net Company Profile |
SEC |
Zacks Reports |
StockTalk |
News |
Chart |
Request a new note
C
A N
S L
I M
|
CELG
-
NASDAQ
Celgene Corp
DRUGS - Drug Manufacturers - Major
|
$61.91
|
-1.02
-1.62% |
$63.00
|
3,831,118
88.78% of 50 DAV
50 DAV is 4,315,200
|
$65.86
-5.99%
|
9/16/2011
|
$61.21
|
PP = $62.59
|
|
MB = $65.72
|
Most Recent Note - 9/30/2011 6:59:44 PM
Y - Down today with a loss on below average volume, slumping further below its pivot point. Following its breakout on 9/20/11 it abruptly pulled back near previously stubborn resistance in the $62 area which has acted as a support level.
>>> The latest Featured Stock Update with an annotated graph appeared on 9/16/2011. Click here.
View all notes |
Alert me of new notes |
CANSLIM.net Company Profile |
SEC |
Zacks Reports |
StockTalk |
News |
Chart |
Request a new note
C
A N
S L
I M
|
CPA
-
NYSE
Copa Holdings Sa
TRANSPORTATION - Regional Airlines
|
$61.27
|
-2.76
-4.31% |
$64.04
|
504,816
160.06% of 50 DAV
50 DAV is 315,400
|
$72.86
-15.91%
|
9/21/2011
|
$69.67
|
PP = $72.86
|
|
MB = $76.50
|
Most Recent Note - 9/30/2011 7:02:42 PM
Down today with above average volume testing its 200 DMA line previously noted as the next important support area to watch. Based on weak action it will be dropped from the Featured Stocks list tonight. Only a prompt rebound above its 50 DMA line would help its outlook improve.
>>> The latest Featured Stock Update with an annotated graph appeared on 9/26/2011. Click here.
View all notes |
Alert me of new notes |
CANSLIM.net Company Profile |
SEC |
Zacks Reports |
StockTalk |
News |
Chart |
Request a new note
C
A N
S L
I M
|
Symbol/Exchange
Company Name
Industry Group |
PRICE |
CHANGE
(%Change) |
Day High |
Volume
(% DAV)
(% 50 day avg vol) |
52 Wk Hi
% From Hi |
Featured
Date |
Price
Featured |
Pivot Featured |
|
Max Buy |
DMND
-
NASDAQ
Diamond Foods Inc
FOOD and; BEVERAGE - Processed and; Packaged Goods
|
$79.80
|
-2.09
-2.55% |
$82.65
|
587,000
146.90% of 50 DAV
50 DAV is 399,600
|
$96.13
-16.99%
|
9/13/2011
|
$75.57
|
PP = $80.16
|
|
MB = $84.17
|
Most Recent Note - 9/30/2011 7:05:27 PM
G - Spurt of damaging losses with above average volume pressured it to a close below its pivot point today while testing prior highs in the $80 area previously noted as initial chart support to watch on pullbacks.
>>> The latest Featured Stock Update with an annotated graph appeared on 9/13/2011. Click here.
View all notes |
Alert me of new notes |
CANSLIM.net Company Profile |
SEC |
Zacks Reports |
StockTalk |
News |
Chart |
Request a new note
C
A N
S L
I M
|
EXLS
-
NASDAQ
Exlservice Holdings Inc
DIVERSIFIED SERVICES - Business/Management Services
|
$22.00
|
-0.11
-0.50% |
$22.25
|
139,571
65.80% of 50 DAV
50 DAV is 212,100
|
$26.55
-17.14%
|
8/2/2011
|
$24.85
|
PP = $24.85
|
|
MB = $26.09
|
Most Recent Note - 9/30/2011 7:08:27 PM
It may find support near its 200 DMA line where it has been hovering, but it has failed to rebound after damaging losses. Based on weak action it will be dropped from the Featured Stocks list tonight. A rebound above its 50 DMA line is needed for its outlook to improve.
>>> The latest Featured Stock Update with an annotated graph appeared on 9/28/2011. Click here.
View all notes |
Alert me of new notes |
CANSLIM.net Company Profile |
SEC |
Zacks Reports |
StockTalk |
News |
Chart |
Request a new note
C
A N
S L
I M
|
JAZZ
-
NASDAQ
Jazz Pharmaceuticals Inc
DRUGS - Biotechnology
|
$41.50
|
-0.18
-0.43% |
$43.47
|
622,252
64.40% of 50 DAV
50 DAV is 966,200
|
$47.88
-13.33%
|
9/20/2011
|
$46.56
|
PP = $44.63
|
|
MB = $46.86
|
Most Recent Note - 9/30/2011 7:10:32 PM
Y - Quiet loss today inching further below its pivot point raising concerns. It is testing near its 50 DMA line that defines important chart support to watch.
>>> The latest Featured Stock Update with an annotated graph appeared on 9/20/2011. Click here.
View all notes |
Alert me of new notes |
CANSLIM.net Company Profile |
SEC |
Zacks Reports |
StockTalk |
News |
Chart |
Request a new note
C
A N
S L
I M
|
MA
-
NYSE
Mastercard Inc Cl A
DIVERSIFIED SERVICES - Business/Management Services
|
$317.16
|
-11.21
-3.41% |
$324.23
|
1,719,498
106.40% of 50 DAV
50 DAV is 1,616,000
|
$361.94
-12.37%
|
8/3/2011
|
$324.82
|
PP = $322.38
|
|
MB = $338.50
|
Most Recent Note - 9/30/2011 7:12:05 PM
G - Slumped below important support at its 50 DMA line today, raising more serious concerns and triggering a technical sell signal.
>>> The latest Featured Stock Update with an annotated graph appeared on 9/12/2011. Click here.
View all notes |
Alert me of new notes |
CANSLIM.net Company Profile |
SEC |
Zacks Reports |
StockTalk |
News |
Chart |
Request a new note
C
A N
S L
I M
|
MG
-
NYSE
Mistras Group Inc
DIVERSIFIED SERVICES - Bulding and Faci;ity Management Services
|
$17.56
|
-0.55
-3.04% |
$18.23
|
106,323
52.17% of 50 DAV
50 DAV is 203,800
|
$20.82
-15.66%
|
8/10/2011
|
$17.89
|
PP = $17.58
|
|
MB = $18.46
|
Most Recent Note - 9/30/2011 8:08:54 PM
G - Slumping below old highs and its 50 DMA line, raising concerns while testing near its pivot point. See the latest FSU analysis for more details and an new annotated daily graph.
>>> The latest Featured Stock Update with an annotated graph appeared on 9/30/2011. Click here.
View all notes |
Alert me of new notes |
CANSLIM.net Company Profile |
SEC |
Zacks Reports |
StockTalk |
News |
Chart |
Request a new note
C
A N
S L
I M
|
Symbol/Exchange
Company Name
Industry Group |
PRICE |
CHANGE
(%Change) |
Day High |
Volume
(% DAV)
(% 50 day avg vol) |
52 Wk Hi
% From Hi |
Featured
Date |
Price
Featured |
Pivot Featured |
|
Max Buy |
MKTX
-
NASDAQ
Marketaxess Holdings Inc
FINANCIAL SERVICES - Investment Brokerage - Nationa
|
$26.02
|
-0.53
-2.00% |
$26.50
|
252,866
84.68% of 50 DAV
50 DAV is 298,600
|
$30.95
-15.93%
|
7/29/2011
|
$25.87
|
PP = $26.35
|
|
MB = $27.67
|
Most Recent Note - 9/30/2011 7:45:08 PM
G - Slumped further below its 50 DMA line today while testing a recent support area near prior highs in the $26 area. A prompt rebound above its short-term average is needed to help its outlook improve.
>>> The latest Featured Stock Update with an annotated graph appeared on 9/27/2011. Click here.
View all notes |
Alert me of new notes |
CANSLIM.net Company Profile |
SEC |
Zacks Reports |
StockTalk |
News |
Chart |
Request a new note
C
A N
S L
I M
|
PSMT
-
NASDAQ
Pricesmart Inc
RETAIL - Drug Stores
|
$62.32
|
-1.61
-2.52% |
$65.46
|
233,696
73.19% of 50 DAV
50 DAV is 319,300
|
$75.16
-17.08%
|
8/30/2011
|
$63.01
|
PP = $62.37
|
|
MB = $65.49
|
Most Recent Note - 9/30/2011 7:47:08 PM
G - Testing support near its prior highs and its 50 DMA line noted as important chart support levels to watch. More damaging losses would raise greater concerns and trigger technical sell signals.
>>> The latest Featured Stock Update with an annotated graph appeared on 9/14/2011. Click here.
View all notes |
Alert me of new notes |
CANSLIM.net Company Profile |
SEC |
Zacks Reports |
StockTalk |
News |
Chart |
Request a new note
C
A N
S L
I M
|
V
-
NYSE
Visa Inc Cl A
DIVERSIFIED SERVICES - Business/Management Services
|
$85.72
|
-1.97
-2.25% |
$87.62
|
4,488,089
73.45% of 50 DAV
50 DAV is 6,110,700
|
$94.75
-9.53%
|
9/20/2011
|
$93.91
|
PP = $90.93
|
|
MB = $95.48
|
Most Recent Note - 9/30/2011 7:48:38 PM
G - Loss today on lighter than average volume violated its 50 DMA line raising concerns. Color code is changed to green, meanwhile a prompt rebound above its short-term average is needed for its outlook to improve. It recently stalled after rallying to a new all-time high.
>>> The latest Featured Stock Update with an annotated graph appeared on 9/21/2011. Click here.
View all notes |
Alert me of new notes |
CANSLIM.net Company Profile |
SEC |
Zacks Reports |
StockTalk |
News |
Chart |
Request a new note
C
A N
S L
I M
|
|
|
|
THESE ARE NOT BUY RECOMMENDATIONS!
Comments contained in the body of this report are technical
opinions only. The material herein has been obtained
from sources believed to be reliable and accurate, however,
its accuracy and completeness cannot be guaranteed.
This site is not an investment advisor, hence it does
not endorse or recommend any securities or other investments.
Any recommendation contained in this report may not
be suitable for all investors and it is not to be deemed
an offer or solicitation on our part with respect to
the purchase or sale of any securities. All trademarks,
service marks and trade names appearing in this report
are the property of their respective owners, and are
likewise used for identification purposes only.
This report is a service available
only to active Paid Premium Members.
You may opt-out of receiving report notifications
at any time. Questions or comments may be submitted
by writing to Premium Membership Services 665 S.E. 10 Street, Suite 201 Deerfield Beach, FL 33441-5634 or by calling 1-800-965-8307
or 954-785-1121.
|
|
|

