You are not logged in.
This means you
CAN ONLY VIEW reports that were published prior to Monday, April 21, 2025.
You
MUST UPGRADE YOUR MEMBERSHIP if you want to see any current reports.
AFTER MARKET UPDATE - TUESDAY, SEPTEMBER 29TH, 2009
Previous After Market Report Next After Market Report >>>
|
|
|
|
DOW |
-47.16 |
9,742.20 |
-0.48% |
|
Volume |
1,182,401,510 |
+21% |
|
Volume |
2,156,010,040 |
+10% |
|
NASDAQ |
-6.70 |
2,124.04 |
-0.31% |
|
Advancers |
1,439 |
46% |
|
Advancers |
1,134 |
40% |
|
S&P 500 |
-2.37 |
1,060.61 |
-0.22% |
|
Decliners |
1,554 |
50% |
|
Decliners |
1,594 |
56% |
|
Russell 2000 |
-2.77 |
610.45 |
-0.45% |
|
52 Wk Highs |
184 |
|
|
52 Wk Highs |
91 |
|
|
S&P 600 |
-1.16 |
320.99 |
-0.36% |
|
52 Wk Lows |
2 |
|
|
52 Wk Lows |
6 |
|
|
 |
Distributional Action Returns to Market
Adam Sarhan, Contributing Writer,
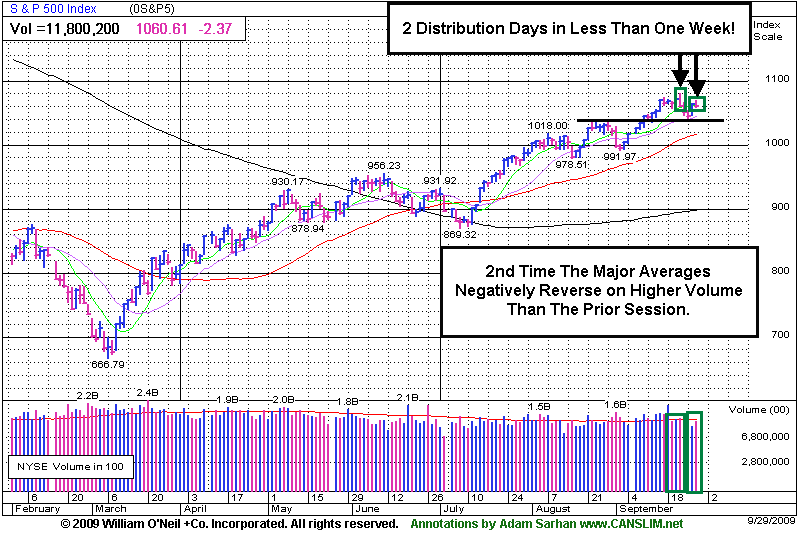
The major averages traded between positive and negative territory only to end lower one day before the third quarter comes to an end. As expected, volume was higher on Tuesday from Monday's light holiday levels. That constituted a distribution day for the major averages. Decliners led advancers by a narrow margin on the NYSE and by nearly a 3-to-2 ratio on the Nasdaq exchange. There were 23 high-ranked companies from the CANSLIM.net Leaders List that made a new 52-week high and appeared on the CANSLIM.net BreakOuts Page, higher from the 20 issues that appeared on the prior session. New 52-week highs outnumbered new 52-week lows on both exchanges, while new 52-week lows were in the single digits yet again.
Stocks opened higher after Walgreen Co. (WAG +9.24%) reported their latest quarterly results. The stock gapped higher and hit a fresh 17-month high as rising sales of prescription drugs boosted results. However, the bears quickly showed up and sent the popular averages back into the red. Leading stocks fared well today which was a net positive for this rally. A few high ranked growth stocks were featured in yellow in today's CANSLIM.net's Mid Day Breakouts Report (click here) as they triggered fresh technical buy signals- which is always a welcomed sign.
Turning to the economic front, the S&P/Case-Shiller home-price index rose +1.2% in July from the prior month which was the latest round of healthy housing data. The S&P/Case- Shiller index measures home prices in 20 major metropolitan areas and today's rise was the largest monthly increase in nearly four years. So far, the benchmark S&P 500 index has rallied nearly +60% from its 12-year low in March. This pushed valuations in the index to about 20 times the reported profits from continuing operations, according to the latest data provided by Bloomberg.com. This is the highest p/e level for S&P 500 companies since 2004. Remember that paying attention to p/e ratios is a secondary component because studies show that the greatest stock market winners have sported both high and low p/e's.
PICTURED: The S&P 500 Index negatively reversed on higher volume than the prior session. This is the second distribution day in less than one week.
|
|
|
 |
Gold & Silver Index A Standout Gainer
Kenneth J. Gruneisen - Passed the CAN SLIM® Master's Exam
The Gold & Silver Index ($XAU +2.60%) was a standout gainer while most groups backpedaled on Tuesday. The Healthcare Index ($HMO -1.21%) suffered a loss, suggesting that other defensive areas offered no safe haven. Semiconductor Index ($SOX -1.43%), Networking Index ($NWX -0.84%), Internet Index ($IIX -0.29%) The Bank Index ($BKX -0.36%) and Retail Index ($RLX -0.18%) suffered mild losses while the Broker/Dealer Index ($XBD +0.10%) eked out a small gain. Energy shares were mixed as the Oil Services Index ($OSX +0.59%) edged higher and the Integrated Oil Index ($XOI -0.91%) fell.
Charts courtesy www.stockcharts.com
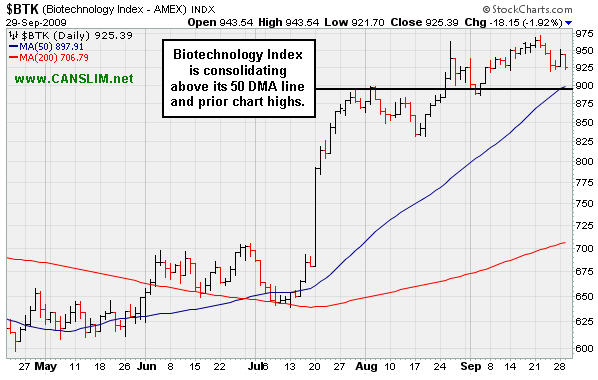
PICTURED: The Biotechnology Index ($BTK -1.92%) was among today's tech sector laggards, consolidating toward its 50-day moving average line.
| Oil Services |
$OSX |
193.73 |
+1.13 |
+0.59% |
+59.59% |
| Healthcare |
$HMO |
1,179.73 |
-14.44 |
-1.21% |
+22.87% |
| Integrated Oil |
$XOI |
1,028.45 |
-9.48 |
-0.91% |
+4.98% |
| Semiconductor |
$SOX |
323.00 |
-4.67 |
-1.43% |
+52.24% |
| Networking |
$NWX |
236.31 |
-2.01 |
-0.84% |
+64.23% |
| Internet |
$IIX |
218.32 |
-0.63 |
-0.29% |
+63.21% |
| Broker/Dealer |
$XBD |
119.13 |
+0.12 |
+0.10% |
+53.78% |
| Retail |
$RLX |
378.12 |
-0.67 |
-0.18% |
+35.40% |
| Gold & Silver |
$XAU |
163.26 |
+4.13 |
+2.60% |
+31.82% |
| Bank |
$BKX |
47.26 |
-0.17 |
-0.36% |
+6.63% |
| Biotech |
$BTK |
925.39 |
-18.15 |
-1.92% |
+42.99% |
|
|
|
 |
Breakout With Twice Average Volume For Strong Financial Firm
Kenneth J. Gruneisen - Passed the CAN SLIM® Master's Exam
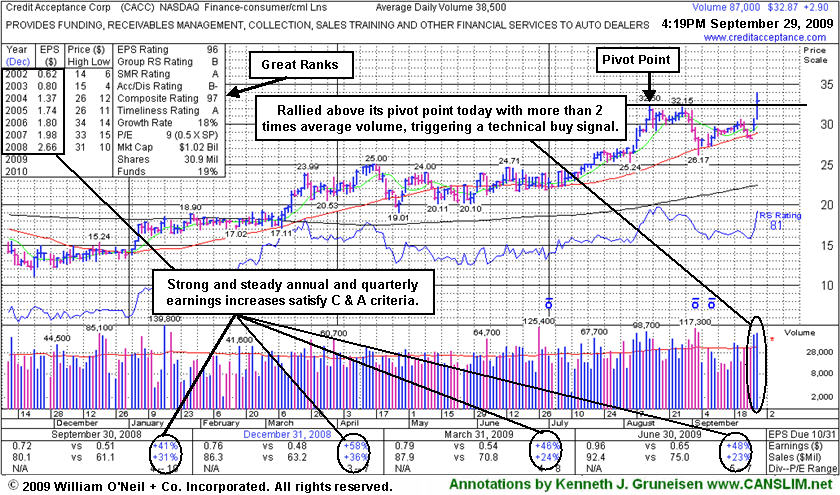
Credit Acceptance Corp (CACC +$2.90 or +9.68% to $32.87) gapped up for a second consecutive session and hit a new 52-week high as it rallied above its pivot point today, closing in the upper half of its trading range. The considerable gain backed by more than 2 times average volume triggered a technical buy signal. There is not any overhead supply to hinder its upward price progress now. It is near multi-year chart highs, and its ability to clear its 2006-2007 highs ($33-34) and reach new all-time highs would be a very reassuring sign to be watching for in the days ahead. The high-ranked Finance-Consumer/Commercial Loans firm was featured earlier today in yellow in the mid-day report (read here). Disciplined investors would avoid chasing the stock more than +5% above its pivot point. Any reversal leading to a close below its prior high closes would raise concerns, and as always, a sound loss-limiting strategy requires investors to sell any stock if it ever falls more than -7% from the price paid.
|
|
|
Color Codes Explained :
Y - Better candidates highlighted by our
staff of experts.
G - Previously featured
in past reports as yellow but may no longer be buyable under the
guidelines.
***Last / Change / Volume quote data in this table corresponds with the timestamp on the note***
Symbol/Exchange
Company Name
Industry Group |
Last |
Chg. |
Vol
% DAV |
Date Featured |
Price Featured |
Latest Pivot Point
Featured |
Status |
| Latest Max Buy Price |
ARO
- NYSE
Aeropostale Inc
RETAIL - Apparel Stores
|
$43.57
|
+0.14
|
1,407,371
52% DAV
2,732,100
|
8/21/2009
(Date
Featured) |
$39.21
(Price
Featured) |
PP = $38.84 |
G |
| MB = $40.78 |
Most Recent Note - 9/29/2009 4:59:19 PM
G - This high-ranked leader in the Retail - Clothing/shoe group is quietly consolidating, extended from a sound base, thus not buyable under the investment system guidelines now. Support to watch is at prior highs in the $38 area. It was featured in yellow in the 8/21/09 Mid-Day BreakOuts Report (read here).
>>> The latest Featured Stock Update with an annotated graph appeared on 9/18/2009. click here.
|
|
C
A
S
I |
News |
Chart |
SEC
View all notes Alert
me of new notes
Company
Profile
|
ARST
-
|
$23.95
|
+0.60
|
496,098
68% DAV
726,800
|
9/1/2009
(Date
Featured) |
$19.91
(Price
Featured) |
PP = $20.90 |
G |
| MB = $21.95 |
Most Recent Note - 9/29/2009 5:00:08 PM
G - Gain today on light volume for another new all-time high, getting further extended from its latest sound base. Prior chart highs in the $20 area are important support to watch on pullbacks.
>>> The latest Featured Stock Update with an annotated graph appeared on 9/17/2009. click here.
|
|
C
A
S
I |
News |
Chart |
SEC
View all notes Alert
me of new notes
Company
Profile
|
BIDU
- NASDAQ
Baidu Inc Ads
INTERNET - Internet Information Providers
|
$394.42
|
-1.63
|
1,149,077
65% DAV
1,777,500
|
9/8/2009
(Date
Featured) |
$351.80
(Price
Featured) |
PP = $368.59 |
G |
| MB = $387.02 |
Most Recent Note - 9/29/2009 5:04:06 PM
G - Quietly consolidating in a tight trading range (percentage-wise) for the past couple of weeks just above its "max buy" level. BIDU was featured in yellow in the 9/08/09 Mid-Day BreakOuts Report (read here).
>>> The latest Featured Stock Update with an annotated graph appeared on 9/21/2009. click here.
|
|
C
A
S
I |
News |
Chart |
SEC
View all notes Alert
me of new notes
Company
Profile
|
CACC
- NASDAQ
Credit Acceptance Corp
FINANCIAL SERVICES - Credit Services
|
$32.87
|
+2.90
|
87,212
227% DAV
38,500
|
9/29/2009
(Date
Featured) |
$33.48
(Price
Featured) |
PP = $32.60 |
Y |
| MB = $34.23 |
Most Recent Note - 9/29/2009 5:09:30 PM
Y - Gapped up for a second day in a row, triggering a technical buy signal as it spiked to a new 52-week high today with more than 2 times average volume. It rose from a 6-week base after consolidating and finding support near its 50 DMA line. The Finance - Consumer/Commercial Loans firm has maintained a great track record of annual and quarterly sales revenues and earnings increases. It was featured earlier today in yellow in the mid-day report (read here).
>>> The latest Featured Stock Update with an annotated graph appeared on 9/29/2009. click here.
|
|
C
A
S
I |
News |
Chart |
SEC
View all notes Alert
me of new notes
Company
Profile
|
CRM
- NYSE
Salesforce.com Inc
INTERNET - Internet Software & Services
|
$57.16
|
-0.31
|
1,165,572
57% DAV
2,058,900
|
8/16/2009
(Date
Featured) |
$47.12
(Price
Featured) |
PP = $45.59 |
G |
| MB = $47.87 |
Most Recent Note - 9/29/2009 5:10:56 PM
G - Quietly consolidating above prior highs in the $55 area, an intial support level well above additional support at its upward trendline and 50 DMA line. It is extended from a sound base now, thus not buyable under the guidelines.
>>> The latest Featured Stock Update with an annotated graph appeared on 9/15/2009. click here.
|
|
C
A
S
I |
News |
Chart |
SEC
View all notes Alert
me of new notes
Company
Profile
|
EBIX
- NASDAQ
Ebix Inc
COMPUTER SOFTWARE & SERVICES - Business Software & Services
|
$54.01
|
+3.63
|
357,702
248% DAV
144,200
|
8/28/2009
(Date
Featured) |
$45.86
(Price
Featured) |
PP = $45.35 |
G |
| MB = $47.62 |
Most Recent Note - 9/29/2009 5:13:07 PM
G - Gapped up again today and closed 4 cents under its best ever close while posting its second consecutive big gain on heavy volume. Distributional pressure recently led to a pullback near support at early-August chart highs and its 50 DMA line in the $45 area. Recent whipsaw action briefly tested support, like its shakeout in mid-August. EBIX rallied as much as +19.76% since featured in yellow in the 8/28/09 Mid-Day BreakOuts Report (read here).
>>> The latest Featured Stock Update with an annotated graph appeared on 9/24/2009. click here.
|
|
C
A
S
I |
News |
Chart |
SEC
View all notes Alert
me of new notes
Company
Profile
|
GMCR
- NASDAQ
Green Mtn Coffee Roastrs
FOOD & BEVERAGE - Processed & Packaged Goods
|
$72.89
|
-0.41
|
1,894,555
123% DAV
1,544,300
|
7/17/2009
(Date
Featured) |
$60.15
(Price
Featured) |
PP = $63.79 |
G |
| MB = $66.98 |
Most Recent Note - 9/29/2009 5:14:32 PM
G - Negatively reversed after reaching another new all-time high today. The prior session's gain with volume more than 2 times average helped it clear a cup-with-handle type base (during which it completed an additional share offering on 8/07/09). As previously noted, "Its 3-day pullback of about -9% tested support near its 50 DMA, and although the latest action is bullish, a new pivot point and max buy level were not cited because guidelines call for a cup-with-handle pattern to form over at least 8 weeks, the handle usually lasts at least a week and drifts downward by 10-15% in normal markets. Also, the Relative Strength line should lead or at least closely follow a stock's price into new high ground, but in this case its RS line is still under its July highs."
>>> The latest Featured Stock Update with an annotated graph appeared on 9/23/2009. click here.
|
|
C
A
S
I |
News |
Chart |
SEC
View all notes Alert
me of new notes
Company
Profile
|
NTES
- NASDAQ
Netease Inc Adr
INTERNET - Internet Information Providers
|
$45.38
|
+1.29
|
1,610,979
77% DAV
2,087,200
|
9/23/2009
(Date
Featured) |
$47.11
(Price
Featured) |
PP = $47.04 |
Y |
| MB = $49.39 |
Most Recent Note - 9/29/2009 5:18:19 PM
Y - Gain today on light volume after testing important support is at its 50 DMA line and upward trendline. Deterioration below those levels would raise more serious concerns and trigger technical sell signals. It encountered resistance last week and promptly negated its latest breakout above its pivot point. This may also be considered a riskier late-stage base.
>>> The latest Featured Stock Update with an annotated graph appeared on 9/25/2009. click here.
|
|
C
A
S
I |
News |
Chart |
SEC
View all notes Alert
me of new notes
Company
Profile
|
NVEC
- NASDAQ
N V E Corp
ELECTRONICS - Semiconductor - Specialized
|
$53.44
|
-0.82
|
51,577
54% DAV
94,800
|
8/26/2009
(Date
Featured) |
$55.32
(Price
Featured) |
PP = $57.60 |
G |
| MB = $60.48 |
Most Recent Note - 9/29/2009 5:28:35 PM
G - Loss today on lighter volume, slumping further below its 50 DMA line which could now act as resistance. Despite some encouraging signs of support arriving after recent distributional pressure, at best it needs more time to form a new sound base.
>>> The latest Featured Stock Update with an annotated graph appeared on 9/16/2009. click here.
|
|
C
A
S
I |
News |
Chart |
SEC
View all notes Alert
me of new notes
Company
Profile
|
PEGA
- NASDAQ
Pegasystems Inc
COMPUTER SOFTWARE & SERVICES - Business Software & Services
|
$34.73
|
-0.17
|
251,152
64% DAV
391,000
|
9/9/2009
(Date
Featured) |
$31.14
(Price
Featured) |
PP = $33.35 |
Y |
| MB = $35.02 |
Most Recent Note - 9/29/2009 5:30:57 PM
Y - Perched at all-time highs, since 9/16/09 volume has been below average, or average, behind recent gains and losses for this high-ranked Computer Software - Financial firm. An upward trendline connecting its July-September chart lows may be considered an initial support level above its 50 DMA line.
>>> The latest Featured Stock Update with an annotated graph appeared on 9/22/2009. click here.
|
|
C
A
S
I |
News |
Chart |
SEC
View all notes Alert
me of new notes
Company
Profile
|
WNS
- NYSE
W N S Holdings Ltd Ads
DIVERSIFIED SERVICES - Business/Management Services
|
$16.00
|
+0.80
|
491,032
1,158% DAV
42,400
|
9/28/2009
(Date
Featured) |
$15.28
(Price
Featured) |
PP = $16.10 |
Y |
| MB = $16.91 |
Most Recent Note - 9/29/2009 5:35:03 PM
Y - It again encountered resistance in the $16 area and closed just under its pivot point. It initially gapped down today, then quickly rebounded and rallied above its pivot point for a new 52-week high with volume 11 times its daily average volume. It formed an orderly flat base for at least 5-weeks, and it was featured in yellow in the 9/28/09 mid-day report (read here). Quarterly earnings have been above the +25% guideline and its annual earnings history has been great, satisfying the C & A criteria. However, sales revenues growth has decelerated.
>>> The latest Featured Stock Update with an annotated graph appeared on 9/28/2009. click here.
|
|
C
A
S
I |
News |
Chart |
SEC
View all notes Alert
me of new notes
Company
Profile
|
|
|
|
THESE ARE NOT BUY RECOMMENDATIONS!
Comments contained in the body of this report are technical
opinions only. The material herein has been obtained
from sources believed to be reliable and accurate, however,
its accuracy and completeness cannot be guaranteed.
This site is not an investment advisor, hence it does
not endorse or recommend any securities or other investments.
Any recommendation contained in this report may not
be suitable for all investors and it is not to be deemed
an offer or solicitation on our part with respect to
the purchase or sale of any securities. All trademarks,
service marks and trade names appearing in this report
are the property of their respective owners, and are
likewise used for identification purposes only.
This report is a service available
only to active Paid Premium Members.
You may opt-out of receiving report notifications
at any time. Questions or comments may be submitted
by writing to Premium Membership Services 665 S.E. 10 Street, Suite 201 Deerfield Beach, FL 33441-5634 or by calling 1-800-965-8307
or 954-785-1121.
|
|
|


