You are not logged in.
This means you
CAN ONLY VIEW reports that were published prior to Monday, April 14, 2025.
You
MUST UPGRADE YOUR MEMBERSHIP if you want to see any current reports.
AFTER MARKET UPDATE - FRIDAY, SEPTEMBER 28TH, 2012
Previous After Market Report Next After Market Report >>>
|
|
|
|
DOW |
-48.84 |
13,437.13 |
-0.36% |
|
Volume |
832,346,140 |
+31% |
|
Volume |
1,779,971,380 |
+9% |
|
NASDAQ |
-20.37 |
3,116.23 |
-0.65% |
|
Advancers |
1,175 |
37% |
|
Advancers |
862 |
33% |
|
S&P 500 |
-6.48 |
1,440.67 |
-0.45% |
|
Decliners |
1,850 |
59% |
|
Decliners |
1,610 |
62% |
|
Russell 2000 |
-6.09 |
837.45 |
-0.72% |
|
52 Wk Highs |
125 |
|
|
52 Wk Highs |
70 |
|
|
S&P 600 |
-3.36 |
468.00 |
-0.71% |
|
52 Wk Lows |
9 |
|
|
52 Wk Lows |
19 |
|
|
 |
Major Averages Slumped Yet Finished With Solid Q3 Gains
Kenneth J. Gruneisen - Passed the CAN SLIM® Master's Exam
For the week, the Dow Jones Industrial Average fell -1.1%, the S&P 500 Index gave up -1.3%, and the Nasdaq Composite Index was down -2.0%. Despite this week's decline, the major averages posted gains for the third quarter. For the quarter, the Dow was up +4.3% , the S&P rose +5.8%, and the Nasdaq advanced +6.2%. On Friday the indices closed lower while the volume totals were reported higher on the NYSE and on the Nasdaq exchange versus the prior session totals, indicating a pick up in institutional selling pressure. Decliners led advancers by about a 3-2 ratio on the NYSE and by nearly a 2-1 ratio on the Nasdaq exchange. The total number of new 52-week highs still outnumbered new 52-week lows on the NYSE on the Nasdaq exchange. There were 23 high-ranked companies from the CANSLIM.net Leaders List that made new 52-week highs and appeared on the CANSLIM.net BreakOuts Page, down from the prior session total of 32 stocks. There were gains for 12 of the 22 high-ranked companies currently included on the Featured Stocks Page, a more positive bias than what was seen in the broader market.
The major averages were lower on Friday amid disappointment in the morning's economic reports. Personal income rose 0.1% in August, below expectations for a 0.2% increase. A separate report showed consumer spending increased 0.5%, in line with consensus projections. Another report revealed an unexpected decline in Chicago business activity in September. The market pared its retreat after results of Spain's bank stress test were essentially in line with expectations.
Materials-related firms were among the weaker performers as companies like Peabody Energy Corp (BTU -1.50%) and Freeport McMoRan Copper & Gold Inc (FCX -1.32%) fell. Consumer stocks also traded lower on the session. Walgreen Co (WAG -0.44%) was down after reporting a year-over-year decline in quarterly profits. Nike Inc (NKE -1.14%) was weaker after it warned of slowing future sales in China. Shares of Research in Motion Ltd (RIMM +5.09%) were up after posting a narrower-than-expected quarterly loss. Facebook Inc (FB +6.59%) rose after it unveiled a new gift giving feature for users. The Hartford Financial Services Group Inc (HIG +0.73%) edged higher after it agreed to sell its individual life unit to Prudential Financial Inc (PRU -0.57%) .
The M criteria is still favorable as the major indices have maintained their previously confirmed rally with a healthy level of leadership (stocks hitting new 52-week highs).
Watch for an announcement via email concerning the Q3 2012 WEBCAST. The webcast will also be available via an updated link highlighted at the top of the Premium Member Homepage.
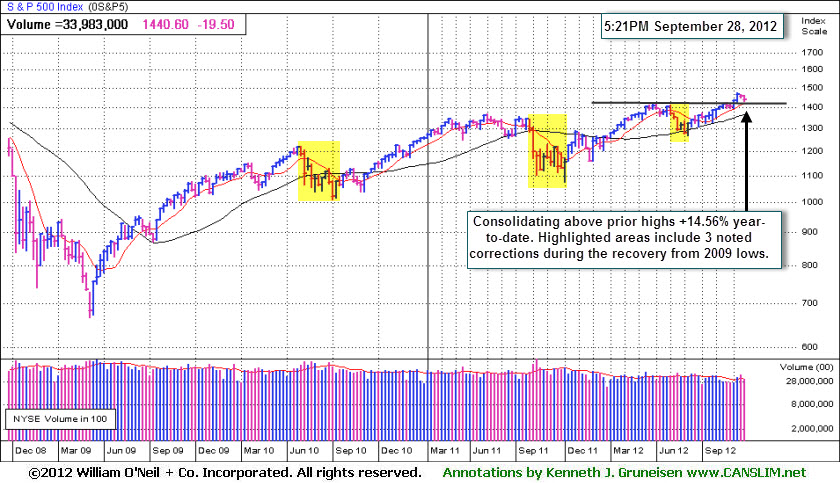
PICTURED: The weekly chart of the benchmark S&P 500 Index illustrates the 3 prior market "corrections" during the ongoing recovery from the March 2009 lows. The tech-heavy index is up +14.56% year-to-date.
|
 Kenneth J. Gruneisen started out as a licensed stockbroker in August 1987, a couple of months prior to the historic stock market crash that took the Dow Jones Industrial Average down -22.6% in a single day. He has published daily fact-based fundamental and technical analysis on high-ranked stocks online for two decades. Through FACTBASEDINVESTING.COM, Kenneth provides educational articles, news, market commentary, and other information regarding proven investment systems that work in good times and bad.
Comments contained in the body of this report are technical opinions only and are not necessarily those of Gruneisen Growth Corp. The material herein has been obtained from sources believed to be reliable and accurate, however, its accuracy and completeness cannot be guaranteed. Our firm, employees, and customers may effect transactions, including transactions contrary to any recommendation herein, or have positions in the securities mentioned herein or options with respect thereto. Any recommendation contained in this report may not be suitable for all investors and it is not to be deemed an offer or solicitation on our part with respect to the purchase or sale of any securities. |
|
 |
Financial, Retail, Tech, and Commodity-Linked Groups Ended Lower
Kenneth J. Gruneisen - Passed the CAN SLIM® Master's Exam
The Broker/Dealer Index ($XBD -0.57%) and Bank Index ($BKX -0.36%) were a negative influence on the major averages, and the Retail Index ($RLX -0.26%) also edged lower. The Networking Index ($NWX -1.54%) and the Semiconductor Index ($SOX -0.83%) led the tech sector lower while the Internet Index ($IIX -0.44%) finished the session with a smaller loss and the Biotechnology Index ($BTK +0.31%) posted a small gain. The Healthcare Index ($HMO +0.06%) ended essentially flat. Commodity-linked grous had a slightly negative bias as the Oil Services Index ($OSX -0.92%), Integrated Oil Index ($XOI -0.69%), and the Gold & Silver Index ($XAU -0.61%) ended modestly lower.
Charts courtesy www.stockcharts.com
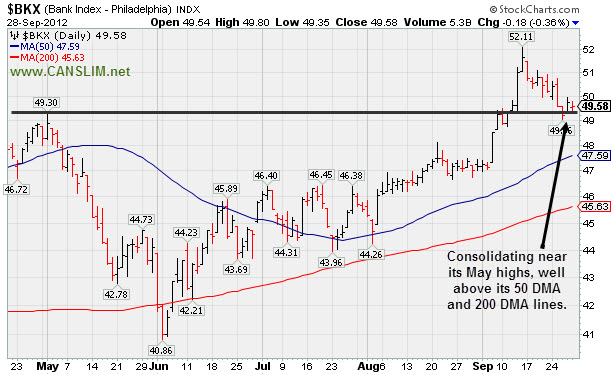
PICTURED: The Bank Index ($BKX -0.36%) is consolidating near its May highs, well above its 50-day and 200-day moving average (DMA) lines. Continued bullish action in financial stocks bodes well for the broader market outlook as, historically, the major averages have been less prone to damaging downdrafts while financial stocks are in healthy technical shape.
| Oil Services |
$OSX |
224.09 |
-2.07 |
-0.92% |
+3.61% |
| Healthcare |
$HMO |
2,412.15 |
+1.55 |
+0.06% |
+5.72% |
| Integrated Oil |
$XOI |
1,258.11 |
-8.72 |
-0.69% |
+2.36% |
| Semiconductor |
$SOX |
382.27 |
-3.19 |
-0.83% |
+4.89% |
| Networking |
$NWX |
207.28 |
-3.25 |
-1.54% |
-3.66% |
| Internet |
$IIX |
321.21 |
-1.42 |
-0.44% |
+14.01% |
| Broker/Dealer |
$XBD |
82.59 |
-0.47 |
-0.57% |
-0.82% |
| Retail |
$RLX |
655.46 |
-1.70 |
-0.26% |
+25.28% |
| Gold & Silver |
$XAU |
191.00 |
-1.18 |
-0.61% |
+5.74% |
| Bank |
$BKX |
49.58 |
-0.18 |
-0.36% |
+25.90% |
| Biotech |
$BTK |
1,557.62 |
+4.83 |
+0.31% |
+42.71% |
|
|
|
 |
Volume-Driven Gain Into New 52-Week High Territory
Kenneth J. Gruneisen - Passed the CAN SLIM® Master's Exam
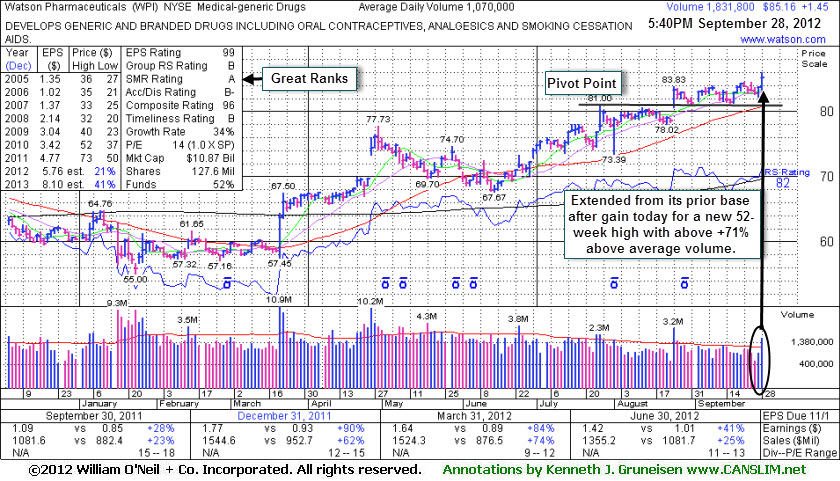
Watson Pharmaceuticals (WPI +$1.45 or +1.73% to $85.16) hit a new 52-week high with today's gain backed by +71% above average volume lifting it above the "max buy" level. Its color code was changed to green after getting extended from its prior base. Disciplined investors always avoid chasing extended stocks. Prior highs in the $81 area and its 50-day moving average (DMA) line define important support to watch on pullbacks.
It was last shown in this FSU section on 8/28/12 with an annotated graph under the headline, "Holding Ground Following Recent News Driven Gap Up". It was then holding its ground after its 8/24/12 gap up and solid gain above its pivot point backed by +143% above average volume triggered a technical buy signal. The considerable gain with above average volume followed news that its generic Lidoderm(R) received FDA approval, an encouraging development concerning the N criteria.
It reported earnings +41% on +25% sales revenues for the Jun '12 quarter. However, the sequential comparisons show recent deceleration in sales and earning growth rate, which has been noted as a small concern. The 5/09/12 mid-day report had previously noted - "Its improved fundamentals make it a worthy candidate for investors' watchlists. Sales revenues showed impressive acceleration while the 3 latest quarterly comparisons through Mar '12 showed earnings increases above the +25% guideline satisfying the C criteria. It also has maintained a strong annual earnings (A criteria) history." The number of top-rated funds owning its shares rose from 1,011 in Mar '12 to 1,051 in Jun '12, a reassuring sign concerning the I criteria.
|
|
|
Color Codes Explained :
Y - Better candidates highlighted by our
staff of experts.
G - Previously featured
in past reports as yellow but may no longer be buyable under the
guidelines.
***Last / Change / Volume data in this table is the closing quote data***
|
|
|
THESE ARE NOT BUY RECOMMENDATIONS!
Comments contained in the body of this report are technical
opinions only. The material herein has been obtained
from sources believed to be reliable and accurate, however,
its accuracy and completeness cannot be guaranteed.
This site is not an investment advisor, hence it does
not endorse or recommend any securities or other investments.
Any recommendation contained in this report may not
be suitable for all investors and it is not to be deemed
an offer or solicitation on our part with respect to
the purchase or sale of any securities. All trademarks,
service marks and trade names appearing in this report
are the property of their respective owners, and are
likewise used for identification purposes only.
This report is a service available
only to active Paid Premium Members.
You may opt-out of receiving report notifications
at any time. Questions or comments may be submitted
by writing to Premium Membership Services 665 S.E. 10 Street, Suite 201 Deerfield Beach, FL 33441-5634 or by calling 1-800-965-8307
or 954-785-1121.
|
|
|

