You are not logged in.
This means you
CAN ONLY VIEW reports that were published prior to Monday, April 14, 2025.
You
MUST UPGRADE YOUR MEMBERSHIP if you want to see any current reports.
AFTER MARKET UPDATE - MONDAY, SEPTEMBER 28TH, 2009
Previous After Market Report Next After Market Report >>>
|
|
|
|
DOW |
+124.17 |
9,789.36 |
+1.28% |
|
Volume |
979,328,890 |
-19% |
|
Volume |
1,959,531,160 |
-18% |
|
NASDAQ |
+39.82 |
2,130.74 |
+1.90% |
|
Advancers |
2,423 |
78% |
|
Advancers |
2,025 |
72% |
|
S&P 500 |
+18.60 |
1,062.98 |
+1.78% |
|
Decliners |
606 |
20% |
|
Decliners |
675 |
24% |
|
Russell 2000 |
+14.28 |
613.22 |
+2.38% |
|
52 Wk Highs |
188 |
|
|
52 Wk Highs |
88 |
|
|
S&P 600 |
+7.52 |
322.15 |
+2.39% |
|
52 Wk Lows |
4 |
|
|
52 Wk Lows |
6 |
|
|
 |
Major Averages Post Gains With Lighter Volume Totals
Adam Sarhan, Contributing Writer,
The major averages experienced their largest gain in several weeks after a series of takeovers were announced. As expected, Monday's volume totals were lower than the prior session on both major exchanges due to the Jewish Holiday which left many trading desks understaffed. Advancers trumped decliners by nearly a 4-to-1 ratio on the NYSE and by a 3-to-1 ratio on the Nasdaq exchange. There were 20 high-ranked companies from the CANSLIM.net Leaders List that made a new 52-week high and appeared on the CANSLIM.net BreakOuts Page, higher from the 6 issues that appeared on the prior session. New 52-week highs outnumbered new 52-week lows on both exchanges, while new 52-week lows were in the single digits yet again.
Investors bought stocks after a series of mergers and acquisitions (M&A) were announced from drug and technology companies. Affiliated Computer Services Inc.(ACS +13.99%) jumped nearly +14% after Xerox Corp. (XRX -14.38%) made its largest purchase by agreeing to buy the company for $6.4 billion. In the pharmaceutical space, Abbott Laboratories (ABT +2.64%) said it planned to purchase Solvay SA’s pharmaceutical unit and gain control of the TriCor cholesterol drug for $6.6 billion. After the acquisition, the Abbott will have a larger presence in emerging markets and lower its dependence on the arthritis drug Humira.
There are only two more trading sessions left in the third quarter. Barring some unforeseen event, this will be the strongest third quarter performance for the major averages since 1939 - and no, that is not a typo! Earnings season will officially begin next week when Alcoa (AA +2.68%), the first Dow company to release results, announces how they did on October 7th. As always, one might expect earnings seasons to play a pivotal role in this rally. So far, it is very healthy to see the major averages rally, which is perhaps a sign that last week's pullback may not lead to further downside testing. It remains imperative to continue watching the market and leading stocks for the best "read" on the underlying health of this rally.
Money Management Services: Attention 1-week only!
We realize that last year's brutal bear market adversely affected many portfolios that still may not have recovered. Therefore, for the rest of this week we will be accepting new account applications for $100,000 (or more). If you qualify, please fill out this form - click HERE. *Accounts over $100,000 please. ** Serious inquiries only.
PICTURED: The IBD 100 Index found support above its prior chart highs Monday and held its ground.
|
|
|
 |
Financial Shares Among Best Gainers While XAU Lags
Kenneth J. Gruneisen - Passed the CAN SLIM® Master's Exam
Financial shares helped lead the market's broad-based rally on Monday as the Bank Index ($BKX +2.84%) and Broker/Dealer Index ($XBD +3.33%) were among the standout gainers. The tech sector also produced solid gains as the Biotechnology Index ($BTK +1.80%), Internet Index ($IIX +1.97%), Semiconductor Index ($SOX +2.06%), and Networking Index ($NWX +2.68%) helped the tech-heavy Nasdaq Composite Index out pace the blue chips. Energy-related shares were also solid gainers as the Oil Services Index ($OSX +2.21%) and Integrated Oil Index ($XOI +1.89%) rose, and decent gains for the Retail Index ($RLX +1.72%) and Healthcare Index ($HMO +1.81%) rounded out the widely positive session.
Charts courtesy www.stockcharts.com
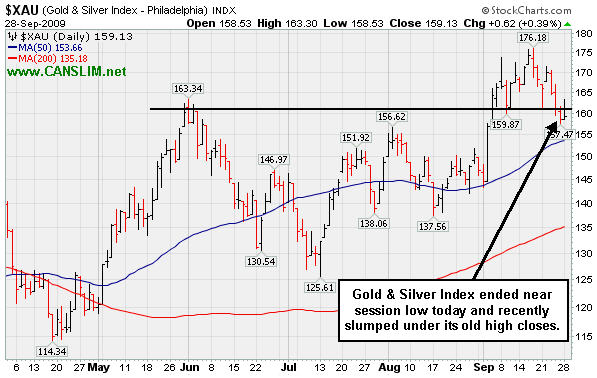
PICTURED: The Gold & Silver Index ($XAU +0.39%) was clearly a relative laggard on Monday, and it ended near the session low. It recently slumped under its old high closes, which may also raise some concerns for those who are bullish on gold-related stocks.
| Oil Services |
$OSX |
192.60 |
+4.16 |
+2.21% |
+58.66% |
| Healthcare |
$HMO |
1,194.17 |
+21.25 |
+1.81% |
+24.37% |
| Integrated Oil |
$XOI |
1,037.93 |
+19.27 |
+1.89% |
+5.95% |
| Semiconductor |
$SOX |
327.67 |
+6.62 |
+2.06% |
+54.44% |
| Networking |
$NWX |
238.32 |
+6.23 |
+2.68% |
+65.63% |
| Internet |
$IIX |
218.95 |
+4.24 |
+1.97% |
+63.68% |
| Broker/Dealer |
$XBD |
119.01 |
+3.84 |
+3.33% |
+53.62% |
| Retail |
$RLX |
378.79 |
+6.39 |
+1.72% |
+35.64% |
| Gold & Silver |
$XAU |
159.13 |
+0.62 |
+0.39% |
+28.49% |
| Bank |
$BKX |
47.43 |
+1.31 |
+2.84% |
+7.02% |
| Biotech |
$BTK |
943.54 |
+16.70 |
+1.80% |
+45.79% |
|
|
|
 |
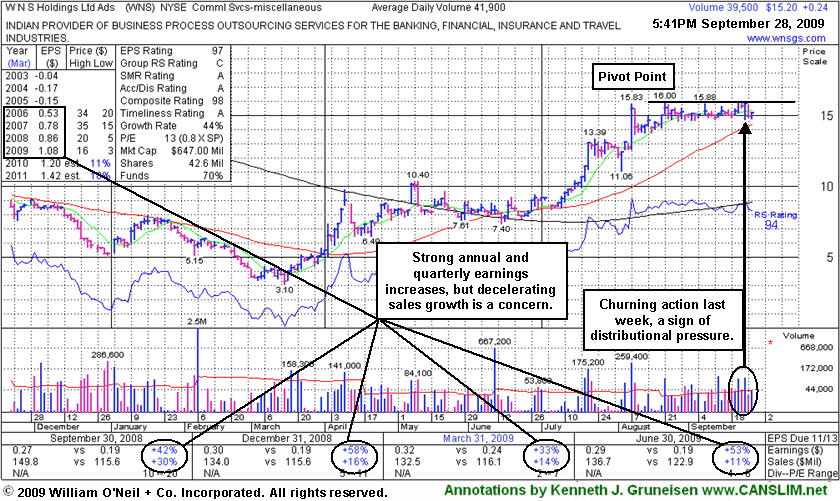
Orderly Base Takes Shape, Yet Patience Is Required
Kenneth J. Gruneisen - Passed the CAN SLIM® Master's Exam
W N S Holdings Ltd Ads (WNS +$0.24 or +1.58% to $15.20) has formed an orderly flat base for at least 5-weeks, and it was featured in yellow in today's mid-day report (read here). It encountered resistance in the $16 area last week while consolidating just above important support at its 50-day moving average (DMA) line. The recent high-volume and lack of meaningful upward price progress chart-wise may be considered "churning" action, indicative of distributional selling pressure offsetting new buying efforts. Quarterly earnings have been above the +25% guideline and its annual earnings history has been great, satisfying the C & A criteria. However, sales revenues growth has decelerated, raising some concerns. Only 14.5 million shares are in the public float, which is considered a good characteristic concerning the S criteria, and could contribute to greater volatility in the event of any heavier institutional buying or selling that may come.
For now, the high-ranked Indian Commercial Services might be an ideal candidate for investors' watch lists, while disciplined investors would be patient to wait for a bullish technical buy signal. Gains above the pivot point with at least +50% above average volume or more are still needed to confirm a new technical buy signal. Meanwhile, any deterioration under recent lows or its 50 DMA line would raise concern and trigger technical sell signals.
|
|
|
Color Codes Explained :
Y - Better candidates highlighted by our
staff of experts.
G - Previously featured
in past reports as yellow but may no longer be buyable under the
guidelines.
***Last / Change / Volume quote data in this table corresponds with the timestamp on the note***
Symbol/Exchange
Company Name
Industry Group |
Last |
Chg. |
Vol
% DAV |
Date Featured |
Price Featured |
Latest Pivot Point
Featured |
Status |
| Latest Max Buy Price |
ARO
- NYSE
Aeropostale Inc
RETAIL - Apparel Stores
|
$43.43
|
+0.24
|
1,380,198
50% DAV
2,738,400
|
8/21/2009
(Date
Featured) |
$39.21
(Price
Featured) |
PP = $38.84 |
G |
| MB = $40.78 |
Most Recent Note - 9/28/2009 5:11:50 PM
G - Today's small gain on lighter volume followed 4 consective losses on higher but below average volume. This high-ranked leader in the Retail - Clothing/shoe group is extended from a sound base and not buyable under the investment system guidelines now. Support to watch is at prior highs in the $38 area. It was featured in yellow in the 8/21/09 Mid-Day BreakOuts Report (read here).
>>> The latest Featured Stock Update with an annotated graph appeared on 9/18/2009. click here.
|
|
C
A
S
I |
News |
Chart |
SEC
View all notes Alert
me of new notes
Company
Profile
|
ARST
-
|
$23.35
|
+0.58
|
765,719
106% DAV
723,400
|
9/1/2009
(Date
Featured) |
$19.91
(Price
Featured) |
PP = $20.90 |
G |
| MB = $21.95 |
Most Recent Note - 9/28/2009 5:13:37 PM
G - Gain on average volume today, still perched near all-time highs but a bit extended from its latest sound base. Prior chart highs in the $20 area are important support to watch on pullbacks.
>>> The latest Featured Stock Update with an annotated graph appeared on 9/17/2009. click here.
|
|
C
A
S
I |
News |
Chart |
SEC
View all notes Alert
me of new notes
Company
Profile
|
BIDU
- NASDAQ
Baidu Inc Ads
INTERNET - Internet Information Providers
|
$396.05
|
+8.49
|
1,131,258
63% DAV
1,789,100
|
9/8/2009
(Date
Featured) |
$351.80
(Price
Featured) |
PP = $368.59 |
G |
| MB = $387.02 |
Most Recent Note - 9/28/2009 5:14:43 PM
G - Gain today on lighter volume, consolidating above its "max buy" level. BIDU was featured in yellow in the 9/08/09 Mid-Day BreakOuts Report (read here).
>>> The latest Featured Stock Update with an annotated graph appeared on 9/21/2009. click here.
|
|
C
A
S
I |
News |
Chart |
SEC
View all notes Alert
me of new notes
Company
Profile
|
CRM
- NYSE
Salesforce.com Inc
INTERNET - Internet Software & Services
|
$57.47
|
+2.41
|
1,950,675
96% DAV
2,042,100
|
8/16/2009
(Date
Featured) |
$47.12
(Price
Featured) |
PP = $45.59 |
G |
| MB = $47.87 |
Most Recent Note - 9/28/2009 5:15:23 PM
G - Rallied today after a pullback near prior highs in the $55 area, an intial support level well above additional support at its upward trendline and 50 DMA line.
>>> The latest Featured Stock Update with an annotated graph appeared on 9/15/2009. click here.
|
|
C
A
S
I |
News |
Chart |
SEC
View all notes Alert
me of new notes
Company
Profile
|
EBIX
- NASDAQ
Ebix Inc
COMPUTER SOFTWARE & SERVICES - Business Software & Services
|
$50.38
|
+3.66
|
377,340
273% DAV
138,300
|
8/28/2009
(Date
Featured) |
$45.86
(Price
Featured) |
PP = $45.35 |
G |
| MB = $47.62 |
Most Recent Note - 9/28/2009 5:16:17 PM
G - Gapped up today and posted a considerable gain on heavy volume. Distributional pressure recently led to a pullback near support at prior chart highs and its 50 DMA line in the $44-45 area. Recent whipsaw action briefly tested support, like its shakeout in mid-August. EBIX rallied as much as +19.76% since featured in yellow in the 8/28/09 Mid-Day BreakOuts Report (read here).
>>> The latest Featured Stock Update with an annotated graph appeared on 9/24/2009. click here.
|
|
C
A
S
I |
News |
Chart |
SEC
View all notes Alert
me of new notes
Company
Profile
|
GMCR
- NASDAQ
Green Mtn Coffee Roastrs
FOOD & BEVERAGE - Processed & Packaged Goods
|
$73.30
|
+4.37
|
3,621,022
244% DAV
1,484,000
|
7/17/2009
(Date
Featured) |
$60.15
(Price
Featured) |
PP = $63.79 |
G |
| MB = $66.98 |
Most Recent Note - 9/28/2009 5:24:00 PM
G - Hit a new all-time high today with volume more than 2 times average behind its gain while rallying up from a cup-with-handle type base (during which it completed an additional share offering on 8/07/09). Its 3-day pullback of about -9% tested support near its 50 DMA, and although the latest action is bullish, a new pivot point and max buy level were not cited because guidelines call for a cup-with-handle pattern to form over at least 8 weeks, the handle usually lasts at least a week and drifts downward by 10-15% in normal markets. Also, the Relative Strength line should lead or at least closely follow a stock's price into new high ground, but in this case its RS line is still under its July highs.
>>> The latest Featured Stock Update with an annotated graph appeared on 9/23/2009. click here.
|
|
C
A
S
I |
News |
Chart |
SEC
View all notes Alert
me of new notes
Company
Profile
|
NTES
- NASDAQ
Netease Inc Adr
INTERNET - Internet Information Providers
|
$44.09
|
-0.28
|
1,171,307
55% DAV
2,133,200
|
9/23/2009
(Date
Featured) |
$47.11
(Price
Featured) |
PP = $47.04 |
Y |
| MB = $49.39 |
Most Recent Note - 9/28/2009 5:25:52 PM
Y - Down today on light volume after encountering resistance last week and promptly pulling back under its latest pivot point. This may be considered a riskier late-stage base. Important support is at its 50 DMA line and upward trendline. Deterioration below those levels would raise more serious concerns and trigger technical sell signals.
>>> The latest Featured Stock Update with an annotated graph appeared on 9/25/2009. click here.
|
|
C
A
S
I |
News |
Chart |
SEC
View all notes Alert
me of new notes
Company
Profile
|
NVEC
- NASDAQ
N V E Corp
ELECTRONICS - Semiconductor - Specialized
|
$54.26
|
+2.63
|
102,352
109% DAV
93,900
|
8/26/2009
(Date
Featured) |
$55.32
(Price
Featured) |
PP = $57.60 |
G |
| MB = $60.48 |
Most Recent Note - 9/28/2009 5:30:54 PM
G - Gain today on near average volume, rallying up after a pullback near its August lows. It closed just under its 50 DMA line which could now act as resistance. Despite the encouraging sign of support arriving after recent distributional pressure, it needs more time to form a new sound base.
>>> The latest Featured Stock Update with an annotated graph appeared on 9/16/2009. click here.
|
|
C
A
S
I |
News |
Chart |
SEC
View all notes Alert
me of new notes
Company
Profile
|
PEGA
- NASDAQ
Pegasystems Inc
COMPUTER SOFTWARE & SERVICES - Business Software & Services
|
$34.93
|
+1.68
|
315,837
80% DAV
392,500
|
9/9/2009
(Date
Featured) |
$31.14
(Price
Featured) |
PP = $33.35 |
Y |
| MB = $35.02 |
Most Recent Note - 9/28/2009 5:33:19 PM
Y - Gapped up today and closed at another new high, but volume was below average behind the gain for this high-ranked Computer Software - Financial firm. An upward trendline connecting its July-September chart lows may be considered an initial support level above its 50 DMA line.
>>> The latest Featured Stock Update with an annotated graph appeared on 9/22/2009. click here.
|
|
C
A
S
I |
News |
Chart |
SEC
View all notes Alert
me of new notes
Company
Profile
|
WNS
- NYSE
W N S Holdings Ltd Ads
DIVERSIFIED SERVICES - Business/Management Services
|
$15.20
|
+0.24
|
39,687
95% DAV
41,900
|
9/28/2009
(Date
Featured) |
$15.28
(Price
Featured) |
PP = $16.10 |
Y |
| MB = $16.91 |
Most Recent Note - 9/28/2009 5:34:48 PM
Y - It has formed an orderly flat base for at least 5-weeks, and it was featured in yellow in today's mid-day report (read here). Encountered resistance in the $16 area last week while consolidating just above its 50 DMA line. Quarterly earnings have been above the +25% guideline and its annual earnings history has been great, satisfying the C & A criteria. However, sales revenues growth has decelerated.
>>> The latest Featured Stock Update with an annotated graph appeared on 9/28/2009. click here.
|
|
C
A
S
I |
News |
Chart |
SEC
View all notes Alert
me of new notes
Company
Profile
|
|
|
|
THESE ARE NOT BUY RECOMMENDATIONS!
Comments contained in the body of this report are technical
opinions only. The material herein has been obtained
from sources believed to be reliable and accurate, however,
its accuracy and completeness cannot be guaranteed.
This site is not an investment advisor, hence it does
not endorse or recommend any securities or other investments.
Any recommendation contained in this report may not
be suitable for all investors and it is not to be deemed
an offer or solicitation on our part with respect to
the purchase or sale of any securities. All trademarks,
service marks and trade names appearing in this report
are the property of their respective owners, and are
likewise used for identification purposes only.
This report is a service available
only to active Paid Premium Members.
You may opt-out of receiving report notifications
at any time. Questions or comments may be submitted
by writing to Premium Membership Services 665 S.E. 10 Street, Suite 201 Deerfield Beach, FL 33441-5634 or by calling 1-800-965-8307
or 954-785-1121.
|
|
|


