***Last / Change / Volume data in this table is the closing quote data***
Symbol/Exchange
Company Name
Industry Group |
PRICE |
CHANGE
(%Change) |
Day High |
Volume
(% DAV)
(% 50 day avg vol) |
52 Wk Hi
% From Hi |
Featured
Date |
Price
Featured |
Pivot Featured |
|
Max Buy |
ALXN
-
NASDAQ
Alexion Pharmaceuticals
DRUGS - Drug Manufacturers - Other
|
$113.25
|
+1.29
1.15% |
$113.54
|
754,892
63.32% of 50 DAV
50 DAV is 1,192,200
|
$116.43
-2.73%
|
8/23/2012
|
$103.70
|
PP = $110.06
|
|
MB = $115.56
|
Most Recent Note - 9/26/2012 5:15:16 PM
Y - Pulled back from its 52 week high today. Color code is changed to yellow after retreating below its "max buy" level. See the latest FSU analysis for more details and a new annotated graph.
>>> The latest Featured Stock Update with an annotated graph appeared on 9/26/2012. Click here.
View all notes |
Alert me of new notes |
CANSLIM.net Company Profile |
SEC |
Zacks Reports |
StockTalk |
News |
Chart |
Request a new note
C
A N
S L
I M


|
ASPS
-
NASDAQ
Altisource Ptf Sltns Sa
REAL ESTATE - Property Management/Developmen
|
$86.05
|
+1.85
2.20% |
$87.19
|
145,179
112.19% of 50 DAV
50 DAV is 129,400
|
$92.29
-6.76%
|
9/24/2012
|
$87.24
|
PP = $92.39
|
|
MB = $97.01
|
 Most Recent Note - 9/27/2012 3:52:11 PM
Y - Today's gain halted its 4-session slide near recent lows defining near-term support along with its 50 DMA line in the $82 area. Color code was changed to yellow with new pivot point cited based on its 8/20/12 high plus 10 cents. Volume-driven gains above its pivot point may trigger a new (or add-on) technical buy signal.
>>> The latest Featured Stock Update with an annotated graph appeared on 9/11/2012. Click here.
View all notes |
Alert me of new notes |
CANSLIM.net Company Profile |
SEC |
Zacks Reports |
StockTalk |
News |
Chart |
Request a new note
C
A N
S L
I M
|
CFNL
-
NASDAQ
Cardinal Financial Corp
BANKING - Regional - Southeast Banks
|
$14.37
|
+0.00
0.00% |
$14.44
|
80,782
115.73% of 50 DAV
50 DAV is 69,800
|
$14.79
-2.84%
|
8/17/2012
|
$12.84
|
PP = $13.31
|
|
MB = $13.98
|
Most Recent Note - 9/27/2012 4:03:32 PM
G - Consolidating near its 52-week high today, holding its ground stubbornly after a spurt of volume-driven gains. Extended from its prior base, and its prior highs and 50 DMA line define support to watch on pullbacks near the $13 level.
>>> The latest Featured Stock Update with an annotated graph appeared on 9/25/2012. Click here.
View all notes |
Alert me of new notes |
CANSLIM.net Company Profile |
SEC |
Zacks Reports |
StockTalk |
News |
Chart |
Request a new note
C
A N
S L
I M
|
CMCSA
-
NASDAQ
Comcast Corp Cl A
MEDIA - CATV Systems
|
$35.79
|
+0.67
1.89% |
$35.87
|
12,729,728
99.36% of 50 DAV
50 DAV is 12,811,700
|
$36.90
-3.02%
|
6/11/2012
|
$29.94
|
PP = $30.98
|
|
MB = $32.53
|
Most Recent Note - 9/27/2012 3:53:47 PM
G - Consolidating above prior highs after recently rallying from an orderly flat base. No new pivot point was cited because of fundamental concerns raised by sub par sales and earnings growth in the Jun '12 quarter.
>>> The latest Featured Stock Update with an annotated graph appeared on 9/21/2012. Click here.
View all notes |
Alert me of new notes |
CANSLIM.net Company Profile |
SEC |
Zacks Reports |
StockTalk |
News |
Chart |
Request a new note
C
A N
S L
I M
|
DVA
-
NYSE
Davita Inc
HEALTH SERVICES - Specialized Health Services
|
$102.40
|
+1.44
1.43% |
$102.59
|
678,434
95.29% of 50 DAV
50 DAV is 712,000
|
$103.97
-1.51%
|
9/5/2012
|
$102.92
|
PP = $100.62
|
|
MB = $105.65
|
Most Recent Note - 9/27/2012 3:55:19 PM
Y - Gain today with light volume has it poised for a best-ever close. Considerable gain on 9/21/12 above its pivot point was backed by more than 3 times average volume confirming a technical buy signal.
>>> The latest Featured Stock Update with an annotated graph appeared on 9/5/2012. Click here.
View all notes |
Alert me of new notes |
CANSLIM.net Company Profile |
SEC |
Zacks Reports |
StockTalk |
News |
Chart |
Request a new note
C
A N
S L
I M
|
Symbol/Exchange
Company Name
Industry Group |
PRICE |
CHANGE
(%Change) |
Day High |
Volume
(% DAV)
(% 50 day avg vol) |
52 Wk Hi
% From Hi |
Featured
Date |
Price
Featured |
Pivot Featured |
|
Max Buy |
ECPG
-
NASDAQ
Encore Capital Group Inc
FINANCIAL SERVICES - Credit Services
|
$28.28
|
-0.01
-0.04% |
$28.37
|
123,518
95.16% of 50 DAV
50 DAV is 129,800
|
$30.91
-8.51%
|
8/3/2012
|
$29.91
|
PP = $30.45
|
|
MB = $31.97
|
Most Recent Note - 9/27/2012 3:57:07 PM
G - Color code is changed to green and its outlook gets worse the longer it lingers below its 50 DMA line. Disciplined investors always limit losses if ever a stock falls more than -7% from their purchase price.
>>> The latest Featured Stock Update with an annotated graph appeared on 9/12/2012. Click here.
View all notes |
Alert me of new notes |
CANSLIM.net Company Profile |
SEC |
Zacks Reports |
StockTalk |
News |
Chart |
Request a new note
C
A N
S L
I M
|
EXPE
-
NASDAQ
Expedia Inc
INTERNET - Internet Information Providers
|
$58.22
|
+0.57
0.99% |
$58.62
|
1,149,128
34.58% of 50 DAV
50 DAV is 3,322,800
|
$60.29
-3.43%
|
4/27/2012
|
$41.80
|
PP = $35.57
|
|
MB = $37.35
|
Most Recent Note - 9/27/2012 3:58:26 PM
G - Holding its ground perched near its 52-week high. No overhead supply remains to hinder its progress, however weak industry group action and iffy fundamentals were noted as causes for concern.
>>> The latest Featured Stock Update with an annotated graph appeared on 9/19/2012. Click here.
View all notes |
Alert me of new notes |
CANSLIM.net Company Profile |
SEC |
Zacks Reports |
StockTalk |
News |
Chart |
Request a new note
C
A N
S L
I M
|
GPX
-
NYSE
G P Strategies Corp
DIVERSIFIED SERVICES - Education and Training Services
|
$19.53
|
+0.10
0.51% |
$19.58
|
177,601
245.31% of 50 DAV
50 DAV is 72,400
|
$20.67
-5.52%
|
6/29/2012
|
$18.01
|
PP = $18.15
|
|
MB = $19.06
|
Most Recent Note - 9/26/2012 1:15:39 PM
G - Consolidating -6.9% off its 52-week high today after 6 consecutive losses, now testing support at its 50 DMA line. More damaging losses would raise concerns and trigger a technical sell signal.
>>> The latest Featured Stock Update with an annotated graph appeared on 9/13/2012. Click here.
View all notes |
Alert me of new notes |
CANSLIM.net Company Profile |
SEC |
Zacks Reports |
StockTalk |
News |
Chart |
Request a new note
C
A N
S L
I M
|
KH
-
NYSE
China Kanghui Hldgs Ads
HEALTH SERVICES - Medical Appliances and Equipment
|
$25.11
|
+0.61
2.49% |
$25.25
|
19,438
59.26% of 50 DAV
50 DAV is 32,800
|
$27.47
-8.59%
|
8/30/2012
|
$24.19
|
PP = $22.90
|
|
MB = $24.05
|
Most Recent Note - 9/26/2012 3:47:41 PM
G - Enduring distributional pressure this week. Consolidating above prior highs defining chart support above its 50 DMA line.
>>> The latest Featured Stock Update with an annotated graph appeared on 8/30/2012. Click here.
View all notes |
Alert me of new notes |
CANSLIM.net Company Profile |
SEC |
Zacks Reports |
StockTalk |
News |
Chart |
Request a new note
C
A N
S L
I M
|
LKQ
-
NASDAQ
L K Q Corp
WHOLESALE - Auto Parts
|
$18.84
|
+0.08
0.43% |
$18.99
|
748,244
54.24% of 50 DAV
50 DAV is 1,379,400
|
$20.02
-5.87%
|
8/9/2012
|
$18.97
|
PP = $18.72
|
|
MB = $19.66
|
Most Recent Note - 9/26/2012 1:08:17 PM
Y - Overcame distributional pressure this week after undercutting its 50 DMA line noted as important chart support to watch on pullbacks.Do not be confused by a 2:1 share split effective 9/19/12 (Featured Price, Pivot Point and Max Buy were adjusted).
>>> The latest Featured Stock Update with an annotated graph appeared on 9/17/2012. Click here.
View all notes |
Alert me of new notes |
CANSLIM.net Company Profile |
SEC |
Zacks Reports |
StockTalk |
News |
Chart |
Request a new note
C
A N
S L
I M
|
Symbol/Exchange
Company Name
Industry Group |
PRICE |
CHANGE
(%Change) |
Day High |
Volume
(% DAV)
(% 50 day avg vol) |
52 Wk Hi
% From Hi |
Featured
Date |
Price
Featured |
Pivot Featured |
|
Max Buy |
LNKD
-
NYSE
Linkedin Corp Class A
INTERNET - Internet Information Providers
|
$119.61
|
+1.61
1.36% |
$120.11
|
1,350,385
54.66% of 50 DAV
50 DAV is 2,470,500
|
$125.50
-4.69%
|
9/5/2012
|
$113.25
|
PP = $113.10
|
|
MB = $118.76
|
Most Recent Note - 9/27/2012 4:01:48 PM
G - Consolidating -4.4% off its 52-week and all-time highs today. Prior highs near $113 define initial support to watch on pullbacks.
>>> The latest Featured Stock Update with an annotated graph appeared on 9/6/2012. Click here.
View all notes |
Alert me of new notes |
CANSLIM.net Company Profile |
SEC |
Zacks Reports |
StockTalk |
News |
Chart |
Request a new note
C
A N
S L
I M
|
MIDD
-
NASDAQ
Middleby Corp
MANUFACTURING - Diversified Machinery
|
$116.70
|
+1.41
1.22% |
$117.66
|
31,136
30.17% of 50 DAV
50 DAV is 103,200
|
$122.57
-4.79%
|
8/9/2012
|
$118.60
|
PP = $104.92
|
|
MB = $110.17
|
Most Recent Note - 9/26/2012 1:09:42 PM
G - Perched -5.5% off its 52-week high today. Extended from its prior base, and its 50 DMA line and recent lows define near-term chart support to watch.
>>> The latest Featured Stock Update with an annotated graph appeared on 9/18/2012. Click here.
View all notes |
Alert me of new notes |
CANSLIM.net Company Profile |
SEC |
Zacks Reports |
StockTalk |
News |
Chart |
Request a new note
C
A N
S L
I M
|
N
-
NYSE
Netsuite Inc
DIVERSIFIED SERVICES - Business/Management Services
|
$62.84
|
+1.90
3.12% |
$63.03
|
536,894
83.36% of 50 DAV
50 DAV is 644,100
|
$63.25
-0.65%
|
8/20/2012
|
$55.88
|
PP = $59.32
|
|
MB = $62.29
|
Most Recent Note - 9/27/2012 3:46:19 PM
G - Rallying above its "max buy" level with today's gain and its color code is changed to green. Prior highs near $59 define initial support above its 50 DMA line.
>>> The latest Featured Stock Update with an annotated graph appeared on 9/24/2012. Click here.
View all notes |
Alert me of new notes |
CANSLIM.net Company Profile |
SEC |
Zacks Reports |
StockTalk |
News |
Chart |
Request a new note
C
A N
S L
I M
|
NSM
-
NYSE
Nationstar Mtg Hldgs Inc
FINANCIAL SERVICES - Credit Services
|
$32.88
|
-0.67
-2.00% |
$34.13
|
2,101,761
220.75% of 50 DAV
50 DAV is 952,100
|
$34.90
-5.79%
|
8/29/2012
|
$27.96
|
PP = $28.85
|
|
MB = $30.29
|
Most Recent Note - 9/27/2012 12:46:58 PM
G - Perched at its 52-week high today following 8 consecutive gains, extended from its prior base. Disciplined investors avoid chasing stocks more than +5% above their pivot point.
>>> The latest Featured Stock Update with an annotated graph appeared on 9/7/2012. Click here.
View all notes |
Alert me of new notes |
CANSLIM.net Company Profile |
SEC |
Zacks Reports |
StockTalk |
News |
Chart |
Request a new note
C
A N
S L
I M
|
OSIS
-
NASDAQ
O S I Systems Inc
ELECTRONICS - Semiconductor Equipment and Mate
|
$78.65
|
+3.51
4.67% |
$78.88
|
187,987
152.09% of 50 DAV
50 DAV is 123,600
|
$78.58
0.09%
|
9/5/2012
|
$74.39
|
PP = $75.10
|
|
MB = $78.86
|
Most Recent Note - 9/27/2012 3:39:13 PM
Y - Hitting a new 52-week high today with a volume-driven gain, approaching its "max buy" level. Near term support is at its 50 DMA line.
>>> The latest Featured Stock Update with an annotated graph appeared on 9/14/2012. Click here.
View all notes |
Alert me of new notes |
CANSLIM.net Company Profile |
SEC |
Zacks Reports |
StockTalk |
News |
Chart |
Request a new note
C
A N
S L
I M
|
Symbol/Exchange
Company Name
Industry Group |
PRICE |
CHANGE
(%Change) |
Day High |
Volume
(% DAV)
(% 50 day avg vol) |
52 Wk Hi
% From Hi |
Featured
Date |
Price
Featured |
Pivot Featured |
|
Max Buy |
RNF
-
NYSE
Rentech Nitrogen Ptnr Lp
CHEMICALS - Agricultural Chemicals
|
$38.34
|
+1.26
3.40% |
$38.88
|
376,150
86.41% of 50 DAV
50 DAV is 435,300
|
$40.05
-4.27%
|
7/27/2012
|
$29.58
|
PP = $30.60
|
|
MB = $32.13
|
Most Recent Note - 9/27/2012 3:47:40 PM
G - Gapped up today, rebounding after a volume-driven loss on the prior session. It is extended from its prior base. An upward trendline defines near-term chart support that comes into play above its 50 DMA line.
>>> The latest Featured Stock Update with an annotated graph appeared on 8/31/2012. Click here.
View all notes |
Alert me of new notes |
CANSLIM.net Company Profile |
SEC |
Zacks Reports |
StockTalk |
News |
Chart |
Request a new note
C
A N
S L
I M
|
SWI
-
NYSE
Solarwinds Inc
COMPUTER SOFTWARE and SERVICES - Application Software
|
$56.34
|
+1.85
3.40% |
$56.51
|
1,325,622
120.10% of 50 DAV
50 DAV is 1,103,800
|
$60.95
-7.56%
|
7/25/2012
|
$47.82
|
PP = $47.89
|
|
MB = $50.28
|
Most Recent Note - 9/27/2012 3:50:03 PM
G - Gain today has it showing resilience near its 50 DMA line following a damaging loss. A subsequent violation of the prior session's low ($53.78) would raise more serious concerns.
>>> The latest Featured Stock Update with an annotated graph appeared on 8/29/2012. Click here.
View all notes |
Alert me of new notes |
CANSLIM.net Company Profile |
SEC |
Zacks Reports |
StockTalk |
News |
Chart |
Request a new note
C
A N
S L
I M
|
TDG
-
NYSE
Transdigm Group Inc
AEROSPACE/DEFENSE - Aerospace/Defense Products and; Services
|
$141.09
|
+0.05
0.04% |
$142.86
|
1,006,669
254.40% of 50 DAV
50 DAV is 395,700
|
$146.72
-3.84%
|
8/16/2012
|
$132.23
|
PP = $136.44
|
|
MB = $143.26
|
Most Recent Note - 9/27/2012 12:58:09 PM
Y - Consolidating below its "max buy" level with volume running at an above average pace behind today's 2nd consecutive loss. Its 50 DMA line and prior highs define near-term support to watch on pullbacks.
>>> The latest Featured Stock Update with an annotated graph appeared on 9/20/2012. Click here.
View all notes |
Alert me of new notes |
CANSLIM.net Company Profile |
SEC |
Zacks Reports |
StockTalk |
News |
Chart |
Request a new note
C
A N
S L
I M
|
ULTA
-
NASDAQ
Ulta Salon Cosm & Frag
SPECIALTY RETAIL - Specialty Retail, Other
|
$96.66
|
+0.18
0.19% |
$97.33
|
429,860
53.43% of 50 DAV
50 DAV is 804,600
|
$103.52
-6.63%
|
9/4/2012
|
$93.17
|
PP = $98.52
|
|
MB = $103.45
|
Most Recent Note - 9/26/2012 1:11:16 PM
Y - Slumping further below its pivot point with a loss on light volume today, raising concerns. Disciplined investors always limit losses if ever any stock falls -7% or more from their purchase price.
>>> The latest Featured Stock Update with an annotated graph appeared on 9/4/2012. Click here.
View all notes |
Alert me of new notes |
CANSLIM.net Company Profile |
SEC |
Zacks Reports |
StockTalk |
News |
Chart |
Request a new note
C
A N
S L
I M
|
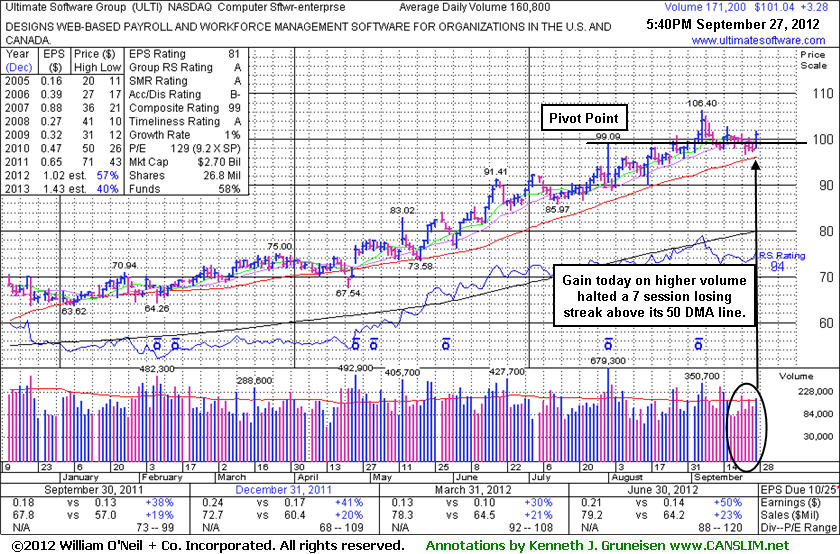
ULTI
-
NASDAQ
Ultimate Software Group
INTERNET - Internet Software and Services
|
$101.04
|
+3.28
3.36% |
$101.78
|
173,453
107.87% of 50 DAV
50 DAV is 160,800
|
$106.40
-5.04%
|
8/27/2012
|
$98.36
|
PP = $99.19
|
|
MB = $104.15
|
Most Recent Note - 9/27/2012 6:01:25 PM
Y - Today's solid gain with higher volume has halted a streak of 7 consecutive small losses. Prior chart highs define initial support to watch above its 50 DMA line. See the latest FSU analysis for more details and a new annotated graph.
>>> The latest Featured Stock Update with an annotated graph appeared on 9/27/2012. Click here.
View all notes |
Alert me of new notes |
CANSLIM.net Company Profile |
SEC |
Zacks Reports |
StockTalk |
News |
Chart |
Request a new note
C
A N
S L
I M
|
Symbol/Exchange
Company Name
Industry Group |
PRICE |
CHANGE
(%Change) |
Day High |
Volume
(% DAV)
(% 50 day avg vol) |
52 Wk Hi
% From Hi |
Featured
Date |
Price
Featured |
Pivot Featured |
|
Max Buy |
VSI
-
NYSE
Vitamin Shoppe Inc
SPECIALTY RETAIL - Specialty Retail, Other
|
$57.37
|
+1.06
1.88% |
$57.61
|
215,166
59.27% of 50 DAV
50 DAV is 363,000
|
$61.83
-7.21%
|
6/29/2012
|
$54.93
|
PP = $55.03
|
|
MB = $57.78
|
Most Recent Note - 9/27/2012 3:43:38 PM
G - Overcame early weakness today and managed a positive reversal. Prior lows near $52 define important chart support below its 50 DMA line.
>>> The latest Featured Stock Update with an annotated graph appeared on 9/10/2012. Click here.
View all notes |
Alert me of new notes |
CANSLIM.net Company Profile |
SEC |
Zacks Reports |
StockTalk |
News |
Chart |
Request a new note
C
A N
S L
I M
|
WPI
-
NYSE
Watson Pharmaceuticals
DRUGS - Drugs - Generic
|
$83.71
|
+0.88
1.06% |
$83.84
|
764,281
70.16% of 50 DAV
50 DAV is 1,089,400
|
$84.59
-1.04%
|
8/24/2012
|
$82.90
|
PP = $81.10
|
|
MB = $85.16
|
Most Recent Note - 9/26/2012 1:12:50 PM
Y - Still holding its ground today in a tight range near its 52-week high. Prior highs in the $81 area and its 50 DMA line define important support to watch on pullbacks.
>>> The latest Featured Stock Update with an annotated graph appeared on 8/28/2012. Click here.
View all notes |
Alert me of new notes |
CANSLIM.net Company Profile |
SEC |
Zacks Reports |
StockTalk |
News |
Chart |
Request a new note
C
A N
S L
I M
|