***Last / Change / Volume data in this table is the closing quote data***
Symbol/Exchange
Company Name
Industry Group |
PRICE |
CHANGE
(%Change) |
Day High |
Volume
(% DAV)
(% 50 day avg vol) |
52 Wk Hi
% From Hi |
Featured
Date |
Price
Featured |
Pivot Featured |
|
Max Buy |
ABV
-
NYSE
Comp De Bebidas Adr
FOOD and BEVERAGE - Beverages - Brewers
|
$121.13
|
+1.29
1.08% |
$122.20
|
634,552
103.80% of 50 DAV
50 DAV is 611,300
|
$122.50
-1.12%
|
6/29/2010
|
$104.74
|
PP = $109.33
|
|
MB = $114.80
|
Most Recent Note - 9/24/2010 4:12:57 PM
G - This Brazil-based beverage firm is hovering at its all-time high, stubbornly holding its ground after recent gains. Extended from a sound base, its prior highs in the $111-112 area define support above its 50 DMA line.
>>> The latest Featured Stock Update with an annotated graph appeared on 8/18/2010. Click here.
View all notes |
Alert me of new notes |
CANSLIM.net Company Profile |
SEC |
Zacks Reports |
StockTalk |
News |
Chart |
Request a new note
C
A N
S L
I M


|
ARUN
-
NASDAQ
Aruba Networks Inc
COMPUTER HARDWARE - Networking andamp; Communication Dev
|
$22.14
|
+0.01
0.05% |
$22.80
|
2,148,110
105.76% of 50 DAV
50 DAV is 2,031,200
|
$22.18
-0.18%
|
8/30/2010
|
$18.12
|
PP = $18.51
|
|
MB = $19.44
|
Most Recent Note - 9/24/2010 11:42:33 AM
G - Following a positive reversal on the prior session it gapped up today. Extended from its latest base. Prior highs near $18 define a chart support level to watch.
>>> The latest Featured Stock Update with an annotated graph appeared on 9/2/2010. Click here.
View all notes |
Alert me of new notes |
CANSLIM.net Company Profile |
SEC |
Zacks Reports |
StockTalk |
News |
Chart |
Request a new note
C
A N
S L
I M
|
ASPS
-
NASDAQ
Altisource Ptf Sltns Sa
REAL ESTATE - Property Management/Developmen
|
$30.00
|
+0.10
0.32% |
$30.00
|
122,481
105.95% of 50 DAV
50 DAV is 115,600
|
$30.20
-0.66%
|
9/23/2010
|
$28.36
|
PP = $28.90
|
|
MB = $30.35
|
Most Recent Note - 9/24/2010 12:07:58 PM
Y - Up again today, it triggered a technical buy signal on 9/23/10 with a considerable gain on nearly 4 times average volume. No overhead supply remains as this Luxembourg-based Financial Services firm spiked to a new 52-week high after it was featured in yellow in the mid-day report (read here) while building on an orderly 9-week flat base above its 50 DMA line. Its Sep '09 quarter and FY '09 earnings results have blue triangles beside the earnings figure on the graph service used by our experts indicating that pre-tax, non-recurring items were included (where possible, such items are normally removed to provide data better suited for comparison). The number of top-rated funds owning its shares fell from 47 in Sep '09 to 35 in Jun '10. It did not make significant progress since noted in February 2010 mid-day reports -"Annual earnings (A criteria) history has been up and down and needs additional review."
>>> The latest Featured Stock Update with an annotated graph appeared on 9/23/2010. Click here.
View all notes |
Alert me of new notes |
CANSLIM.net Company Profile |
SEC |
Zacks Reports |
StockTalk |
News |
Chart |
Request a new note
C
A N
S L
I M
|
BIDU
-
NASDAQ
Baidu Inc Ads
INTERNET - Internet Information Providers
|
$103.82
|
+5.99
6.12% |
$104.39
|
20,979,196
223.44% of 50 DAV
50 DAV is 9,389,200
|
$98.13
5.80%
|
9/17/2010
|
$85.73
|
PP = $88.42
|
|
MB = $92.84
|
 Most Recent Note - 9/27/2010 12:22:11 PM
G - Gapped up again today for its 6th consecutive gain. Volume totals have been above average but not extremely heavy, yet it has the look of a climax run as it gets more extended today. Prior highs in the $88 area define support now.
>>> The latest Featured Stock Update with an annotated graph appeared on 8/13/2010. Click here.
View all notes |
Alert me of new notes |
CANSLIM.net Company Profile |
SEC |
Zacks Reports |
StockTalk |
News |
Chart |
Request a new note
C
A N
S L
I M
|
CACC
-
NASDAQ
Credit Acceptance Corp
FINANCIAL SERVICES - Credit Services
|
$60.43
|
-1.55
-2.50% |
$62.39
|
27,361
61.62% of 50 DAV
50 DAV is 44,400
|
$63.45
-4.76%
|
7/29/2010
|
$52.04
|
PP = $54.07
|
|
MB = $56.77
|
Most Recent Note - 9/27/2010 5:30:46 PM
G - Loss today on light volume, slumping back under an important prior high ($61.41). Noted previously, an upward trendline defines support above its 50 DMA line and its recent chart low ($56.06).
>>> The latest Featured Stock Update with an annotated graph appeared on 8/2/2010. Click here.
View all notes |
Alert me of new notes |
CANSLIM.net Company Profile |
SEC |
Zacks Reports |
StockTalk |
News |
Chart |
Request a new note
C
A N
S L
I M
|
Symbol/Exchange
Company Name
Industry Group |
PRICE |
CHANGE
(%Change) |
Day High |
Volume
(% DAV)
(% 50 day avg vol) |
52 Wk Hi
% From Hi |
Featured
Date |
Price
Featured |
Pivot Featured |
|
Max Buy |
CMG
-
NYSE
Chipotle Mexican Grill
LEISURE - Restaurants
|
$175.83
|
+2.64
1.52% |
$176.38
|
662,564
93.78% of 50 DAV
50 DAV is 706,500
|
$173.19
1.52%
|
9/1/2010
|
$158.31
|
PP = $155.52
|
|
MB = $163.30
|
Most Recent Note - 9/24/2010 4:00:31 PM
G - Gapped up today for a solid gain with above average volume, reaching a new all-time high. Extended from prior highs in the $155 area that define chart support.
>>> The latest Featured Stock Update with an annotated graph appeared on 9/1/2010. Click here.
View all notes |
Alert me of new notes |
CANSLIM.net Company Profile |
SEC |
Zacks Reports |
StockTalk |
News |
Chart |
Request a new note
C
A N
S L
I M
|
CRM
-
NYSE
Salesforce.Com Inc
INTERNET - Internet Software and Services
|
$117.04
|
-2.30
-1.93% |
$119.55
|
1,711,133
63.58% of 50 DAV
50 DAV is 2,691,100
|
$123.77
-5.44%
|
6/2/2010
|
$88.44
|
PP = $89.60
|
|
MB = $94.08
|
Most Recent Note - 9/27/2010 5:39:37 PM
G - Still pulling back on lighter volume following its 9/20/10 gain with +54% above average volume from an advanced "3-weeks tight" type pattern.
>>> The latest Featured Stock Update with an annotated graph appeared on 8/16/2010. Click here.
View all notes |
Alert me of new notes |
CANSLIM.net Company Profile |
SEC |
Zacks Reports |
StockTalk |
News |
Chart |
Request a new note
C
A N
S L
I M
|
CTRP
-
NASDAQ
Ctrip.Com Intl Ltd Adr
LEISURE - Resorts and Casinos
|
$48.57
|
+1.65
3.52% |
$49.23
|
3,020,695
173.77% of 50 DAV
50 DAV is 1,738,300
|
$47.29
2.71%
|
9/24/2010
|
$46.75
|
PP = $47.11
|
|
MB = $49.47
|
Most Recent Note - 9/27/2010 5:57:56 PM
Y - Hit another new 52-week high with its 7th consecutive gain on ever increasing volume, and today's volume total +74% above average met the guideline for a proper technical buy signal. It was featured in the 9/24/10 mid-day report (read here). No overhead supply remains to act as resistance, while the price/volume action has been choppy since it was dropped from the Featured Stocks list on 5/06/10. Quarterly and annual earnings history has been strong (good C and A criteria). Leadership (L criteria) in the stock's Industry Group (Leisure - Travel Booking) is a reassuring sign.
>>> The latest Featured Stock Update with an annotated graph appeared on 4/12/2010. Click here.
View all notes |
Alert me of new notes |
CANSLIM.net Company Profile |
SEC |
Zacks Reports |
StockTalk |
News |
Chart |
Request a new note
C
A N
S L
I M
|
EBIX
-
NASDAQ
Ebix Inc
COMPUTER SOFTWARE and SERVICES - Business Software and Services
|
$23.23
|
+0.23
1.00% |
$23.76
|
819,521
180.31% of 50 DAV
50 DAV is 454,500
|
$23.00
1.00%
|
9/23/2010
|
$21.78
|
PP = $22.74
|
|
MB = $23.88
|
Most Recent Note - 9/27/2010 12:49:05 PM
Y - Gapped up again today. The prior gain above its pivot point with heavy volume triggered a technical buy signal. Caution and discipline are important, as, technically, there is no near-term chart support. Its large cup shaped base lacked a proper handle.
>>> The latest Featured Stock Update with an annotated graph appeared on 9/24/2010. Click here.
View all notes |
Alert me of new notes |
CANSLIM.net Company Profile |
SEC |
Zacks Reports |
StockTalk |
News |
Chart |
Request a new note
C
A N
S L
I M
|
EGO
-
NYSE
Eldorado Gold Corp
METALS and MINING - Gold
|
$18.16
|
-0.09
-0.49% |
$18.32
|
3,984,232
92.07% of 50 DAV
50 DAV is 4,327,200
|
$20.23
-10.23%
|
8/19/2010
|
$18.25
|
PP = $19.17
|
|
MB = $20.13
|
Most Recent Note - 9/24/2010 3:51:27 PM
Y - Pulling back again today with above average volume, slumping near its old high closes and its 50 DMA line. More damaging losses would raise concerns and trigger technical sell signals.
>>> The latest Featured Stock Update with an annotated graph appeared on 8/19/2010. Click here.
View all notes |
Alert me of new notes |
CANSLIM.net Company Profile |
SEC |
Zacks Reports |
StockTalk |
News |
Chart |
Request a new note
C
A N
S L
I M
|
Symbol/Exchange
Company Name
Industry Group |
PRICE |
CHANGE
(%Change) |
Day High |
Volume
(% DAV)
(% 50 day avg vol) |
52 Wk Hi
% From Hi |
Featured
Date |
Price
Featured |
Pivot Featured |
|
Max Buy |
FFIV
-
NASDAQ
F 5 Networks Inc
INTERNET - Internet Software and Services
|
$103.23
|
+0.16
0.16% |
$104.08
|
1,328,744
79.01% of 50 DAV
50 DAV is 1,681,800
|
$105.72
-2.36%
|
6/16/2010
|
$74.50
|
PP = $74.10
|
|
MB = $77.81
|
Most Recent Note - 9/22/2010 2:34:51 PM
G - Pulling back on lighter volume after starting the week with a gain for a new all-time high with volume slightly above average. A steep upward trendline connecting July-August lows defines an initial chart support level well above its 50 DMA line.
>>> The latest Featured Stock Update with an annotated graph appeared on 9/13/2010. Click here.
View all notes |
Alert me of new notes |
CANSLIM.net Company Profile |
SEC |
Zacks Reports |
StockTalk |
News |
Chart |
Request a new note
C
A N
S L
I M
|
FOSL
-
NASDAQ
Fossil Inc
CONSUMER DURABLES - Recreational Goods, Other
|
$53.13
|
+0.10
0.19% |
$53.67
|
452,270
58.89% of 50 DAV
50 DAV is 768,000
|
$53.05
0.15%
|
8/10/2010
|
$45.54
|
PP = $42.69
|
|
MB = $44.82
|
Most Recent Note - 9/24/2010 4:01:48 PM
G - Gapped up today and posted a gain with below average volume for another new all-time high. Extended from any sound base after a recent streak of gains, its prior high in the $46 area defines support to watch.
>>> The latest Featured Stock Update with an annotated graph appeared on 8/11/2010. Click here.
View all notes |
Alert me of new notes |
CANSLIM.net Company Profile |
SEC |
Zacks Reports |
StockTalk |
News |
Chart |
Request a new note
C
A N
S L
I M
|
GMCR
-
NASDAQ
Green Mtn Coffee Roastrs
FOOD and BEVERAGE - Processed and Packaged Goods
|
$37.55
|
+1.33
3.67% |
$37.89
|
3,108,306
121.93% of 50 DAV
50 DAV is 2,549,200
|
$37.32
0.62%
|
8/17/2010
|
$33.62
|
PP = $33.30
|
|
MB = $34.97
|
Most Recent Note - 9/27/2010 1:28:17 PM
G - Gain today with lighter than average volume has it poised for a new high close. Extended from its prior base, its old resistance in the $33 area defines support to watch.
>>> The latest Featured Stock Update with an annotated graph appeared on 8/17/2010. Click here.
View all notes |
Alert me of new notes |
CANSLIM.net Company Profile |
SEC |
Zacks Reports |
StockTalk |
News |
Chart |
Request a new note
C
A N
S L
I M
|
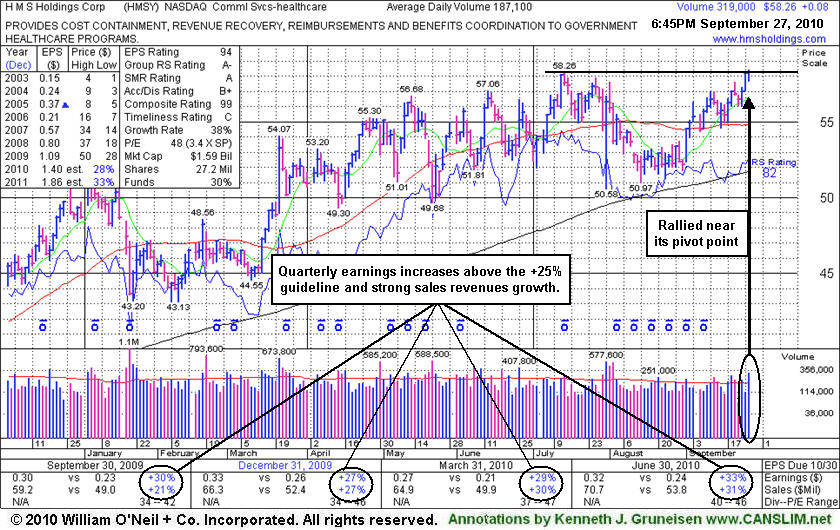
HMSY
-
NASDAQ
H M S Holdings Corp
COMPUTER SOFTWARE and SERVICES - Healthcare Information Service
|
$58.26
|
+0.08
0.14% |
$58.40
|
318,963
170.93% of 50 DAV
50 DAV is 186,600
|
$58.26
0.00%
|
9/27/2010
|
$57.97
|
PP = $58.36
|
|
MB = $61.28
|
Most Recent Note - 9/27/2010 12:56:39 PM
Y - Color code is changed to yellow with pivot point cited based on its 52-week high plus ten cents. Healthy action has continued since last noted in the mid-day report on 7/30/10 - "Patient investors may watch for an ideal new base pattern to form. This high-ranked Commercial Services - Healthcare firm has maintained a solid sales revenues and earnings growth history that still satisfies the C and A criteria, and it has rebounded impressively since it was dropped from the Featured Stocks list on 8/10/09."
>>> The latest Featured Stock Update with an annotated graph appeared on 9/27/2010. Click here.
View all notes |
Alert me of new notes |
CANSLIM.net Company Profile |
SEC |
Zacks Reports |
StockTalk |
News |
Chart |
Request a new note
C
A N
S L
I M
|
HS
-
NYSE
Healthspring Inc
HEALTH SERVICES - Health Care Plans
|
$25.88
|
+0.24
0.94% |
$26.01
|
726,125
101.27% of 50 DAV
50 DAV is 717,000
|
$26.28
-1.52%
|
8/27/2010
|
$19.91
|
PP = $19.75
|
|
MB = $20.74
|
Most Recent Note - 9/24/2010 12:40:41 PM
G - Hit a new 52-week high and all-time high with today's 6th consecutive gain. Support to watch is prior chart highs in the $19-20 area. Disciplined investors do not chase stocks that are extended from a sound base.
>>> The latest Featured Stock Update with an annotated graph appeared on 8/27/2010. Click here.
View all notes |
Alert me of new notes |
CANSLIM.net Company Profile |
SEC |
Zacks Reports |
StockTalk |
News |
Chart |
Request a new note
C
A N
S L
I M
|
Symbol/Exchange
Company Name
Industry Group |
PRICE |
CHANGE
(%Change) |
Day High |
Volume
(% DAV)
(% 50 day avg vol) |
52 Wk Hi
% From Hi |
Featured
Date |
Price
Featured |
Pivot Featured |
|
Max Buy |
IGTE
-
NASDAQ
Igate Corp
COMPUTER SOFTWARE and SERVICES - Information Technology Service
|
$18.86
|
+0.29
1.56% |
$19.10
|
424,579
99.85% of 50 DAV
50 DAV is 425,200
|
$19.45
-3.03%
|
9/8/2010
|
$17.29
|
PP = $18.26
|
|
MB = $19.17
|
Most Recent Note - 9/24/2010 12:04:08 PM
Y - Gapped up today following the latest sign of more distributional pressure, but concerns are raised by its lack of meaningful price progress above prior highs in the past 2 weeks while volume totals have been above average .
>>> The latest Featured Stock Update with an annotated graph appeared on 9/10/2010. Click here.
View all notes |
Alert me of new notes |
CANSLIM.net Company Profile |
SEC |
Zacks Reports |
StockTalk |
News |
Chart |
Request a new note
C
A N
S L
I M
|
JOBS
-
NASDAQ
Fifty One Job Inc Ads
DIVERSIFIED SERVICES - Staffing and; Outsourcing Service
|
$38.26
|
-0.06
-0.16% |
$39.00
|
138,726
103.22% of 50 DAV
50 DAV is 134,400
|
$39.19
-2.37%
|
9/16/2010
|
$31.59
|
PP = $30.40
|
|
MB = $31.92
|
Most Recent Note - 9/24/2010 12:41:59 PM
G - Hit another new 52-week high today. Very extended from a sound base, its prior highs in the $30 area define chart support now.
>>> The latest Featured Stock Update with an annotated graph appeared on 9/16/2010. Click here.
View all notes |
Alert me of new notes |
CANSLIM.net Company Profile |
SEC |
Zacks Reports |
StockTalk |
News |
Chart |
Request a new note
C
A N
S L
I M
|
MELI
-
NASDAQ
Mercadolibre Inc
INTERNET - Internet Software and; Services
|
$74.98
|
+3.08
4.28% |
$76.75
|
1,419,676
173.60% of 50 DAV
50 DAV is 817,800
|
$74.78
0.27%
|
5/13/2010
|
$54.21
|
PP = $55.85
|
|
MB = $58.64
|
Most Recent Note - 9/27/2010 1:01:46 PM
G - Considerable gain today with the heaviest volume total in a month, getting even more extended from a sound base. Its 50 DMA line defines important chart support.
>>> The latest Featured Stock Update with an annotated graph appeared on 8/26/2010. Click here.
View all notes |
Alert me of new notes |
CANSLIM.net Company Profile |
SEC |
Zacks Reports |
StockTalk |
News |
Chart |
Request a new note
C
A N
S L
I M
|
MRX
-
NYSE
Medicis Pharmaceut Cl A
DRUGS - Biotechnology
|
$29.91
|
-0.15
-0.50% |
$30.21
|
1,150,831
95.65% of 50 DAV
50 DAV is 1,203,200
|
$30.29
-1.25%
|
8/12/2010
|
$26.88
|
PP = $26.71
|
|
MB = $28.05
|
Most Recent Note - 9/24/2010 4:21:45 PM
G - Hovering near its 2010 high with volume totals cooling the past few sessions. Prior highs in the $28 area define the initial chart support level to watch.
>>> The latest Featured Stock Update with an annotated graph appeared on 8/12/2010. Click here.
View all notes |
Alert me of new notes |
CANSLIM.net Company Profile |
SEC |
Zacks Reports |
StockTalk |
News |
Chart |
Request a new note
C
A N
S L
I M
|
MWIV
-
NASDAQ
M W I Veterinary Supply
HEALTH SERVICES - Medical Instruments and; Supplies
|
$56.82
|
-0.55
-0.96% |
$57.55
|
34,192
45.96% of 50 DAV
50 DAV is 74,400
|
$57.99
-2.02%
|
7/29/2010
|
$52.05
|
PP = $52.09
|
|
MB = $54.69
|
Most Recent Note - 9/24/2010 4:10:12 PM
G - Gain today on light volume, and no overhead supply remains to act as resistance. Its 50 DMA line defines important chart support.
>>> The latest Featured Stock Update with an annotated graph appeared on 9/7/2010. Click here.
View all notes |
Alert me of new notes |
CANSLIM.net Company Profile |
SEC |
Zacks Reports |
StockTalk |
News |
Chart |
Request a new note
C
A N
S L
I M
|
Symbol/Exchange
Company Name
Industry Group |
PRICE |
CHANGE
(%Change) |
Day High |
Volume
(% DAV)
(% 50 day avg vol) |
52 Wk Hi
% From Hi |
Featured
Date |
Price
Featured |
Pivot Featured |
|
Max Buy |
NEM
-
NYSE
Newmont Mining Corp
METALS and MINING - Gold
|
$62.65
|
-0.75
-1.18% |
$63.88
|
4,865,341
76.73% of 50 DAV
50 DAV is 6,340,600
|
$65.50
-4.35%
|
8/31/2010
|
$61.32
|
PP = $63.48
|
|
MB = $66.65
|
Most Recent Note - 9/27/2010 5:42:58 PM
Y - Down today for a 3rd consecutive loss on lighter volume, slumping below its pivot point. Technically the latest breakout was near the minimum volume guideline for a proper buy signal. No overhead supply remains to hinder its progress. Leadership in the Mining - Gold/Silver/Gems group (L criteria) is a nice reassurance.
>>> The latest Featured Stock Update with an annotated graph appeared on 9/14/2010. Click here.
View all notes |
Alert me of new notes |
CANSLIM.net Company Profile |
SEC |
Zacks Reports |
StockTalk |
News |
Chart |
Request a new note
C
A N
S L
I M
|
NEOG
-
NASDAQ
Neogen Corp
DRUGS - Diagnostic Substances
|
$33.85
|
+0.58
1.74% |
$33.87
|
75,965
72.62% of 50 DAV
50 DAV is 104,600
|
$33.66
0.56%
|
9/1/2010
|
$30.79
|
PP = $30.49
|
|
MB = $32.01
|
Most Recent Note - 9/24/2010 4:07:24 PM
G- Posted a solid gain today with average volume for its best close ever. Prior highs in the $30 area define initial support to watch.
>>> The latest Featured Stock Update with an annotated graph appeared on 8/20/2010. Click here.
View all notes |
Alert me of new notes |
CANSLIM.net Company Profile |
SEC |
Zacks Reports |
StockTalk |
News |
Chart |
Request a new note
C
A N
S L
I M
|
NFLX
-
NASDAQ
Netflix Inc
SPECIALTY RETAIL - Music and Video Stores
|
$164.99
|
+2.78
1.71% |
$166.16
|
5,956,459
114.28% of 50 DAV
50 DAV is 5,212,300
|
$167.12
-1.27%
|
8/10/2010
|
$124.05
|
PP = $124.00
|
|
MB = $130.20
|
Most Recent Note - 9/24/2010 12:51:50 PM
G - Gapped up again today, hitting new all-time highs, getting more extended from a sound base. Prior highs define important support to watch along with an upward trendline that comes into play well above its 50 DMA line.
>>> The latest Featured Stock Update with an annotated graph appeared on 8/10/2010. Click here.
View all notes |
Alert me of new notes |
CANSLIM.net Company Profile |
SEC |
Zacks Reports |
StockTalk |
News |
Chart |
Request a new note
C
A N
S L
I M
|
NTAP
-
NASDAQ
Netapp Inc
COMPUTER HARDWARE - Data Storage Devices
|
$49.39
|
-1.00
-1.98% |
$50.29
|
5,228,253
65.74% of 50 DAV
50 DAV is 7,952,900
|
$50.89
-2.95%
|
9/8/2010
|
$46.98
|
PP = $44.99
|
|
MB = $47.24
|
Most Recent Note - 9/27/2010 5:31:55 PM
G - Down today on lighter volume, extended from a sound base. Support to watch is at prior chart highs near its latest pivot point.
>>> The latest Featured Stock Update with an annotated graph appeared on 9/8/2010. Click here.
View all notes |
Alert me of new notes |
CANSLIM.net Company Profile |
SEC |
Zacks Reports |
StockTalk |
News |
Chart |
Request a new note
C
A N
S L
I M
|
ORCL
-
NASDAQ
Oracle Corp
COMPUTER SOFTWARE and SERVICES - Application Software
|
$26.95
|
-0.01
-0.04% |
$27.12
|
34,140,471
97.62% of 50 DAV
50 DAV is 34,974,100
|
$27.57
-2.25%
|
9/20/2010
|
$27.32
|
PP = $26.73
|
|
MB = $28.07
|
Most Recent Note - 9/27/2010 5:45:16 PM
Y - Holding its ground in a tight trading range since its "breakaway gap" on 9/17/10 backed by 5 times average volume.
>>> The latest Featured Stock Update with an annotated graph appeared on 9/20/2010. Click here.
View all notes |
Alert me of new notes |
CANSLIM.net Company Profile |
SEC |
Zacks Reports |
StockTalk |
News |
Chart |
Request a new note
C
A N
S L
I M
|
Symbol/Exchange
Company Name
Industry Group |
PRICE |
CHANGE
(%Change) |
Day High |
Volume
(% DAV)
(% 50 day avg vol) |
52 Wk Hi
% From Hi |
Featured
Date |
Price
Featured |
Pivot Featured |
|
Max Buy |
PAY
-
NYSE
Verifone Systems Inc
COMPUTER HARDWARE - Transaction Automation Systems
|
$28.62
|
-0.12
-0.42% |
$28.94
|
633,981
46.93% of 50 DAV
50 DAV is 1,351,000
|
$29.54
-3.12%
|
8/25/2010
|
$24.30
|
PP = $23.74
|
|
MB = $24.93
|
Most Recent Note - 9/24/2010 4:03:18 PM
G - Gapped up today for a solid gain with average volume. Extended from a sound base, its prior highs in the $23 area define chart support.
>>> The latest Featured Stock Update with an annotated graph appeared on 8/30/2010. Click here.
View all notes |
Alert me of new notes |
CANSLIM.net Company Profile |
SEC |
Zacks Reports |
StockTalk |
News |
Chart |
Request a new note
C
A N
S L
I M
|
PRGO
-
NASDAQ
Perrigo Co
DRUGS - Drug Related Products
|
$65.85
|
-0.79
-1.19% |
$66.97
|
1,035,177
97.55% of 50 DAV
50 DAV is 1,061,200
|
$67.49
-2.43%
|
9/15/2010
|
$63.73
|
PP = $64.76
|
|
MB = $68.00
|
Most Recent Note - 9/27/2010 5:54:05 PM
Y - Pulled back today on lighter volume. Its 9/24/10 gap up gain with +50% above average volume for a new 52-week high triggered a technical buy signal with volume near the minimum guideline. It was first featured in the 9/15/10 mid-day report.
>>> The latest Featured Stock Update with an annotated graph appeared on 9/15/2010. Click here.
View all notes |
Alert me of new notes |
CANSLIM.net Company Profile |
SEC |
Zacks Reports |
StockTalk |
News |
Chart |
Request a new note
C
A N
S L
I M
|
RAX
-
NYSE
Rackspace Hosting Inc
INTERNET - Internet Software and; Services
|
$24.34
|
-0.12
-0.49% |
$24.70
|
1,442,362
80.89% of 50 DAV
50 DAV is 1,783,100
|
$24.63
-1.18%
|
9/21/2010
|
$22.84
|
PP = $23.61
|
|
MB = $24.79
|
Most Recent Note - 9/24/2010 11:53:11 AM
Y - Gapped up today and hit a new 52-week high, with no overhead supply remaining to hinder its progress. This high-ranked Internet-Networking Solutions firm has earned very high ranks, and 3 of the past 4 quarterly earnings comparisons showed better than +25% increases. Its annual earnings history (A criteria) since trading began in 2008 has been good.
>>> The latest Featured Stock Update with an annotated graph appeared on 9/21/2010. Click here.
View all notes |
Alert me of new notes |
CANSLIM.net Company Profile |
SEC |
Zacks Reports |
StockTalk |
News |
Chart |
Request a new note
C
A N
S L
I M
|
ROVI
-
NASDAQ
Rovi Corp
COMPUTER SOFTWARE andamp; SERVICES - Security Software andamp; Services
|
$50.72
|
+1.91
3.91% |
$51.20
|
3,480,509
266.87% of 50 DAV
50 DAV is 1,304,200
|
$48.86
3.81%
|
8/31/2010
|
$43.31
|
PP = $45.06
|
|
MB = $47.31
|
Most Recent Note - 9/27/2010 1:08:00 PM
G - Hitting another new 52-week high today, adding to the recent streak of big gains on above average volume and getting more extended from its latest base. Prior highs in the $45 area define support to watch now.
>>> The latest Featured Stock Update with an annotated graph appeared on 8/24/2010. Click here.
View all notes |
Alert me of new notes |
CANSLIM.net Company Profile |
SEC |
Zacks Reports |
StockTalk |
News |
Chart |
Request a new note
C
A N
S L
I M
|
SHOO
-
NASDAQ
Steven Madden Limited
CONSUMER NON-DURABLES - Textile - Apparel Footwear
|
$39.48
|
-0.09
-0.23% |
$39.74
|
227,233
51.74% of 50 DAV
50 DAV is 439,200
|
$40.98
-3.66%
|
9/15/2010
|
$38.94
|
PP = $40.27
|
|
MB = $42.28
|
Most Recent Note - 9/24/2010 3:56:19 PM
Y - Gapped up today for a gain, yet volume is light for the session as it is heading for a close near its August highs and about -4% from its 52-week high.
>>> The latest Featured Stock Update with an annotated graph appeared on 8/5/2010. Click here.
View all notes |
Alert me of new notes |
CANSLIM.net Company Profile |
SEC |
Zacks Reports |
StockTalk |
News |
Chart |
Request a new note
C
A N
S L
I M
|
Symbol/Exchange
Company Name
Industry Group |
PRICE |
CHANGE
(%Change) |
Day High |
Volume
(% DAV)
(% 50 day avg vol) |
52 Wk Hi
% From Hi |
Featured
Date |
Price
Featured |
Pivot Featured |
|
Max Buy |
SLW
-
NYSE
Silver Wheaton Corp
METALS and; MINING - Silver
|
$26.54
|
-0.06
-0.23% |
$26.95
|
5,737,255
114.18% of 50 DAV
50 DAV is 5,024,600
|
$27.04
-1.85%
|
8/25/2010
|
$21.40
|
PP = $21.99
|
|
MB = $23.09
|
Most Recent Note - 9/24/2010 12:55:21 PM
G - Today's 5th consecutive gain for another new all-time high has it more extended from a sound base. Prior highs in the $21 area define chart support to watch.
>>> The latest Featured Stock Update with an annotated graph appeared on 8/25/2010. Click here.
View all notes |
Alert me of new notes |
CANSLIM.net Company Profile |
SEC |
Zacks Reports |
StockTalk |
News |
Chart |
Request a new note
C
A N
S L
I M
|
SVR
-
NYSE
Syniverse Holdings Inc
TELECOMMUNICATIONS - Diversified Communication Serv
|
$23.90
|
-0.25
-1.04% |
$24.24
|
572,627
84.40% of 50 DAV
50 DAV is 678,500
|
$24.19
-1.20%
|
9/22/2010
|
$23.60
|
PP = $23.87
|
|
MB = $25.06
|
Most Recent Note - 9/27/2010 1:38:58 PM
Y - Pulling back today on lighter volume, trading near its pivot point. A considerable gap up gain on 9/24/10 with +64% above average volume helped it hit a new 52-week high, technically triggering a buy signal 2 days after it was first featured in yellow in the mid-day report. Price gaps on charts are often noteworthy signs indicative of institutional positioning.
>>> The latest Featured Stock Update with an annotated graph appeared on 9/22/2010. Click here.
View all notes |
Alert me of new notes |
CANSLIM.net Company Profile |
SEC |
Zacks Reports |
StockTalk |
News |
Chart |
Request a new note
C
A N
S L
I M
|
UA
-
NYSE
Under Armour Inc Cl A
CONSUMER NON-DURABLES - Textile - Apparel Clothing
|
$45.22
|
+0.30
0.67% |
$45.63
|
367,698
48.63% of 50 DAV
50 DAV is 756,100
|
$46.10
-1.91%
|
9/9/2010
|
$39.99
|
PP = $40.10
|
|
MB = $42.11
|
Most Recent Note - 9/22/2010 2:47:52 PM
G - Pulling back on lighter volume, it is extended from its latest sound base pattern following a streak of 14 consecutive gains.
>>> The latest Featured Stock Update with an annotated graph appeared on 9/9/2010. Click here.
View all notes |
Alert me of new notes |
CANSLIM.net Company Profile |
SEC |
Zacks Reports |
StockTalk |
News |
Chart |
Request a new note
C
A N
S L
I M
|
UFPT
-
NASDAQ
U F P Tech Inc
CONSUMER NON-DURABLES - Packaging and Containers
|
$11.00
|
-0.21
-1.87% |
$11.35
|
54,476
129.09% of 50 DAV
50 DAV is 42,200
|
$11.85
-7.17%
|
9/16/2010
|
$11.20
|
PP = $11.69
|
|
MB = $12.27
|
Most Recent Note - 9/27/2010 5:47:23 PM
Y - Closed at the session low with a loss today on slightly above average volume. Recently enduring distributional pressure near its 52-week high and pivot point. No resistance remains due to overhead supply, and with only 6.21 million shares outstanding (S criteria) any institutional buying or selling can lead to greater price volatility.
>>> The latest Featured Stock Update with an annotated graph appeared on 9/17/2010. Click here.
View all notes |
Alert me of new notes |
CANSLIM.net Company Profile |
SEC |
Zacks Reports |
StockTalk |
News |
Chart |
Request a new note
C
A N
S L
I M
|
ULTA
-
NASDAQ
Ulta Salon Cosm & Frag
SPECIALTY RETAIL - Specialty Retail, Other
|
$28.64
|
-0.29
-1.00% |
$29.16
|
385,647
62.77% of 50 DAV
50 DAV is 614,400
|
$29.47
-2.82%
|
9/3/2010
|
$26.36
|
PP = $25.89
|
|
MB = $27.18
|
Most Recent Note - 9/24/2010 3:59:00 PM
G - Small gap up gain today on light volume, rallying near its best close of the year. Prior highs in the $26 area define support to watch now.
>>> The latest Featured Stock Update with an annotated graph appeared on 9/3/2010. Click here.
View all notes |
Alert me of new notes |
CANSLIM.net Company Profile |
SEC |
Zacks Reports |
StockTalk |
News |
Chart |
Request a new note
C
A N
S L
I M
|
Symbol/Exchange
Company Name
Industry Group |
PRICE |
CHANGE
(%Change) |
Day High |
Volume
(% DAV)
(% 50 day avg vol) |
52 Wk Hi
% From Hi |
Featured
Date |
Price
Featured |
Pivot Featured |
|
Max Buy |
VIT
-
NYSE
Vanceinfo Tech Inc Ads
COMPUTER SOFTWARE and SERVICES - Business Software and Services
|
$32.38
|
-0.16
-0.49% |
$32.97
|
1,233,267
222.73% of 50 DAV
50 DAV is 553,700
|
$32.97
-1.79%
|
7/8/2010
|
$25.20
|
PP = $26.58
|
|
MB = $27.91
|
Most Recent Note - 9/27/2010 1:14:32 PM
G - Holding its ground at its all-time high, extended from a prior resistance level in the $26 area. Its 50 DMA line defines chart support to watch.
>>> The latest Featured Stock Update with an annotated graph appeared on 8/31/2010. Click here.
View all notes |
Alert me of new notes |
CANSLIM.net Company Profile |
SEC |
Zacks Reports |
StockTalk |
News |
Chart |
Request a new note
C
A N
S L
I M
|
WCRX
-
NASDAQ
Warner Chilcott Plc
DRUGS - Drug Manufacturers - Other
|
$22.50
|
-0.10
-0.44% |
$22.84
|
2,874,572
118.13% of 50 DAV
50 DAV is 2,433,400
|
$23.53
-4.38%
|
8/23/2010
|
$21.04
|
PP = $20.84
|
|
MB = $21.88
|
Most Recent Note - 9/27/2010 5:37:20 PM
G - Enduring mild distributional pressure, it is extended from its latest base. Prior highs define chart support in the $20-21 area.
>>> The latest Featured Stock Update with an annotated graph appeared on 8/23/2010. Click here.
View all notes |
Alert me of new notes |
CANSLIM.net Company Profile |
SEC |
Zacks Reports |
StockTalk |
News |
Chart |
Request a new note
C
A N
S L
I M
|