You are not logged in.
This means you
CAN ONLY VIEW reports that were published prior to Monday, February 26, 2024.
You
MUST UPGRADE YOUR MEMBERSHIP if you want to see any current reports.
AFTER MARKET UPDATE - FRIDAY, SEPTEMBER 25TH, 2020
Previous After Market Report Next After Market Report >>>
|
|
|
|
DOW |
+358.52 |
27,173.96 |
+1.34% |
|
Volume |
800,219,539 |
-14% |
|
Volume |
3,738,037,400 |
-8% |
|
NASDAQ |
+240.83 |
10,913.09 |
+2.26% |
|
Advancers |
2,138 |
72% |
|
Advancers |
2,378 |
72% |
|
S&P 500 |
+51.87 |
3,298.46 |
+1.60% |
|
Decliners |
831 |
28% |
|
Decliners |
935 |
28% |
|
Russell 2000 |
+23.09 |
1,474.91 |
+1.59% |
|
52 Wk Highs |
16 |
|
|
52 Wk Highs |
32 |
|
|
S&P 600 |
+8.13 |
834.93 |
+0.98% |
|
52 Wk Lows |
25 |
|
|
52 Wk Lows |
45 |
|
|
The major indices have shown worrisome action indicative of a market correction and leadership has been very thin. Weakness in stocks prompts disciplined investors on a case-by-case basis to reduce market exposure and raise cash.
|
 |
Major Indices Rose With Lighter Volume Totals Again
Kenneth J. Gruneisen - Passed the CAN SLIM® Master's Exam
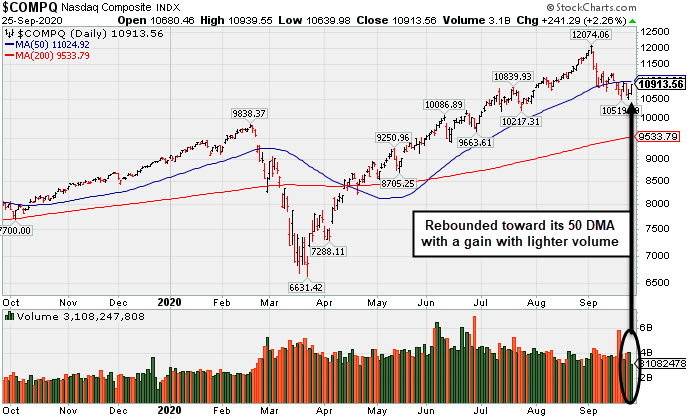
The Nasdaq Composite rose 2.3%, to end the week higher by 1.1%. Meanwhile, the Dow rose 358 points, while the S&P 500 advanced 1.6%. Despite the broad based gains, the S&P 500 and Dow finished the five day stretch lower by 1.8% and 0.6%, respectively, marking the fourth consecutive week of declines. The reported volume totals were lighter than the prior session totals on the NYSE and on the Nasdaq exchange, again revealing lackluster institutional buying demand. Breadth was positive as advancers led decliners by more than a 2-1 margin on the NYSE and on the Nasdaq exchange. However, leadership remained thin as there was only 1 high-ranked company from the Leaders List that hit a new 52-week high and was listed on the BreakOuts Page, versus the total of 2 on the prior session. New 52-week lows outnumbered new highs totals on the NYSE and on the Nasdaq exchange. The major indices have been showing action indicative of a market correction (M criteria). In weak markets it is considered critical to reduce exposure and sell faltering stocks on a case-by-case basis.
PICTURED: The Nasdaq Composite Index posted a gain with lighter volume, rebounding back toward its 50-day moving average (DMA) line.
Stocks broke out to the upside Friday, as Wall Street attributed today’s strength to investors “buying the dip” and outperformance in Technology stocks. Ten of 11 S&P 500 sectors ended the day in positive territory with the Energy group bucking the uptrend. Shares of Technology companies paced the gains, as Apple (AAPL +3.76%) and Microsoft (MSFT +2.28%), respectively. In corporate news, Novavax (NVAX +10.86%) rose after announcing a late-stage trial in the U.K. for its coronavirus vaccine candidate. Costco (COST -1.27%) fell after high costs related to the pandemic overshadowed an earnings beat. Elsewhere, shares of Norwegian Cruise Lines (NCLH +13.67%) and Carnival Corporation (CCL +9.68%) both rallied after being subject of a Wall Street analyst’s upgrade.
Concerns over resurging coronavirus cases remained a market overhang, while expectations for a near-term breakthrough on a fifth fiscal stimulus measure remain low, as a roughly $1 trillion gap remains between the Democratic and Republican proposals. On the data front, non-defense capital goods orders excluding aircrafts, which acts as a proxy for business spending, came in better than anticipated. Treasuries strengthened, with the yield on the 10-year note dipping one basis point to 0.65%. In FOREX trading, a gauge of the U.S. dollar extended its recent advance, notching its best week since April. |
 Kenneth J. Gruneisen started out as a licensed stockbroker in August 1987, a couple of months prior to the historic stock market crash that took the Dow Jones Industrial Average down -22.6% in a single day. He has published daily fact-based fundamental and technical analysis on high-ranked stocks online for two decades. Through FACTBASEDINVESTING.COM, Kenneth provides educational articles, news, market commentary, and other information regarding proven investment systems that work in good times and bad.
Comments contained in the body of this report are technical opinions only and are not necessarily those of Gruneisen Growth Corp. The material herein has been obtained from sources believed to be reliable and accurate, however, its accuracy and completeness cannot be guaranteed. Our firm, employees, and customers may effect transactions, including transactions contrary to any recommendation herein, or have positions in the securities mentioned herein or options with respect thereto. Any recommendation contained in this report may not be suitable for all investors and it is not to be deemed an offer or solicitation on our part with respect to the purchase or sale of any securities. |
|
 |
Retail, Financial, and Tech Indexes Rose
Kenneth J. Gruneisen - Passed the CAN SLIM® Master's Exam
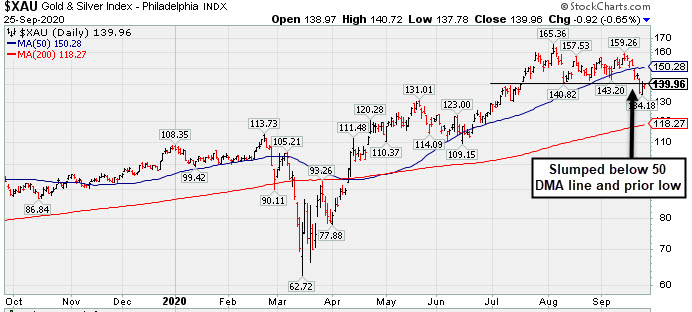
The Retail Index ($RLX +1.85%) and financial indexes helped give the major indices a boost as the Broker/Dealer Index ($XBD +1.23%) and Bank Index ($BKX +1.42%) each notched solid gains. The Biotech Index ($BTK +1.82%) led the tech sector higher while the Semiconductor Index ($SOX +1.41%) and Networking Index ($NWX +0.81%) also rose. Meanwhile, commodity-linked groups had a negative bias as the Oil Services Index ($OSX -1.98%), Integrated Oil Index ($XOI -0.26%), and the Gold & Silver Index ($XAU -0.66%) each lost ground.
PICTURED: The Gold & Silver Index ($XAU -0.66%) recently slumped below its 50-day moving average (DMA) line and prior low.
| Oil Services |
$OSX |
28.07 |
-0.57 |
-1.98% |
-64.14% |
| Integrated Oil |
$XOI |
613.05 |
-1.61 |
-0.26% |
-51.75% |
| Semiconductor |
$SOX |
2,177.75 |
+30.33 |
+1.41% |
+17.74% |
| Networking |
$NWX |
520.59 |
+4.17 |
+0.81% |
-10.77% |
| Broker/Dealer |
$XBD |
271.77 |
+3.30 |
+1.23% |
-6.41% |
| Retail |
$RLX |
3,329.04 |
+60.38 |
+1.85% |
+35.92% |
| Gold & Silver |
$XAU |
139.95 |
-0.93 |
-0.66% |
+30.89% |
| Bank |
$BKX |
71.08 |
+0.99 |
+1.42% |
-37.30% |
| Biotech |
$BTK |
5,293.50 |
+94.39 |
+1.82% |
+4.46% |
|
|
|
 |
Gain Back Above "Max Buy" Level for ServiceNow
Kenneth J. Gruneisen - Passed the CAN SLIM® Master's Exam
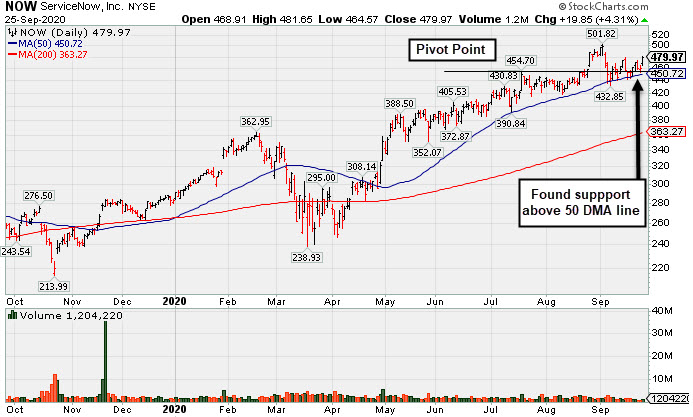
ServiceNow Inc (NOW +$19.85 or +4.31% to $479.97) posted a big gain with below average volume, rallying back above its "max buy" level, and its color code was changed to green. Volume totals have generally been cooling while showing resilience and finding support above its 50-day moving average (DMA) line ($450.72). Any damaging losses below the 50 DMA line and prior low ($432.85 on 9/08/20) may raise concerns and trigger a technical sell signal.
Fundamentals remain strong. Recently it reported Jun '20 quarterly earnings +73% on +28% sales revenues versus the year ago period. Results have been routinely above the +25% minimum earnings guideline (C criteria). It has an Earnings Per Share Rating of 99. The Computer Software - Enterprise group has a Group Relative Strength Rating of 90, a reassuring sign concerning the L criteria. NOW has a new CEO as of 1/01/20.
NOW has traded up as much as +46.28% since first highlighted in yellow in the 4/30/20 mid-day report with a pivot point based on its 2/19/20 high plus 10 cents (read here). It was last shown in this FSU section on 9/14/20 with an annotated graph under the headline, "Tested Support at 50-Day Moving Average Line". The number of top-rated funds owning its shares rose from 1,030 in Jun '17 to 2.295 in Jun '20, a reassuring sign concerning the I criteria. It has a Timeliness Rating of A and a Sponsorship Rating of A. Its current Up/Down Volume Ratio of 0.9 is an unbiased indication its shares have been under slight distributional pressure over the past 50 days. |
|
|
Color Codes Explained :
Y - Better candidates highlighted by our
staff of experts.
G - Previously featured
in past reports as yellow but may no longer be buyable under the
guidelines.
***Last / Change / Volume data in this table is the closing quote data***
Symbol/Exchange
Company Name
Industry Group |
PRICE |
CHANGE
(%Change) |
Day High |
Volume
(% DAV)
(% 50 day avg vol) |
52 Wk Hi
% From Hi |
Featured
Date |
Price
Featured |
Pivot Featured |
|
Max Buy |
 ADBE
-
NASDAQ
ADBE
-
NASDAQ
Adobe Inc
COMPUTER SOFTWARE and SERVICES - Application Software
|
$479.78
|
+12.11
2.59% |
$481.58
|
2,462,793
80.59% of 50 DAV
50 DAV is 3,056,000
|
$536.88
-10.64%
|
9/10/2020
|
$488.46
|
PP = $536.88
|
|
MB = $563.72
|
Most Recent Note - 9/23/2020 5:36:36 PM
G - Fell back toward its 50 DMA line ($466) with today's loss on below average volume. Disciplined investors always limit losses by selling any stock that falls more than 7-8% from their purchase price. Reported Aug '20 quarterly earnings +25% on +14% sales revenues versus the year ago period. See the latest FSU analysis for more details and a new annotated graph.
>>> FEATURED STOCK ARTICLE : Light Volume Loss Falling Near 50-Day Moving Average Line Again - 9/23/2020 |
View all notes |
Set NEW NOTE alert |
Company Profile |
SEC
News |
Chart |
Request a new note
C
A
S
I |
CRL
-
NYSE
Charles River Labs Intl
DRUGS - Biotechnology
|
$216.77
|
+4.94
2.33% |
$217.58
|
180,066
55.40% of 50 DAV
50 DAV is 325,000
|
$228.86
-5.28%
|
7/15/2020
|
$192.66
|
PP = $189.95
|
|
MB = $199.45
|
Most Recent Note - 9/24/2020 6:56:14 PM
G - Pulled back for a 4th consecutive loss today with below average volume but showed resilience after undercutting its 50 DMA line ($211.28) which recently acted as support. More damaging losses would raise greater concerns and trigger a technical sell signal. Raised fundamental concerns when it recently reported Jun '20 quarterly earnings -3% on +4% sales revenues, below the +25% minimum guideline (C criteria). See the latest FSU analysis for more details and a new annotated graph.
>>> FEATURED STOCK ARTICLE : Showed Resilience When Testing 50-Day Moving Average Line Again - 9/24/2020 |
View all notes |
Set NEW NOTE alert |
Company Profile |
SEC
News |
Chart |
Request a new note
C
A
S
I |
AMD
-
NASDAQ
Advanced Micro Devices
ELECTRONICS - Semiconductor - Broad Line
|
$78.06
|
+2.24
2.95% |
$78.20
|
48,109,349
73.44% of 50 DAV
50 DAV is 65,512,000
|
$94.28
-17.21%
|
8/31/2020
|
$90.42
|
PP = $87.39
|
|
MB = $91.76
|
Most Recent Note - 9/23/2020 5:47:50 PM
G - Slumped below its 50 DMA line ($77.38) with today's loss on lighter volume. More damaging losses below the recent low ($73.85 on 9/18/20) would raise greater concerns and trigger a more worrisome technical sell signal. Faces near-term resistance due to overhead supply up to the $94 level. Fundamentals remain strong.
>>> FEATURED STOCK ARTICLE : Found Support Above 50 DMA Line After Negating Recent Breakout - 9/15/2020 |
View all notes |
Set NEW NOTE alert |
Company Profile |
SEC
News |
Chart |
Request a new note
C
A
S
I |
TREX
-
NYSE
Trex Company Inc
MATERIALS and CONSTRUCTION - General Building Materials
|
$68.50
|
+0.48
0.71% |
$69.34
|
428,477
41.52% of 50 DAV
50 DAV is 1,032,000
|
$78.32
-12.54%
|
6/26/2020
|
$54.53
|
PP = $66.47
|
|
MB = $69.79
|
Most Recent Note - 9/23/2020 5:52:26 PM
G - Reversed into the red after earlier gains today and closed near the session low. A rebound above its 50 DMA line ($70.18) is needed for its outlook to improve. More damaging losses would raise greater concerns. Do not be confused by the 2:1 share split effective 9/15/20 (Featured Price, Pivot Point, and Max Buy prices have been adjusted accordingly). Fundamentals remain strong.
>>> FEATURED STOCK ARTICLE : Slumped Below 50-Day Average With Loss on Light Volume - 9/17/2020 |
View all notes |
Set NEW NOTE alert |
Company Profile |
SEC
News |
Chart |
Request a new note
C
A
S
I |
NFLX
-
NASDAQ
Netflix Inc
SPECIALTY RETAIL - Music and Video Stores
|
$482.88
|
+9.80
2.07% |
$484.87
|
3,763,228
54.65% of 50 DAV
50 DAV is 6,886,000
|
$575.37
-16.07%
|
9/1/2020
|
$547.45
|
PP = $575.47
|
|
MB = $604.24
|
Most Recent Note - 9/23/2020 5:43:42 PM
G - Met resistance when rebounding toward its 50 DMA line ($497) and slumped again with light volume behind today's loss. The recent low ($458.60 on 9/18/20) defines important near term support where any further deterioration would raise more serious concerns. Subsequent gains back above the 50 DMA line are needed for its outlook to improve.
>>> FEATURED STOCK ARTICLE : Met Resistance at 50 DMA Line and Reversed Today - 9/16/2020 |
View all notes |
Set NEW NOTE alert |
Company Profile |
SEC
News |
Chart |
Request a new note
C
A
S
I |
Symbol/Exchange
Company Name
Industry Group |
PRICE |
CHANGE
(%Change) |
Day High |
Volume
(% DAV)
(% 50 day avg vol) |
52 Wk Hi
% From Hi |
Featured
Date |
Price
Featured |
Pivot Featured |
|
Max Buy |
LGIH
-
NASDAQ
L G I Homes Inc
Bldg-Resident/Comml
|
$107.89
|
-2.31
-2.10% |
$109.63
|
164,282
54.94% of 50 DAV
50 DAV is 299,000
|
$123.94
-12.95%
|
7/7/2020
|
$99.19
|
PP = $95.82
|
|
MB = $100.61
|
Most Recent Note - 9/24/2020 6:39:32 PM
G - Rebounded toward its 50 DMA line ($112.92) which may act as resistance, and subsequent gains above the 50 DMA line are needed for its outlook to improve. More damaging losses below the latest low ($101.30 on 9/21/20) would raise greater concerns and trigger a worrisome technical sell signal. Reported Jun '20 quarterly earnings +21% on +4% sales revenues, breaking a streak of 4 comparisons above the +25% minimum guideline (C criteria).
>>> FEATURED STOCK ARTICLE : Violation of 50-Day Average on Volume Triggered Technical Sell Signal - 9/18/2020 |
View all notes |
Set NEW NOTE alert |
Company Profile |
SEC
News |
Chart |
Request a new note
C
A
S
I |
NOW
-
NYSE
Servicenow Inc
Computer Sftwr-Enterprse
|
$479.97
|
+19.85
4.31% |
$481.65
|
1,205,618
73.51% of 50 DAV
50 DAV is 1,640,000
|
$501.82
-4.35%
|
8/20/2020
|
$453.34
|
PP = $454.79
|
|
MB = $477.53
|
 Most Recent Note - 9/25/2020 5:08:11 PM
G - Rose back above its "max" buy level today and its color code is changed to green. Found support above its 50 DMA line ($450.72). Fundamentals remain strong. More damaging losses below the 50 DMA line and prior low ($432.85 on 9/08/20) may raise concerns and trigger a technical sell signal. See the latest FSU analysis for more details and a new annotated graph.
>>> FEATURED STOCK ARTICLE : Gain Back Above "Max Buy" Level for ServiceNow - 9/25/2020 |
View all notes |
Set NEW NOTE alert |
Company Profile |
SEC
News |
Chart |
Request a new note
C
A
S
I |
|
|
|
THESE ARE NOT BUY RECOMMENDATIONS!
Comments contained in the body of this report are technical
opinions only. The material herein has been obtained
from sources believed to be reliable and accurate, however,
its accuracy and completeness cannot be guaranteed.
This site is not an investment advisor, hence it does
not endorse or recommend any securities or other investments.
Any recommendation contained in this report may not
be suitable for all investors and it is not to be deemed
an offer or solicitation on our part with respect to
the purchase or sale of any securities. All trademarks,
service marks and trade names appearing in this report
are the property of their respective owners, and are
likewise used for identification purposes only.
This report is a service available
only to active Paid Premium Members.
You may opt-out of receiving report notifications
at any time. Questions or comments may be submitted
by writing to Premium Membership Services 665 S.E. 10 Street, Suite 201 Deerfield Beach, FL 33441-5634 or by calling 1-800-965-8307
or 954-785-1121.
|
|
|