***Last / Change / Volume data in this table is the closing quote data***
Symbol/Exchange
Company Name
Industry Group |
PRICE |
CHANGE
(%Change) |
Day High |
Volume
(% DAV)
(% 50 day avg vol) |
52 Wk Hi
% From Hi |
Featured
Date |
Price
Featured |
Pivot Featured |
|
Max Buy |
ALXN
-
NASDAQ
Alexion Pharmaceuticals
DRUGS - Drug Manufacturers - Other
|
$113.90
|
+0.98
0.87% |
$116.43
|
1,279,275
108.27% of 50 DAV
50 DAV is 1,181,600
|
$114.96
-0.92%
|
8/23/2012
|
$103.70
|
PP = $110.06
|
|
MB = $115.56
|
 Most Recent Note - 9/25/2012 11:29:20 AM
G - Hitting a new 52 week high today. Color code is changed to green after rallying above its "max buy" level. Gains above its pivot point backed by +69% above average volume on 9/21/12 confirmed a technical buy signal.
>>> The latest Featured Stock Update with an annotated graph appeared on 8/23/2012. Click here.
View all notes |
Alert me of new notes |
CANSLIM.net Company Profile |
SEC |
Zacks Reports |
StockTalk |
News |
Chart |
Request a new note
C
A N
S L
I M


|
ASPS
-
NASDAQ
Altisource Ptf Sltns Sa
REAL ESTATE - Property Management/Developmen
|
$85.27
|
-1.97
-2.26% |
$87.19
|
176,671
140.22% of 50 DAV
50 DAV is 126,000
|
$92.29
-7.61%
|
9/24/2012
|
$87.24
|
PP = $92.39
|
|
MB = $97.01
|
Most Recent Note - 9/24/2012 4:23:58 PM
Y - Color code is changed to yellow with new pivot point cited based on its 8/20/12 high plus 10 cents. Volume-driven gains above its pivot point may trigger a new (or add-on) technical buy signal. Recent lows define near-term support along with its 50 DMA line.
>>> The latest Featured Stock Update with an annotated graph appeared on 9/11/2012. Click here.
View all notes |
Alert me of new notes |
CANSLIM.net Company Profile |
SEC |
Zacks Reports |
StockTalk |
News |
Chart |
Request a new note
C
A N
S L
I M
|
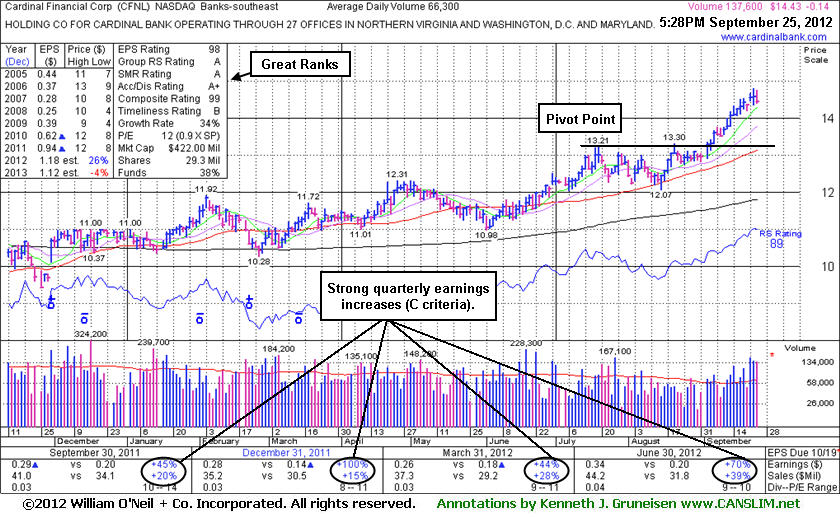
CFNL
-
NASDAQ
Cardinal Financial Corp
BANKING - Regional - Southeast Banks
|
$14.43
|
-0.15
-0.99% |
$14.75
|
139,593
210.55% of 50 DAV
50 DAV is 66,300
|
$14.79
-2.43%
|
8/17/2012
|
$12.84
|
PP = $13.31
|
|
MB = $13.98
|
Most Recent Note - 9/25/2012 11:56:59 AM
G - Trading near its 52-week high today, adding to its spurt of volume-driven gains and getting more extended from its prior base. Prior highs and its 50 DMA line define support to watch on pullbacks near the $13 level.
>>> The latest Featured Stock Update with an annotated graph appeared on 9/25/2012. Click here.
View all notes |
Alert me of new notes |
CANSLIM.net Company Profile |
SEC |
Zacks Reports |
StockTalk |
News |
Chart |
Request a new note
C
A N
S L
I M
|
CMCSA
-
NASDAQ
Comcast Corp Cl A
MEDIA - CATV Systems
|
$35.86
|
-0.58
-1.58% |
$36.90
|
17,236,104
136.19% of 50 DAV
50 DAV is 12,655,900
|
$36.54
-1.87%
|
6/11/2012
|
$29.94
|
PP = $30.98
|
|
MB = $32.53
|
Most Recent Note - 9/21/2012 6:04:19 PM
G - Today's 3rd consecutive gain with above average volume for a new 52-week high helped it rise from an orderly flat base. No new pivot point was cited because of fundamental concerns raised by sub par sales and earnings growth in the Jun '12 quarter. See the latest FSU analysis for more details and a new annotated graph.
>>> The latest Featured Stock Update with an annotated graph appeared on 9/21/2012. Click here.
View all notes |
Alert me of new notes |
CANSLIM.net Company Profile |
SEC |
Zacks Reports |
StockTalk |
News |
Chart |
Request a new note
C
A N
S L
I M
|
DVA
-
NYSE
Davita Inc
HEALTH SERVICES - Specialized Health Services
|
$100.30
|
-0.07
-0.07% |
$101.50
|
520,687
73.45% of 50 DAV
50 DAV is 708,900
|
$103.97
-3.53%
|
9/5/2012
|
$102.92
|
PP = $100.62
|
|
MB = $105.65
|
Most Recent Note - 9/21/2012 4:09:41 PM
Y - Considerable gain today and new high close above its pivot point was backed by more than 3 times average volume confirming a technical buy signal.
>>> The latest Featured Stock Update with an annotated graph appeared on 9/5/2012. Click here.
View all notes |
Alert me of new notes |
CANSLIM.net Company Profile |
SEC |
Zacks Reports |
StockTalk |
News |
Chart |
Request a new note
C
A N
S L
I M
|
Symbol/Exchange
Company Name
Industry Group |
PRICE |
CHANGE
(%Change) |
Day High |
Volume
(% DAV)
(% 50 day avg vol) |
52 Wk Hi
% From Hi |
Featured
Date |
Price
Featured |
Pivot Featured |
|
Max Buy |
ECPG
-
NASDAQ
Encore Capital Group Inc
FINANCIAL SERVICES - Credit Services
|
$28.35
|
-0.83
-2.84% |
$29.37
|
88,331
68.53% of 50 DAV
50 DAV is 128,900
|
$30.91
-8.28%
|
8/3/2012
|
$29.91
|
PP = $30.45
|
|
MB = $31.97
|
Most Recent Note - 9/24/2012 4:25:31 PM
Y - Slumping back into the prior base and near its 50 DMA line raising concerns. Disciplined investors always limit losses if ever a stock falls more than -7% from their purchase price.
>>> The latest Featured Stock Update with an annotated graph appeared on 9/12/2012. Click here.
View all notes |
Alert me of new notes |
CANSLIM.net Company Profile |
SEC |
Zacks Reports |
StockTalk |
News |
Chart |
Request a new note
C
A N
S L
I M
|
EXPE
-
NASDAQ
Expedia Inc
INTERNET - Internet Information Providers
|
$58.14
|
-0.42
-0.72% |
$59.00
|
2,406,387
71.97% of 50 DAV
50 DAV is 3,343,800
|
$60.29
-3.57%
|
4/27/2012
|
$41.80
|
PP = $35.57
|
|
MB = $37.35
|
Most Recent Note - 9/21/2012 4:04:25 PM
G - Gapped up today and hit a new 52-week high with a volume-driven gain. No overhead supply remains to hinder its progress,however weak industry group action and iffy fundamentals were noted in the latest FSU as causes for concern.
>>> The latest Featured Stock Update with an annotated graph appeared on 9/19/2012. Click here.
View all notes |
Alert me of new notes |
CANSLIM.net Company Profile |
SEC |
Zacks Reports |
StockTalk |
News |
Chart |
Request a new note
C
A N
S L
I M
|
GPX
-
NYSE
G P Strategies Corp
DIVERSIFIED SERVICES - Education and Training Services
|
$19.02
|
-0.36
-1.86% |
$19.60
|
43,530
60.21% of 50 DAV
50 DAV is 72,300
|
$20.67
-7.98%
|
6/29/2012
|
$18.01
|
PP = $18.15
|
|
MB = $19.06
|
Most Recent Note - 9/20/2012 5:54:45 PM
G - Still consolidating in a very tight trading range perched -4.8% off its 52-week high today with volume totals cooling. It may be forming a base-on-base pattern, meanwhile its prior highs and its 50 DMA line define chart support in the $18 area.
>>> The latest Featured Stock Update with an annotated graph appeared on 9/13/2012. Click here.
View all notes |
Alert me of new notes |
CANSLIM.net Company Profile |
SEC |
Zacks Reports |
StockTalk |
News |
Chart |
Request a new note
C
A N
S L
I M
|
KH
-
NYSE
China Kanghui Hldgs Ads
HEALTH SERVICES - Medical Appliances and Equipment
|
$24.42
|
-0.55
-2.20% |
$25.76
|
96,574
321.91% of 50 DAV
50 DAV is 30,000
|
$27.47
-11.10%
|
8/30/2012
|
$24.19
|
PP = $22.90
|
|
MB = $24.05
|
Most Recent Note - 9/24/2012 12:23:07 PM
G - Enduring distributional pressure while consolidating above prior highs defining chart support above its 50 DMA line. It is extended from its prior base.
>>> The latest Featured Stock Update with an annotated graph appeared on 8/30/2012. Click here.
View all notes |
Alert me of new notes |
CANSLIM.net Company Profile |
SEC |
Zacks Reports |
StockTalk |
News |
Chart |
Request a new note
C
A N
S L
I M
|
LKQ
-
NASDAQ
L K Q Corp
WHOLESALE - Auto Parts
|
$19.21
|
+0.21
1.08% |
$19.46
|
2,282,380
170.89% of 50 DAV
50 DAV is 1,335,600
|
$20.02
-4.05%
|
8/9/2012
|
$37.93
|
PP = $37.44
|
|
MB = $39.31
|
Most Recent Note - 9/19/2012 8:59:35 AM
Y - Do not be confused by a 2:1 share split effective before the market open today (Featured Price, Pivot Point and Max Buy will be adjusted soon to account for the split). Loss on the prior session with more than twice average volume indicated distributional pressure as it sank near prior highs and its 50 DMA line previously noted as important chart support to watch on pullbacks.
>>> The latest Featured Stock Update with an annotated graph appeared on 9/17/2012. Click here.
View all notes |
Alert me of new notes |
CANSLIM.net Company Profile |
SEC |
Zacks Reports |
StockTalk |
News |
Chart |
Request a new note
C
A N
S L
I M
|
Symbol/Exchange
Company Name
Industry Group |
PRICE |
CHANGE
(%Change) |
Day High |
Volume
(% DAV)
(% 50 day avg vol) |
52 Wk Hi
% From Hi |
Featured
Date |
Price
Featured |
Pivot Featured |
|
Max Buy |
LNKD
-
NYSE
Linkedin Corp Class A
INTERNET - Internet Information Providers
|
$119.89
|
-2.81
-2.29% |
$124.68
|
1,641,855
66.62% of 50 DAV
50 DAV is 2,464,500
|
$125.50
-4.47%
|
9/5/2012
|
$113.25
|
PP = $113.10
|
|
MB = $118.76
|
Most Recent Note - 9/21/2012 4:12:00 PM
G - Hovering near its 52-week and all-time highs after today's 4th consecutive small gain on below average volume. Prior highs near $113 define initial support to watch on pullbacks.
>>> The latest Featured Stock Update with an annotated graph appeared on 9/6/2012. Click here.
View all notes |
Alert me of new notes |
CANSLIM.net Company Profile |
SEC |
Zacks Reports |
StockTalk |
News |
Chart |
Request a new note
C
A N
S L
I M
|
MIDD
-
NASDAQ
Middleby Corp
MANUFACTURING - Diversified Machinery
|
$116.48
|
-0.72
-0.61% |
$120.47
|
58,318
56.84% of 50 DAV
50 DAV is 102,600
|
$122.57
-4.97%
|
8/9/2012
|
$118.60
|
PP = $104.92
|
|
MB = $110.17
|
Most Recent Note - 9/18/2012 5:25:56 PM
G - Perched -3.3% off its 52-week high today. Extended from its prior base, and its 50 DMA line and recent lows define near-term chart support to watch. See the latest FSU analysis for more details and a new annotated graph.
>>> The latest Featured Stock Update with an annotated graph appeared on 9/18/2012. Click here.
View all notes |
Alert me of new notes |
CANSLIM.net Company Profile |
SEC |
Zacks Reports |
StockTalk |
News |
Chart |
Request a new note
C
A N
S L
I M
|
N
-
NYSE
Netsuite Inc
DIVERSIFIED SERVICES - Business/Management Services
|
$60.94
|
-0.34
-0.55% |
$62.57
|
589,714
94.43% of 50 DAV
50 DAV is 624,500
|
$63.25
-3.65%
|
8/20/2012
|
$55.88
|
PP = $59.32
|
|
MB = $62.29
|
Most Recent Note - 9/24/2012 5:30:19 PM
Y - Pulled back today on light volume, finishing -3.1% off its 52-week high. Prior highs near $59 define initial support above its 50 DMA line. See the latest FSU analysis for more details and a new annotated graph.
>>> The latest Featured Stock Update with an annotated graph appeared on 9/24/2012. Click here.
View all notes |
Alert me of new notes |
CANSLIM.net Company Profile |
SEC |
Zacks Reports |
StockTalk |
News |
Chart |
Request a new note
C
A N
S L
I M
|
NSM
-
NYSE
Nationstar Mtg Hldgs Inc
FINANCIAL SERVICES - Credit Services
|
$33.02
|
+0.85
2.64% |
$34.90
|
2,547,602
284.30% of 50 DAV
50 DAV is 896,100
|
$32.64
1.16%
|
8/29/2012
|
$27.96
|
PP = $28.85
|
|
MB = $30.29
|
Most Recent Note - 9/25/2012 12:12:06 PM
G - Spiking to another new 52-week high today with its 7th consecutive gain, getting extended from its prior base. Disciplined investors avoid chasing stocks more than +5% above their pivot point.
>>> The latest Featured Stock Update with an annotated graph appeared on 9/7/2012. Click here.
View all notes |
Alert me of new notes |
CANSLIM.net Company Profile |
SEC |
Zacks Reports |
StockTalk |
News |
Chart |
Request a new note
C
A N
S L
I M
|
OSIS
-
NASDAQ
O S I Systems Inc
ELECTRONICS - Semiconductor Equipment and Mate
|
$75.71
|
-0.74
-0.97% |
$77.86
|
164,481
136.73% of 50 DAV
50 DAV is 120,300
|
$78.58
-3.65%
|
9/5/2012
|
$74.39
|
PP = $75.10
|
|
MB = $78.86
|
Most Recent Note - 9/24/2012 4:27:10 PM
Y - Loss today with above average volume broke a streak of 5 consecutive gains. Prior rally above its pivot point clinched a new (or add-on) technical buy signal, yet it has not risen beyond its "max buy" level. Near term support is at its 50 DMA line.
>>> The latest Featured Stock Update with an annotated graph appeared on 9/14/2012. Click here.
View all notes |
Alert me of new notes |
CANSLIM.net Company Profile |
SEC |
Zacks Reports |
StockTalk |
News |
Chart |
Request a new note
C
A N
S L
I M
|
Symbol/Exchange
Company Name
Industry Group |
PRICE |
CHANGE
(%Change) |
Day High |
Volume
(% DAV)
(% 50 day avg vol) |
52 Wk Hi
% From Hi |
Featured
Date |
Price
Featured |
Pivot Featured |
|
Max Buy |
RNF
-
NYSE
Rentech Nitrogen Ptnr Lp
CHEMICALS - Agricultural Chemicals
|
$39.29
|
-0.17
-0.43% |
$40.05
|
332,413
75.19% of 50 DAV
50 DAV is 442,100
|
$40.00
-1.78%
|
7/27/2012
|
$29.58
|
PP = $30.60
|
|
MB = $32.13
|
Most Recent Note - 9/24/2012 4:27:38 PM
G - Hit another new 52-week high today with above average volume behind its gain, getting more extended from its prior base. An upward trendline defines near-term chart support that comes into play above its 50 DMA line.
>>> The latest Featured Stock Update with an annotated graph appeared on 8/31/2012. Click here.
View all notes |
Alert me of new notes |
CANSLIM.net Company Profile |
SEC |
Zacks Reports |
StockTalk |
News |
Chart |
Request a new note
C
A N
S L
I M
|
SWI
-
NYSE
Solarwinds Inc
COMPUTER SOFTWARE and SERVICES - Application Software
|
$57.93
|
-1.09
-1.85% |
$59.79
|
627,501
58.50% of 50 DAV
50 DAV is 1,072,600
|
$60.95
-4.95%
|
7/25/2012
|
$47.82
|
PP = $47.89
|
|
MB = $50.28
|
Most Recent Note - 9/19/2012 6:21:05 PM
G - Volume totals have been cooling while still holding its ground near its all-time high. Its 50 DMA line defines important chart support to watch on pullbacks.
>>> The latest Featured Stock Update with an annotated graph appeared on 8/29/2012. Click here.
View all notes |
Alert me of new notes |
CANSLIM.net Company Profile |
SEC |
Zacks Reports |
StockTalk |
News |
Chart |
Request a new note
C
A N
S L
I M
|
TDG
-
NYSE
Transdigm Group Inc
AEROSPACE/DEFENSE - Aerospace/Defense Products and; Services
|
$144.95
|
+1.58
1.10% |
$146.22
|
1,162,500
316.67% of 50 DAV
50 DAV is 367,100
|
$146.72
-1.21%
|
8/16/2012
|
$132.23
|
PP = $136.44
|
|
MB = $143.26
|
Most Recent Note - 9/25/2012 12:17:05 PM
G - Trading up today with volume running at an above average pace, getting extended from its prior base. Its 50 DMA line defines support to watch on pullbacks.
>>> The latest Featured Stock Update with an annotated graph appeared on 9/20/2012. Click here.
View all notes |
Alert me of new notes |
CANSLIM.net Company Profile |
SEC |
Zacks Reports |
StockTalk |
News |
Chart |
Request a new note
C
A N
S L
I M
|
ULTA
-
NASDAQ
Ulta Salon Cosm & Frag
SPECIALTY RETAIL - Specialty Retail, Other
|
$97.09
|
-1.35
-1.37% |
$99.38
|
698,851
87.52% of 50 DAV
50 DAV is 798,500
|
$103.52
-6.21%
|
9/4/2012
|
$93.17
|
PP = $98.52
|
|
MB = $103.45
|
Most Recent Note - 9/18/2012 5:29:17 PM
Y - Small gap down and loss today on light volume led to a close below its pivot point, raising concerns. Disciplined investors always limit losses if ever any stock falls -7% or more from their purchase price.
>>> The latest Featured Stock Update with an annotated graph appeared on 9/4/2012. Click here.
View all notes |
Alert me of new notes |
CANSLIM.net Company Profile |
SEC |
Zacks Reports |
StockTalk |
News |
Chart |
Request a new note
C
A N
S L
I M
|
ULTI
-
NASDAQ
Ultimate Software Group
INTERNET - Internet Software and Services
|
$98.15
|
-0.26
-0.26% |
$100.50
|
148,688
94.05% of 50 DAV
50 DAV is 158,100
|
$106.40
-7.76%
|
8/27/2012
|
$98.36
|
PP = $99.19
|
|
MB = $104.15
|
Most Recent Note - 9/21/2012 4:19:29 PM
Y - Today marked is 4th consecutive small loss while consolidating near its all-time high. Prior chart highs define initial support to watch above its 50 DMA line.
>>> The latest Featured Stock Update with an annotated graph appeared on 8/27/2012. Click here.
View all notes |
Alert me of new notes |
CANSLIM.net Company Profile |
SEC |
Zacks Reports |
StockTalk |
News |
Chart |
Request a new note
C
A N
S L
I M
|
Symbol/Exchange
Company Name
Industry Group |
PRICE |
CHANGE
(%Change) |
Day High |
Volume
(% DAV)
(% 50 day avg vol) |
52 Wk Hi
% From Hi |
Featured
Date |
Price
Featured |
Pivot Featured |
|
Max Buy |
VSI
-
NYSE
Vitamin Shoppe Inc
SPECIALTY RETAIL - Specialty Retail, Other
|
$57.08
|
-1.35
-2.31% |
$59.00
|
174,180
47.59% of 50 DAV
50 DAV is 366,000
|
$61.83
-7.67%
|
6/29/2012
|
$54.93
|
PP = $55.03
|
|
MB = $57.78
|
Most Recent Note - 9/21/2012 4:21:01 PM
G - Today marked its 4th consecutive small gain. It has not formed a sound new base. Prior lows near $52 define important chart support below its 50 DMA line.
>>> The latest Featured Stock Update with an annotated graph appeared on 9/10/2012. Click here.
View all notes |
Alert me of new notes |
CANSLIM.net Company Profile |
SEC |
Zacks Reports |
StockTalk |
News |
Chart |
Request a new note
C
A N
S L
I M
|
WPI
-
NYSE
Watson Pharmaceuticals
DRUGS - Drugs - Generic
|
$83.16
|
-0.18
-0.22% |
$84.48
|
755,032
67.21% of 50 DAV
50 DAV is 1,123,400
|
$84.59
-1.69%
|
8/24/2012
|
$82.90
|
PP = $81.10
|
|
MB = $85.16
|
Most Recent Note - 9/18/2012 5:42:38 PM
Y - Posted a gain today with below average volume. Still holding its ground in a tight range near its 52-week high since triggering a technical buy signal on 8/24/12 when highlighted in the mid-day report with a gap up gain backed by above average volume. Prior highs in the $81 area define initial support to watch on pullbacks.
>>> The latest Featured Stock Update with an annotated graph appeared on 8/28/2012. Click here.
View all notes |
Alert me of new notes |
CANSLIM.net Company Profile |
SEC |
Zacks Reports |
StockTalk |
News |
Chart |
Request a new note
C
A N
S L
I M
|