You are not logged in.
This means you
CAN ONLY VIEW reports that were published prior to Monday, April 14, 2025.
You
MUST UPGRADE YOUR MEMBERSHIP if you want to see any current reports.
AFTER MARKET UPDATE - FRIDAY, SEPTEMBER 25TH, 2009
Previous After Market Report Next After Market Report >>>
|
|
|
|
DOW |
-42.25 |
9,665.19 |
-0.44% |
|
Volume |
1,202,970,740 |
-12% |
|
Volume |
2,390,761,010 |
-10% |
|
NASDAQ |
-16.69 |
2,090.92 |
-0.79% |
|
Advancers |
1,361 |
44% |
|
Advancers |
1,106 |
39% |
|
S&P 500 |
-6.40 |
1,044.38 |
-0.61% |
|
Decliners |
1,630 |
52% |
|
Decliners |
1,590 |
57% |
|
Russell 2000 |
-2.81 |
598.94 |
-0.47% |
|
52 Wk Highs |
180 |
|
|
52 Wk Highs |
30 |
|
|
S&P 600 |
-1.07 |
314.63 |
-0.34% |
|
52 Wk Lows |
5 |
|
|
52 Wk Lows |
9 |
|
|
 |
Negative Reversal On Weekly Charts For Major Averages
Adam Sarhan, Contributing Writer,
The major averages closed lower on Friday and negatively reversed for the week. This was the first time that the major averages opened higher and closed lower on a weekly basis since the rally began 29 weeks ago (confirmed with the March 12, 2009 follow-through day). Volume was lower than the prior session on both major exchanges which helped the major averages avoid another distribution day. Decliners led advancers by an 8-to-7 ratio on the NYSE and by a 3-to-2 ratio on the Nasdaq exchange. There were only 6 high-ranked companies from the CANSLIM.net Leaders List that made a new 52-week high and appeared on the CANSLIM.net BreakOuts Page, lower from the 13 issues that appeared on the prior session. New 52-week highs outnumbered new 52-week lows on both exchanges, while new 52-week lows were in the single digits yet again.
The market closed mixed on Monday, but the indices ended near their intra-day highs as the bears failed to send stocks lower. The Conference Board said that its index of US leading economic indicators rose in August for the fifth straight time which capped the longest stretch of gains since 2004. It also echoed the recent batch of stronger than expected economic data which signals that the economic recovery continues. The gauge looks at leading economic indicators (has a projected outlook for the next three to six months) rose +0.6% which matched the Street's forecasts.
On Tuesday, stocks drifted higher amid signs that the global recovery is improving and another decline in the greenback. The dollar fell to a fresh 2009 low against the euro which helped send oil, gold, silver, copper and US Treasuries higher. Gold dominated the headlines and rallied over $13 higher after finding support above support (psychologically and technically important $1,000 per ounce level). Within 24 hours that all changed. By Wednesday's close, the dollar began to rally which caused the major averages to negatively reverse and sent a slew of commodities lower. Wednesday marked a distribution day for the major averages and set the stage for Thursday and Friday's sell off.
The major averages ended in the red on Thursday and Friday which caused the market to negatively reverse on a weekly basis. So far this is nothing more than a negative reversal which means there is a subtle change in the underlying health of the market. It is important to keep in mind that, since the March low, every pullback in the market has been muted at best and has not exceeded -8%. Therefore, the rally remains in full effect until one of the major averages falls more than -10% below a recent high or leading stocks begin to falter. Until one of these two events occur, the bulls remain in control and deserve the bullish benefit of the doubt.
Money Management Services: Do You Want Us To Manage Your Portfolio?
If so, fill out this form click HERE.
*Accounts over $250,000 please.
** Serious inquiries only.
PICTURED: This Nasdaq Composite Index started higher but closed lower for the week, marking a negative reversal on above average volume on its weekly chart for the first time since the March lows.
|
|
|
 |
Oil Services Index Consolidates Near June Highs
Kenneth J. Gruneisen - Passed the CAN SLIM® Master's Exam
Modest losses for the Healthcare Index ($HMO -1.53%) and Gold & Silver Index ($XAU -1.45%) showed that defensive areas were pulling back on Friday along with most groups. The Retail Index ($RLX -1.45%) was a negative influence along with the Broker/Dealer Index ($XBD -1.07%) and Bank Index ($BKX -0.88%) weighing on the major averages. The Internet Index ($IIX -1.00%) and Semiconductor Index ($SOX -0.62%) suffered modest losses, and the Biotechnology Index ($BTK -0.19%) and Networking Index ($NWX -0.03%) inched lower. Energy shares were quiet as the Integrated Oil Index ($XOI +0.29%) posted a small gain and the Oil Services Index ($OSX -0.04%) was virtually unchanged.
Charts courtesy www.stockcharts.com
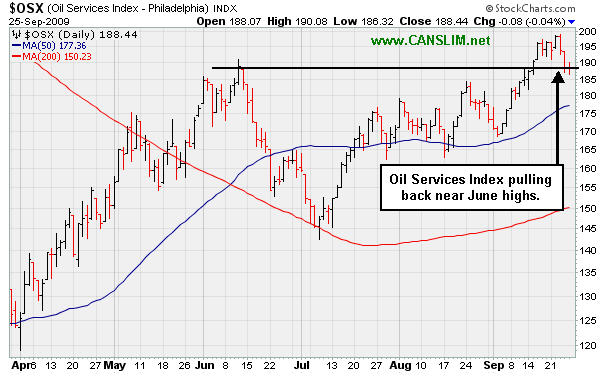
PICTURED: The Oil Services Index ($OSX -0.04%) has been pulling back near its June highs after recently blasting above them.
| Oil Services |
$OSX |
188.44 |
-0.08 |
-0.04% |
+55.24% |
| Healthcare |
$HMO |
1,172.92 |
-18.24 |
-1.53% |
+22.16% |
| Integrated Oil |
$XOI |
1,018.66 |
+2.92 |
+0.29% |
+3.98% |
| Semiconductor |
$SOX |
321.05 |
-1.99 |
-0.62% |
+51.32% |
| Networking |
$NWX |
232.09 |
-0.08 |
-0.03% |
+61.30% |
| Internet |
$IIX |
214.71 |
-2.16 |
-1.00% |
+60.51% |
| Broker/Dealer |
$XBD |
115.17 |
-1.24 |
-1.07% |
+48.66% |
| Retail |
$RLX |
372.40 |
-5.48 |
-1.45% |
+33.35% |
| Gold & Silver |
$XAU |
158.51 |
-2.33 |
-1.45% |
+27.99% |
| Bank |
$BKX |
46.12 |
-0.41 |
-0.88% |
+4.06% |
| Biotech |
$BTK |
926.84 |
-1.77 |
-0.19% |
+43.21% |
|
|
|
 |
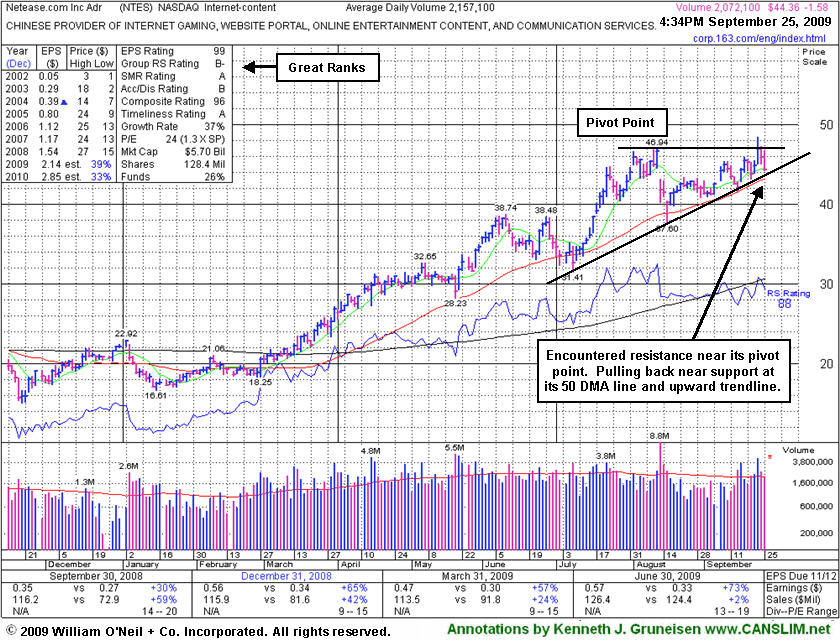
Encountered Prompt Resistance When Rising From Late-Stage Base
Kenneth J. Gruneisen - Passed the CAN SLIM® Master's Exam
Netease.com Inc (NTES -$1.58 or -3.55% to $44.36) encountered resistance and promptly pulled back this week under its latest pivot point. That could be a sign it is due to spend more time consolidating after already rallying this year from lows in the mid-teens. Keep in mind that this may be considered a late-stage base now, which has been noted as a riskier and more failure prone set-up. Meanwhile, important support is at its upward trendline and its 50-day moving average (DMA) line, where violations would raise concerns and trigger sell signals. After encountering heavy distributional pressure in August, NTES made an admirable stand above its 50 DMA line and prior chart highs in the $38 area. The high-ranked Internet - Content firm traded up more than +74.8% following its appearance in the April 2009 issue of the monthly newsletter, CANSLIM.net News (read here).
|
|
|
Color Codes Explained :
Y - Better candidates highlighted by our
staff of experts.
G - Previously featured
in past reports as yellow but may no longer be buyable under the
guidelines.
***Last / Change / Volume quote data in this table corresponds with the timestamp on the note***
Symbol/Exchange
Company Name
Industry Group |
Last |
Chg. |
Vol
% DAV |
Date Featured |
Price Featured |
Latest Pivot Point
Featured |
Status |
| Latest Max Buy Price |
ARO
- NYSE
Aeropostale Inc
RETAIL - Apparel Stores
|
$43.19
|
-0.01
|
1,799,780
66% DAV
2,745,300
|
8/21/2009
(Date
Featured) |
$39.21
(Price
Featured) |
PP = $38.84 |
G |
| MB = $40.78 |
Most Recent Note - 9/25/2009 4:12:25 PM
G - Today was the 4th consective loss on below average volume for this high-ranked leader in the Retail - Clothing/shoe group. It is extended from a sound base and not buyable under the investment system guidelines now. Support to watch is at prior highs in the $38 area. It was featured in yellow in the 8/21/09 Mid-Day BreakOuts Report (read here).
>>> The latest Featured Stock Update with an annotated graph appeared on 9/18/2009. click here.
|
|
C
A
S
I |
News |
Chart |
SEC
View all notes Alert
me of new notes
Company
Profile
|
ARST
-
|
$22.77
|
+0.10
|
466,790
63% DAV
745,500
|
9/1/2009
(Date
Featured) |
$19.91
(Price
Featured) |
PP = $20.90 |
G |
| MB = $21.95 |
Most Recent Note - 9/25/2009 4:13:47 PM
G - Perched near all-time highs but a bit extended from its latest sound base. Prior chart highs in the $20 area are important support to watch on pullbacks.
>>> The latest Featured Stock Update with an annotated graph appeared on 9/17/2009. click here.
|
|
C
A
S
I |
News |
Chart |
SEC
View all notes Alert
me of new notes
Company
Profile
|
BIDU
- NASDAQ
Baidu Inc Ads
INTERNET - Internet Information Providers
|
$387.56
|
-2.67
|
1,557,792
86% DAV
1,820,600
|
9/8/2009
(Date
Featured) |
$351.80
(Price
Featured) |
PP = $368.59 |
G |
| MB = $387.02 |
Most Recent Note - 9/25/2009 4:15:20 PM
G - Consolidating near its "max buy" level. BIDU was featured in yellow in the 9/08/09 Mid-Day BreakOuts Report (read here).
>>> The latest Featured Stock Update with an annotated graph appeared on 9/21/2009. click here.
|
|
C
A
S
I |
News |
Chart |
SEC
View all notes Alert
me of new notes
Company
Profile
|
CRM
- NYSE
Salesforce.com Inc
INTERNET - Internet Software & Services
|
$55.06
|
-1.04
|
1,752,682
86% DAV
2,032,700
|
8/16/2009
(Date
Featured) |
$47.12
(Price
Featured) |
PP = $45.59 |
G |
| MB = $47.87 |
Most Recent Note - 9/25/2009 4:18:28 PM
G - Consolidating near prior highs in the $55 area, an intial support level well above additional support at its upward trendline and 50 DMA line.
>>> The latest Featured Stock Update with an annotated graph appeared on 9/15/2009. click here.
|
|
C
A
S
I |
News |
Chart |
SEC
View all notes Alert
me of new notes
Company
Profile
|
EBIX
- NASDAQ
Ebix Inc
COMPUTER SOFTWARE & SERVICES - Business Software & Services
|
$46.72
|
-0.10
|
112,394
82% DAV
137,600
|
8/28/2009
(Date
Featured) |
$45.86
(Price
Featured) |
PP = $45.35 |
G |
| MB = $47.62 |
Most Recent Note - 9/25/2009 4:19:33 PM
G - Its recent weakness has been indicative of distributional pressure while consolidating toward important support at prior chart highs and its 50 DMA line in the $44-45 area. Recent whipsaw action briefly tested support, like its shakeout in mid-August. EBIX rallied as much as +19.76% since featured in yellow in the 8/28/09 Mid-Day BreakOuts Report (read here).
>>> The latest Featured Stock Update with an annotated graph appeared on 9/24/2009. click here.
|
|
C
A
S
I |
News |
Chart |
SEC
View all notes Alert
me of new notes
Company
Profile
|
GMCR
- NASDAQ
Green Mtn Coffee Roastrs
FOOD & BEVERAGE - Processed & Packaged Goods
|
$68.93
|
+2.84
|
1,193,333
81% DAV
1,476,700
|
7/17/2009
(Date
Featured) |
$60.15
(Price
Featured) |
PP = $63.79 |
G |
| MB = $66.98 |
Most Recent Note - 9/25/2009 4:21:19 PM
G - Gain today on higher volume but still a below average total, rallying up from its 50 DMA line. It did a great job of overcoming distributional pressure after it completed an additional share offering on 8/07/09. Volume totals have been light or near average as it recently rose back above its 50 DMA line and rallied up through most overhead supply. GMCR traded up more than +168% since appearing with an annotated graph under the headline "It May Soon Be Time To Go Green" when featured in the January 2009 CANSLIM.net News (read here).
>>> The latest Featured Stock Update with an annotated graph appeared on 9/23/2009. click here.
|
|
C
A
S
I |
News |
Chart |
SEC
View all notes Alert
me of new notes
Company
Profile
|
NTES
- NASDAQ
Netease Inc Adr
INTERNET - Internet Information Providers
|
$44.37
|
-1.57
|
2,079,801
96% DAV
2,157,100
|
9/23/2009
(Date
Featured) |
$47.11
(Price
Featured) |
PP = $47.04 |
Y |
| MB = $49.39 |
Most Recent Note - 9/25/2009 4:23:08 PM
Y - Encountered resistance and promptly pulled back this week under its latest pivot point. This may be considered a riskier late-stage base. Important support is at its 50 DMA line and upward trendline. Deterioration below those levels would raise more serious concerns and trigger technical sell signals.
>>> The latest Featured Stock Update with an annotated graph appeared on 9/25/2009. click here.
|
|
C
A
S
I |
News |
Chart |
SEC
View all notes Alert
me of new notes
Company
Profile
|
NVEC
- NASDAQ
N V E Corp
ELECTRONICS - Semiconductor - Specialized
|
$51.63
|
-1.56
|
140,027
152% DAV
91,900
|
8/26/2009
(Date
Featured) |
$55.32
(Price
Featured) |
PP = $57.60 |
G |
| MB = $60.48 |
Most Recent Note - 9/25/2009 4:25:50 PM
G - Losses on above average volume this week led to a violation and closes under its 50 DMA line, raising concerns and triggering a technical sell signal.
>>> The latest Featured Stock Update with an annotated graph appeared on 9/16/2009. click here.
|
|
C
A
S
I |
News |
Chart |
SEC
View all notes Alert
me of new notes
Company
Profile
|
PEGA
- NASDAQ
Pegasystems Inc
COMPUTER SOFTWARE & SERVICES - Business Software & Services
|
$33.25
|
+0.26
|
267,428
68% DAV
390,700
|
9/9/2009
(Date
Featured) |
$31.14
(Price
Featured) |
PP = $33.35 |
Y |
| MB = $35.02 |
Most Recent Note - 9/25/2009 4:28:43 PM
Y - Hovering near its latest pivot point after volume-driven gains pegged the high-ranked Computer Software - Financial firm to a new all-time high. An upward trendline connecting its July-September chart lows may be considered an initial support level above its 50 DMA line.
>>> The latest Featured Stock Update with an annotated graph appeared on 9/22/2009. click here.
|
|
C
A
S
I |
News |
Chart |
SEC
View all notes Alert
me of new notes
Company
Profile
|
|
|
|
THESE ARE NOT BUY RECOMMENDATIONS!
Comments contained in the body of this report are technical
opinions only. The material herein has been obtained
from sources believed to be reliable and accurate, however,
its accuracy and completeness cannot be guaranteed.
This site is not an investment advisor, hence it does
not endorse or recommend any securities or other investments.
Any recommendation contained in this report may not
be suitable for all investors and it is not to be deemed
an offer or solicitation on our part with respect to
the purchase or sale of any securities. All trademarks,
service marks and trade names appearing in this report
are the property of their respective owners, and are
likewise used for identification purposes only.
This report is a service available
only to active Paid Premium Members.
You may opt-out of receiving report notifications
at any time. Questions or comments may be submitted
by writing to Premium Membership Services 665 S.E. 10 Street, Suite 201 Deerfield Beach, FL 33441-5634 or by calling 1-800-965-8307
or 954-785-1121.
|
|
|


