You are not logged in.
This means you
CAN ONLY VIEW reports that were published prior to Monday, April 14, 2025.
You
MUST UPGRADE YOUR MEMBERSHIP if you want to see any current reports.
AFTER MARKET UPDATE - THURSDAY, SEPTEMBER 24TH, 2009
Previous After Market Report Next After Market Report >>>
|
|
|
|
DOW |
-41.11 |
9,707.44 |
-0.42% |
|
Volume |
1,367,802,020 |
+4% |
|
Volume |
2,660,641,220 |
-3% |
|
NASDAQ |
-23.81 |
2,107.61 |
-1.12% |
|
Advancers |
712 |
23% |
|
Advancers |
663 |
23% |
|
S&P 500 |
-10.09 |
1,050.78 |
-0.95% |
|
Decliners |
2,306 |
74% |
|
Decliners |
2,042 |
72% |
|
Russell 2000 |
-11.62 |
601.75 |
-1.89% |
|
52 Wk Highs |
157 |
|
|
52 Wk Highs |
45 |
|
|
S&P 600 |
-5.37 |
315.70 |
-1.67% |
|
52 Wk Lows |
3 |
|
|
52 Wk Lows |
5 |
|
|
 |
Distributional Pressure May Lead to Negative Reversal On Weekly Charts
Adam Sarhan, Contributing Writer,
The major averages closed lower one day after negatively reversing on Wednesday. Each of the major averages is now on track for a negative reversal on a weekly basis. If this occurs, then this will be the first negative reversal on a weekly basis since the rally began 29 weeks ago. Volume was higher than the prior session on the NYSE which marked a distribution day for the NYSE averages and suggests a pullback of some sort may continue to unfold. Nasdaq volume was reported slightly lower, however decliners led advancers by over a 3-to-1 ratio on both the NYSE and Nasdaq exchange. There were only 13 high-ranked companies from the CANSLIM.net Leaders List that made a new 52-week high and appeared on the CANSLIM.net BreakOuts Page, sharply lower from 33 issues that appeared on the prior session. New 52-week highs outnumbered new 52-week lows on both exchanges, while new 52-week lows were in the single digits yet again.
The market opened higher, turned lower, then with two hours left in the session began advancing again. However, the advance was not strong enough to erase earlier losses, and the major averages closed lower for a second straight day. It is very important to pay attention to see how the market closes on Friday. If the market does not rally and closes lower on a weekly basis then that will put serious pressure on the current rally. Conversely, if the bulls show up and send prices higher that will bode well for this 6-month old rally. Now that the market is beginning to show signs of weakness, it is very important to closely watch your stocks and act quickly if/when they begin triggering technical sell signals.
The National Association of Realtors said that existing US home sales unexpectedly fell last month for the first time since March. The report showed that purchases slid by -2.7% in August to a 5.1 million annual rate which was the second-highest level in the last 23 months. The median price also dropped -12.5% from August 2008 as the country continues to recover from the worst economic meltdown since the Great Depression. Elsewhere, the Labor Department said that unemployment claims declined last week.
BlackBerry maker Research In Motion (RIMM -3.16%) reported weaker quarterly profit and an outlook that fell short of analyst expectations after Thursday's closing bell, sending its shares down considersably in after-hours trading.
PICTURED: The S&P 500 Index closed lower for a second consecutive day. Remember that the major averages have rallied over +50% since the March lows and during that entire time have not pulled back more than -6%. That is a very impressive feat, but unfortunately not forever sustainable. Instead of being surprised when a pullback occurs, outsmart your peers by being prepared.
|
|
|
 |
Widespread Weakness Drags Financial, Defensive, and Tech Groups Lower
Kenneth J. Gruneisen - Passed the CAN SLIM® Master's Exam
Widespread losses dragged all areas lower on Thursday and the Broker/Dealer Index ($XBD -4.05%) was among the weaker areas along with the Bank Index ($BKX -2.08%). Generally defensive areas offered no safe haven for investors as the Healthcare Index ($HMO -3.00%), Gold & Silver Index ($XAU -2.28%), Integrated Oil Index ($XOI -1.81%), and Oil Services Index ($OSX -2.75%) suffered considerable losses. The Semiconductor Index ($SOX -2.42%) was unable to buck the negative bias as it had done on the prior session, and the chip group outpaced the other tech sector indexes to the downside as the Biotechnology Index ($BTK -1.71%), Networking Index ($NWX -1.69%), and Internet Index ($IIX -0.82%) followed suit. The Retail Index ($RLX -0.73%) also lost ground, rounding out a unanimously negative session for the groups regularly covered in this IGW section.
Charts courtesy www.stockcharts.com
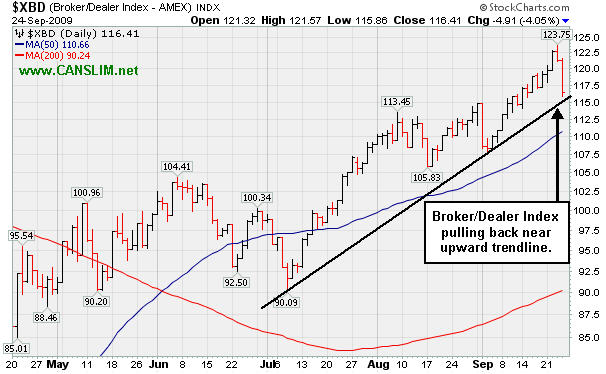
PICTURED: The Broker/Dealer Index ($XBD -4.05%) pulled back sharply toward an upward trendline connecting its July-September lows.
| Oil Services |
$OSX |
188.52 |
-5.33 |
-2.75% |
+55.30% |
| Healthcare |
$HMO |
1,191.16 |
-36.88 |
-3.00% |
+24.06% |
| Integrated Oil |
$XOI |
1,015.74 |
-18.74 |
-1.81% |
+3.68% |
| Semiconductor |
$SOX |
323.04 |
-8.01 |
-2.42% |
+52.26% |
| Networking |
$NWX |
232.17 |
-4.00 |
-1.69% |
+61.35% |
| Internet |
$IIX |
216.87 |
-1.80 |
-0.82% |
+62.12% |
| Broker/Dealer |
$XBD |
116.41 |
-4.91 |
-4.05% |
+50.26% |
| Retail |
$RLX |
377.88 |
-2.77 |
-0.73% |
+35.31% |
| Gold & Silver |
$XAU |
160.84 |
-3.75 |
-2.28% |
+29.87% |
| Bank |
$BKX |
46.53 |
-0.99 |
-2.08% |
+4.99% |
| Biotech |
$BTK |
928.61 |
-16.19 |
-1.71% |
+43.49% |
|
|
|
 |
Prior Highs and 50 DMA Are Important Support Now
Kenneth J. Gruneisen - Passed the CAN SLIM® Master's Exam
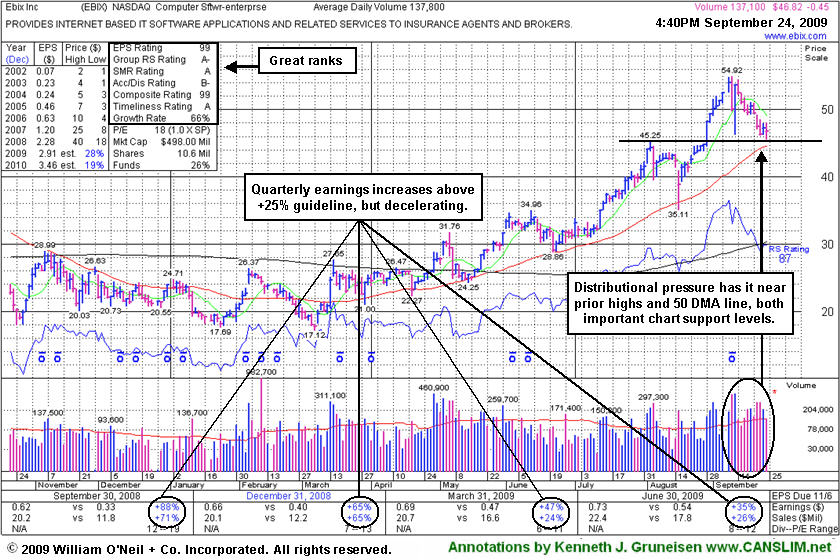
Ebix Inc (EBIX -$0.45 or -0.96% to $46.82) has shown recent weakness indicative of distributional pressure while consolidating toward important support at prior chart highs and its 50-day moving average (DMA) line in the $44-45 area. It has struggled since another wild whipsaw-like shakeout briefly tested support, much like its shakeout in mid-August nearly tested prior chart highs. As shown in the annotated graph below, earnings increases in quarterly comparisons have been strong and above the +25% guideline, but previously noted "steady sequential deceleration" is of some concern. It is preferred when earnings growth is strong and accelerating, not losing steam.
Volatility like we have recently seen serves as a reminder for investors to always make disciplined buys and sells! EBIX rallied as much as +19.76% since featured in yellow in the 8/28/09 CANSLIM.net Mid-Day BreakOuts Report (read here) as it was reaching a new all-time high. It has erases most of its gains since a technical buy signal was triggered with a considerable gain backed by volume +81.94% above average as it cleared a cup-with-high-handle pattern after "3-weeks tight". It formed the big cup-with-high-handle shaped pattern (finding great support at its 50 DMA line) since weak action prompted it to be dropped from the Featured Stocks list on 10/07/08.
EBIX traded up more than +59% after it was first featured in the March 2008 CANSLIM.net News (read here). At that time its average daily volume was only 4,900 shares, whereas today its average volume is at 137,800 shares. Today there are 8.09 million shares (the S criteria) in the public float, so its share price still could be very volatile in the event of heavy institutional buying or selling. The number of top-rated funds owning an interest in its shares rose from 31 in Dec '08 to 59 in Jun '09, which is a good sign concerning the I criteria of the investment system. Return on Equity is now reported at +42%, well above the +17% guideline. Do not be confused by the 3:1 split that took effect on 10/09/08. It has rebounded impressively and cleared its August '08 high (the $40 area) in July, after steadily climbing from this year's lows in the $17 range.
|
|
|
Color Codes Explained :
Y - Better candidates highlighted by our
staff of experts.
G - Previously featured
in past reports as yellow but may no longer be buyable under the
guidelines.
***Last / Change / Volume quote data in this table corresponds with the timestamp on the note***
Symbol/Exchange
Company Name
Industry Group |
Last |
Chg. |
Vol
% DAV |
Date Featured |
Price Featured |
Latest Pivot Point
Featured |
Status |
| Latest Max Buy Price |
ARO
- NYSE
Aeropostale Inc
RETAIL - Apparel Stores
|
$43.20
|
-0.37
|
2,286,838
83% DAV
2,742,400
|
8/21/2009
(Date
Featured) |
$39.21
(Price
Featured) |
PP = $38.84 |
G |
| MB = $40.78 |
Most Recent Note - 9/24/2009 5:12:05 PM
G - Third consective loss today on below average volume for this high-ranked leader in the Retail - Clothing/shoe group. It is extended from a sound base and not buyable under the investment system guidelines now. Support to watch is at prior highs in the $38 area. It was featured in yellow in the 8/21/09 Mid-Day BreakOuts Report (read here).
>>> The latest Featured Stock Update with an annotated graph appeared on 9/18/2009. click here.
|
|
C
A
S
I |
News |
Chart |
SEC
View all notes Alert
me of new notes
Company
Profile
|
ARST
-
|
$22.67
|
-0.88
|
1,036,368
137% DAV
754,300
|
9/1/2009
(Date
Featured) |
$19.91
(Price
Featured) |
PP = $20.90 |
G |
| MB = $21.95 |
Most Recent Note - 9/24/2009 5:27:42 PM
G - Pulled back today after 4 consecutive gains with above average volume helped to new all-time highs. Prior chart highs in the $20 area are important support to watch on pullbacks.
>>> The latest Featured Stock Update with an annotated graph appeared on 9/17/2009. click here.
|
|
C
A
S
I |
News |
Chart |
SEC
View all notes Alert
me of new notes
Company
Profile
|
BIDU
- NASDAQ
Baidu Inc Ads
INTERNET - Internet Information Providers
|
$390.23
|
-4.72
|
2,870,655
157% DAV
1,826,200
|
9/8/2009
(Date
Featured) |
$351.80
(Price
Featured) |
PP = $368.59 |
G |
| MB = $387.02 |
Most Recent Note - 9/24/2009 5:30:22 PM
G - Traded under its "max buy" level intra-day and closed with a loss on above average volume, yet it finished in the upper half of the session's trading range. BIDU was featured in yellow in the 9/08/09 Mid-Day BreakOuts Report (read here).
>>> The latest Featured Stock Update with an annotated graph appeared on 9/21/2009. click here.
|
|
C
A
S
I |
News |
Chart |
SEC
View all notes Alert
me of new notes
Company
Profile
|
CRM
- NYSE
Salesforce.com Inc
INTERNET - Internet Software & Services
|
$56.10
|
-1.44
|
1,085,322
53% DAV
2,038,900
|
8/16/2009
(Date
Featured) |
$47.12
(Price
Featured) |
PP = $45.59 |
G |
| MB = $47.87 |
Most Recent Note - 9/24/2009 5:31:51 PM
G - Loss today on light volume, quietly consolidating. Still extended from a sound base, thus not buyable now under the guidelines. Prior highs near $55 are an intial support level to watch on pullbacks.
>>> The latest Featured Stock Update with an annotated graph appeared on 9/15/2009. click here.
|
|
C
A
S
I |
News |
Chart |
SEC
View all notes Alert
me of new notes
Company
Profile
|
EBIX
- NASDAQ
Ebix Inc
COMPUTER SOFTWARE & SERVICES - Business Software & Services
|
$46.82
|
-0.45
|
138,266
100% DAV
137,800
|
8/28/2009
(Date
Featured) |
$45.86
(Price
Featured) |
PP = $45.35 |
G |
| MB = $47.62 |
Most Recent Note - 9/24/2009 5:32:53 PM
G - Recent weakness has been indicative of distributional pressure while consolidating toward important support at prior chart highs and its 50 DMA line in the $44-45 area. Recent whipsaw action briefly tested support, like its shakeout in mid-August. EBIX rallied as much as +19.76% since featured in yellow in the 8/28/09 Mid-Day BreakOuts Report (read here).
>>> The latest Featured Stock Update with an annotated graph appeared on 9/24/2009. click here.
|
|
C
A
S
I |
News |
Chart |
SEC
View all notes Alert
me of new notes
Company
Profile
|
GMCR
- NASDAQ
Green Mtn Coffee Roastrs
FOOD & BEVERAGE - Processed & Packaged Goods
|
$66.09
|
-1.01
|
719,006
48% DAV
1,488,400
|
7/17/2009
(Date
Featured) |
$60.15
(Price
Featured) |
PP = $63.79 |
G |
| MB = $66.98 |
Most Recent Note - 9/24/2009 5:35:33 PM
G - Pulling back toward its 50 DMA line with today's third consecutive loss on light volume. It did a great job of overcoming distributional pressure after it completed an additional share offering on 8/07/09. Volume totals have been light or near average as it recently rose back above its 50 DMA line and rallied up through most overhead supply. GMCR traded up more than +168% since appearing with an annotated graph under the headline "It May Soon Be Time To Go Green" when featured in the January 2009 CANSLIM.net News (read here).
>>> The latest Featured Stock Update with an annotated graph appeared on 9/23/2009. click here.
|
|
C
A
S
I |
News |
Chart |
SEC
View all notes Alert
me of new notes
Company
Profile
|
NTES
- NASDAQ
Netease Inc Adr
INTERNET - Internet Information Providers
|
$45.94
|
-1.06
|
2,643,667
123% DAV
2,157,600
|
9/23/2009
(Date
Featured) |
$47.11
(Price
Featured) |
PP = $47.04 |
Y |
| MB = $49.39 |
Most Recent Note - 9/24/2009 5:44:22 PM
Y - Encountered resistance and pulled back on slightly above average volume today, under its latest pivot point. The prior session's considerable gain on more than twice average volume followed a choppy consolidation. Color code was changed to yellow with new pivot point and max buy levels noted. This may be considered a riskier late-stage base. Important support is at its 50 DMA line and upward trendline. Deterioration below those levels would raise more serious concerns and trigger technical sell signals.
>>> The latest Featured Stock Update with an annotated graph appeared on 9/14/2009. click here.
|
|
C
A
S
I |
News |
Chart |
SEC
View all notes Alert
me of new notes
Company
Profile
|
NVEC
- NASDAQ
N V E Corp
ELECTRONICS - Semiconductor - Specialized
|
$53.19
|
-3.46
|
141,438
156% DAV
90,500
|
8/26/2009
(Date
Featured) |
$55.32
(Price
Featured) |
PP = $57.60 |
G |
| MB = $60.48 |
Most Recent Note - 9/24/2009 5:42:24 PM
G - Loss on higher volume today led to its first close under its 50 DMA line since March, raising concerns and triggering a technical sell signal. As previously noted, "Keep in mind its small supply (the S criteria) of shares outstanding which can contribute to greater than usual volatility. Be mindful of its still rather minuscule sales revenues. These concerns heighten the need for great discipline in trading (buying AND selling)."
>>> The latest Featured Stock Update with an annotated graph appeared on 9/16/2009. click here.
|
|
C
A
S
I |
News |
Chart |
SEC
View all notes Alert
me of new notes
Company
Profile
|
PEGA
- NASDAQ
Pegasystems Inc
COMPUTER SOFTWARE & SERVICES - Business Software & Services
|
$32.99
|
-1.02
|
310,063
80% DAV
389,800
|
9/9/2009
(Date
Featured) |
$31.14
(Price
Featured) |
PP = $33.35 |
Y |
| MB = $35.02 |
Most Recent Note - 9/24/2009 5:43:47 PM
Y - Loss today on lighter volume. Its pullback under its latest pivot point raises some concerns after volume-driven gains pegged the high-ranked Computer Software - Financial firm to a new all-time high.
>>> The latest Featured Stock Update with an annotated graph appeared on 9/22/2009. click here.
|
|
C
A
S
I |
News |
Chart |
SEC
View all notes Alert
me of new notes
Company
Profile
|
|
|
|
THESE ARE NOT BUY RECOMMENDATIONS!
Comments contained in the body of this report are technical
opinions only. The material herein has been obtained
from sources believed to be reliable and accurate, however,
its accuracy and completeness cannot be guaranteed.
This site is not an investment advisor, hence it does
not endorse or recommend any securities or other investments.
Any recommendation contained in this report may not
be suitable for all investors and it is not to be deemed
an offer or solicitation on our part with respect to
the purchase or sale of any securities. All trademarks,
service marks and trade names appearing in this report
are the property of their respective owners, and are
likewise used for identification purposes only.
This report is a service available
only to active Paid Premium Members.
You may opt-out of receiving report notifications
at any time. Questions or comments may be submitted
by writing to Premium Membership Services 665 S.E. 10 Street, Suite 201 Deerfield Beach, FL 33441-5634 or by calling 1-800-965-8307
or 954-785-1121.
|
|
|


