You are not logged in.
This means you
CAN ONLY VIEW reports that were published prior to Monday, April 14, 2025.
You
MUST UPGRADE YOUR MEMBERSHIP if you want to see any current reports.
AFTER MARKET UPDATE - MONDAY, SEPTEMBER 22ND, 2014
Previous After Market Report Next After Market Report >>>
|
|
|
|
DOW |
-107.06 |
17,172.68 |
-0.62% |
|
Volume |
681,369,090 |
-63% |
|
Volume |
1,742,371,140 |
-35% |
|
NASDAQ |
-52.10 |
4,527.69 |
-1.14% |
|
Advancers |
510 |
16% |
|
Advancers |
555 |
20% |
|
S&P 500 |
-16.11 |
1,994.29 |
-0.80% |
|
Decliners |
2,565 |
81% |
|
Decliners |
2,211 |
78% |
|
Russell 2000 |
-17.56 |
1,129.36 |
-1.53% |
|
52 Wk Highs |
29 |
|
|
52 Wk Highs |
30 |
|
|
S&P 600 |
-7.98 |
650.32 |
-1.21% |
|
52 Wk Lows |
153 |
|
|
52 Wk Lows |
141 |
|
|
 |
Breadth Negative as Major Indices Fell
Kenneth J. Gruneisen - Passed the CAN SLIM® Master's Exam
The major averages ended lower on Monday's session. The Dow Jones Industrial Average lost 107 points to 17,172. The S&P 500 fell 16 points to 1,994. The NASDAQ declined 52 points to 4,527. Volume totals were reported lower than the prior session totals on the NYSE and on the Nasdaq exchange. Breadth was negative as decliners led advancers by a 5-1 margin on the NYSE and by a 4-1 margin on the NASDAQ exchange. Leadership contracted as there were 7 high-ranked companies from the CANSLIM.net Leaders List that made new 52-week highs and appeared on the CANSLIM.net BreakOuts Page, down from the prior session total of 60 stocks. New 52-week lows outnumbered new highs on the NYSE and on the Nasdaq exchange. There were losses for 10 of the 11 high-ranked companies currently included on the Featured Stocks Page. The broader market (M criteria) overcame recent distributional pressure while leadership (stocks hitting new 52-week highs) remained healthy. Remember that disciplined investors buy stocks with superior fundamentals only after they have triggered a proper technical buy signal.
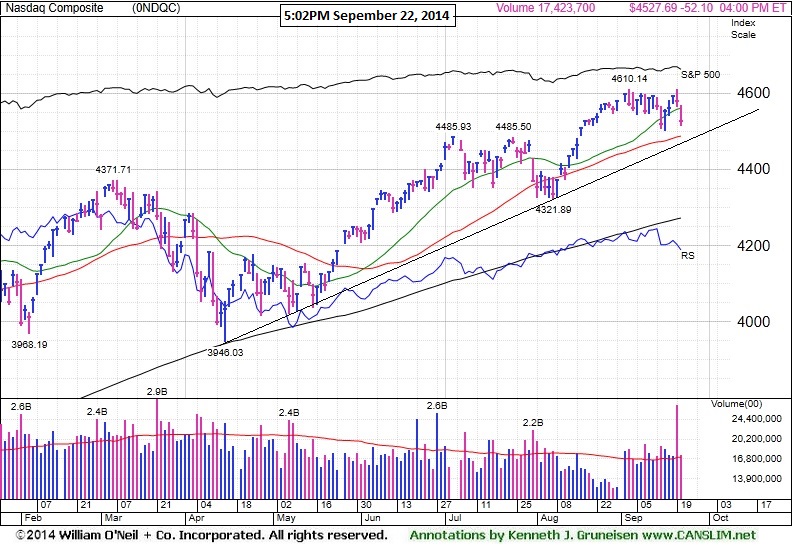
PICTURED: The Nasdaq Composite Index pulled back for a 2nd consecutive loss, retreating toward its 50-day moving average (DMA) line and multi-month upward trendline.
Stocks took a breather today following last week’s rally as economic data disappointed investors. A measure of economic activity from the Chicago Fed showed a contraction in August. Meanwhile, existing home sales fell 1.8%, which was the first decline in five months.
At the close all 10 sectors in the S&P 500 were in negative territory. Consumer discretionary and energy led the decline. Homebuilders slumped as Lennar (LEN -2.8%) and DR Horton (DHI -2.6%). Exxon Mobil (XOM -0.6%) fell as the price of WTI crude declined for the third day in four sessions amid fears of a further slowdown in China. Materials was the relative outperformer. Sigma-Aldrich (SIAL +33.2%) gaimed after Germany's Merck (MRK +0.15%) announced plans to purchase the company. Similarly, Dresser-Rand (DRC +2.6%), after Siemens AG (SIEGY -0.85%) released intentions to acquire the oil and gas supplier.
Treasuries continued to climb as investors speculated the Fed would withhold rate hikes due to disappointing data. The benchmark 10-year note advanced 3/32 to yield 2.56%.
The CANSLIM.net Featured Stocks Page shows the most action-worthy candidates and their latest notes and a Headline Link directs members to the latest detailed analysis with data-packed graphs annotated by a Certified expert along with links to additional resources. The Premium Member Homepage includes "dynamic archives" to all prior pay reports published.
|
 Kenneth J. Gruneisen started out as a licensed stockbroker in August 1987, a couple of months prior to the historic stock market crash that took the Dow Jones Industrial Average down -22.6% in a single day. He has published daily fact-based fundamental and technical analysis on high-ranked stocks online for two decades. Through FACTBASEDINVESTING.COM, Kenneth provides educational articles, news, market commentary, and other information regarding proven investment systems that work in good times and bad.
Comments contained in the body of this report are technical opinions only and are not necessarily those of Gruneisen Growth Corp. The material herein has been obtained from sources believed to be reliable and accurate, however, its accuracy and completeness cannot be guaranteed. Our firm, employees, and customers may effect transactions, including transactions contrary to any recommendation herein, or have positions in the securities mentioned herein or options with respect thereto. Any recommendation contained in this report may not be suitable for all investors and it is not to be deemed an offer or solicitation on our part with respect to the purchase or sale of any securities. |
|
 |
Commodity-Linked Groups Led Widespread Losses
Kenneth J. Gruneisen - Passed the CAN SLIM® Master's Exam
The Gold & Silver Index ($XAU -2.86%) was a standout decliner and energy-related shares fell dragging the Oil Services Index ($OSX -1.60%) and the Integrated Oil Index ($XOI -1.55%) lower. The Retail Index ($RLX -1.42%) was a negative influence on the major averages and financial shares fell as the Broker/Dealer Index ($XBD -0.78%) and the Bank Index ($BKX -0.73%) backpedaled. The Networking Index ($NWX -1.66%), Semiconductor Index ($SOX -1.26%), and the Biotechnology Index ($BTK -0.69%) were unanimously lower.
Charts courtesy www.stockcharts.com
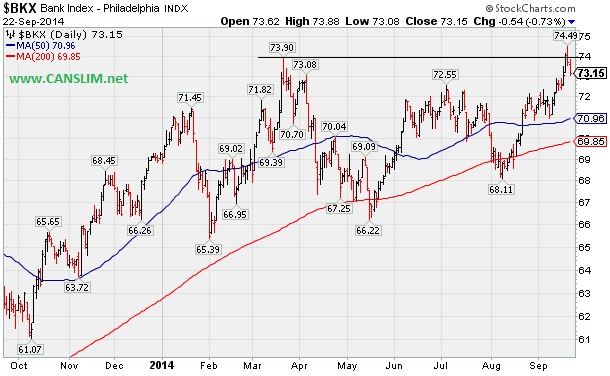
PICTURED: The Bank Index ($BKX -0.73%) pulled back for a 2nd consecutive session after briefly topping prior highs.
| Oil Services |
$OSX |
272.13 |
-4.42 |
-1.60% |
-3.17% |
| Integrated Oil |
$XOI |
1,593.04 |
-25.15 |
-1.55% |
+5.98% |
| Semiconductor |
$SOX |
641.35 |
-8.19 |
-1.26% |
+19.87% |
| Networking |
$NWX |
330.40 |
-5.58 |
-1.66% |
+1.99% |
| Broker/Dealer |
$XBD |
173.12 |
-1.37 |
-0.78% |
+7.82% |
| Retail |
$RLX |
936.52 |
-13.45 |
-1.42% |
-0.35% |
| Gold & Silver |
$XAU |
84.44 |
-2.49 |
-2.86% |
+0.34% |
| Bank |
$BKX |
73.15 |
-0.54 |
-0.73% |
+5.62% |
| Biotech |
$BTK |
3,086.70 |
-21.56 |
-0.69% |
+32.45% |
|
|
|
 |
Submit Your Request for a Featured Stock Update
Kenneth J. Gruneisen - Passed the CAN SLIM® Master's Exam
There are few stocks currently included on the Featured Stocks list and none of the companies need additional review in detail with annotated graphs. At times like these we have an opportunity to look back and review previously featured stocks which were dropped. This can serve as an educational review of the investment system's tactics and a reminder that even high-ranked leaders eventually fall out of favor. If you wish to request for a specific stock to receive more detailed coverage in this section please use the inquiry form to submit your request. Thank you! |
|
|
Color Codes Explained :
Y - Better candidates highlighted by our
staff of experts.
G - Previously featured
in past reports as yellow but may no longer be buyable under the
guidelines.
***Last / Change / Volume data in this table is the closing quote data***
Symbol/Exchange
Company Name
Industry Group |
PRICE |
CHANGE
(%Change) |
Day High |
Volume
(% DAV)
(% 50 day avg vol) |
52 Wk Hi
% From Hi |
Featured
Date |
Price
Featured |
Pivot Featured |
|
Max Buy |
ACT
-
NYSE
Actavis plc
Medical-Generic Drugs
|
$235.62
|
-6.19
-2.56% |
$240.26
|
2,590,277
122.36% of 50 DAV
50 DAV is 2,117,000
|
$245.50
-4.02%
|
6/20/2014
|
$216.53
|
PP = $230.87
|
|
MB = $242.41
|
Most Recent Note - 9/19/2014 5:44:29 PM
Y - Gain today for a new 52-week high backed by +77% above average volume confirmed a technical buy signal. Prior highs near $230 define near-term support to watch on pullbacks. See the latest FSU analysis for more details and new annotated graphs.
>>> FEATURED STOCK ARTICLE : Finally Volume-backed Gains Confirmed a Technical Buy Signal - 9/19/2014
View all notes |
Set NEW NOTE alert |
CANSLIM.net Company Profile |
SEC
News |
Chart |
Request a new note
C
A N
S L
I M


|
BITA
-
NYSE
Bitauto Hldgs Ltd Ads
Internet-Content
|
$77.37
|
-6.31
-7.54% |
$83.29
|
1,862,082
109.15% of 50 DAV
50 DAV is 1,706,000
|
$98.28
-21.28%
|
6/26/2014
|
$46.20
|
PP = $47.03
|
|
MB = $49.38
|
 Most Recent Note - 9/22/2014 12:09:11 PM
G - Undercutting prior lows and slumping toward its 50 DMA line with higher volume behind today's loss. Noted repeatedly with caution - "Has the look of a 'climax run' with volume-driven gains getting very extended from its prior base."
>>> FEATURED STOCK ARTICLE : Volume Totals Recently Cooling After Halting Slide - 9/18/2014
View all notes |
Set NEW NOTE alert |
CANSLIM.net Company Profile |
SEC
News |
Chart |
Request a new note
C
A N
S L
I M
|
FB
-
NASDAQ
Facebook Inc Cl A
INTERNET
|
$76.80
|
-1.11
-1.42% |
$77.53
|
31,908,338
88.11% of 50 DAV
50 DAV is 36,215,000
|
$78.36
-1.99%
|
9/9/2014
|
$76.67
|
PP = $76.84
|
|
MB = $80.68
|
Most Recent Note - 9/19/2014 5:50:11 PM
Y - Rallied with 2 times average volume for its second best close today. The volume-driven gain helped confirm a new (or add-on) technical buy signal. Found support at its 50 DMA line ($73.77) this week after a light bout of distributional pressure.
>>> FEATURED STOCK ARTICLE : Wedging Gains Not Indicative of Institutional Conviction - 9/9/2014
View all notes |
Set NEW NOTE alert |
CANSLIM.net Company Profile |
SEC
News |
Chart |
Request a new note
C
A N
S L
I M
|
NVGS
-
NYSE
Navigator Holdings Ltd
Transportation-Ship
|
$31.50
|
+0.01
0.03% |
$31.85
|
661,590
291.45% of 50 DAV
50 DAV is 227,000
|
$31.90
-1.25%
|
9/16/2014
|
$30.33
|
PP = $30.56
|
|
MB = $32.09
|
Most Recent Note - 9/22/2014 12:28:27 PM
Y - Still holding its ground near its 52-week high (N criteria) after volume-driven gains triggered a technical buy signal. Prior highs near $30 define initial support to watch on pullbacks. Disciplined investors do not chase stocks more than +5% above their pivot point, and they always limit losses by selling if any stock falls more than -7% from their purchase price.
>>> FEATURED STOCK ARTICLE : Finished Strong While Challenging Pivot Point and Recent Highs - 9/16/2014
View all notes |
Set NEW NOTE alert |
CANSLIM.net Company Profile |
SEC
News |
Chart |
Request a new note
C
A N
S L
I M
|
NXPI
-
NASDAQ
Nxp Semiconductors N V
ELECTRONICS - Semiconductor - Broad Line
|
$70.80
|
-1.19
-1.65% |
$72.55
|
3,147,913
94.00% of 50 DAV
50 DAV is 3,349,000
|
$73.82
-4.09%
|
8/29/2014
|
$68.50
|
PP = $67.89
|
|
MB = $71.28
|
Most Recent Note - 9/18/2014 12:57:39 PM
G - Color code is changed to green while challenging its 52-week high and rallying above its "max buy" level. No overhead supply remains to act as resistance. Prior highs in the $67 area define initial support to watch on pullbacks. See the latest FSU analysis for more details and annotated graphs.
>>> FEATURED STOCK ARTICLE : Consolidating Above Pivot Point and Below "Max Buy" Level - 9/17/2014
View all notes |
Set NEW NOTE alert |
CANSLIM.net Company Profile |
SEC
News |
Chart |
Request a new note
C
A N
S L
I M
|
Symbol/Exchange
Company Name
Industry Group |
PRICE |
CHANGE
(%Change) |
Day High |
Volume
(% DAV)
(% 50 day avg vol) |
52 Wk Hi
% From Hi |
Featured
Date |
Price
Featured |
Pivot Featured |
|
Max Buy |
PANW
-
NYSE
Palo Alto Networks
Computer Sftwr-Security
|
$97.93
|
-1.35
-1.36% |
$101.21
|
2,318,736
141.30% of 50 DAV
50 DAV is 1,641,000
|
$102.45
-4.41%
|
7/30/2014
|
$84.21
|
PP = $85.88
|
|
MB = $90.17
|
Most Recent Note - 9/22/2014 12:29:41 PM
G - Extended from any sound base after recent volume-driven gains. Prior highs in the $87 area define initial support to watch above its 50 DMA line ($85.83). Disciplined investors avoid chasing extended stocks.
>>> FEATURED STOCK ARTICLE : Pulling Back Following New Technical Breakout - 9/4/2014
View all notes |
Set NEW NOTE alert |
CANSLIM.net Company Profile |
SEC
News |
Chart |
Request a new note
C
A N
S L
I M
|
STRT
-
NASDAQ
Strattec Security Corp
AUTOMOTIVE - Auto Parts
|
$83.94
|
-3.31
-3.79% |
$87.24
|
42,524
193.29% of 50 DAV
50 DAV is 22,000
|
$89.87
-6.60%
|
9/19/2014
|
$86.06
|
PP = $89.97
|
|
MB = $94.47
|
Most Recent Note - 9/22/2014 5:41:57 PM
Y - Pulled back with above average volume today. Formed an advanced "3-weeks tight" base while holding its ground stubbornly. Subsequent volume-driven gains above the new pivot point cited may trigger a new (or add-on) technical buy signal. Prior highs in the $74-77 area define initial support to watch on pullbacks.
>>> FEATURED STOCK ARTICLE : Extended From Prior Highs and Previously Noted Base - 9/10/2014
View all notes |
Set NEW NOTE alert |
CANSLIM.net Company Profile |
SEC
News |
Chart |
Request a new note
C
A N
S L
I M
|
TARO
-
NYSE
Taro Pharmaceutical Inds
DRUGS - Drug Manufacturers - Other
|
$157.79
|
-1.42
-0.89% |
$162.29
|
180,780
210.21% of 50 DAV
50 DAV is 86,000
|
$165.30
-4.54%
|
7/30/2014
|
$144.24
|
PP = $149.99
|
|
MB = $157.49
|
Most Recent Note - 9/22/2014 12:39:37 PM
G - Consolidating above its 50 DMA line and -5.3% off its 52-week high, enduring more distributional pressure today. Repeatedly noted with caution - "Recently reported earnings for the Jun '14 quarter below the +25% minimum earnings guideline (C criteria) raising fundamental concerns."
>>> FEATURED STOCK ARTICLE : Churning Action Indicative of Distributional Pressure - 9/2/2014
View all notes |
Set NEW NOTE alert |
CANSLIM.net Company Profile |
SEC
News |
Chart |
Request a new note
C
A N
S L
I M
|
TRN
-
NYSE
Trinity Industries Inc
TRANSPORTATION - Railroads
|
$48.42
|
-1.88
-3.74% |
$50.14
|
3,814,179
150.28% of 50 DAV
50 DAV is 2,538,000
|
$50.77
-4.64%
|
4/30/2014
|
$37.79
|
PP = $38.03
|
|
MB = $39.93
|
Most Recent Note - 9/22/2014 5:44:01 PM
G - Pulled back today with above average volume following 4 consecutive volume-driven gains. It has not formed a sound base. Prior highs near $46-47 define near-term support above its 50 DMA line.
>>> FEATURED STOCK ARTICLE : Consolidating Above 50-Day Moving Average Line - 9/12/2014
View all notes |
Set NEW NOTE alert |
CANSLIM.net Company Profile |
SEC
News |
Chart |
Request a new note
C
A N
S L
I M
|
UA
-
NYSE
Under Armour Inc Cl A
CONSUMER NON-DURABLES - Textile - Apparel Clothing
|
$66.47
|
-1.94
-2.84% |
$68.43
|
3,251,399
137.02% of 50 DAV
50 DAV is 2,373,000
|
$73.42
-9.47%
|
7/10/2014
|
$58.50
|
PP = $60.79
|
|
MB = $63.83
|
Most Recent Note - 9/22/2014 5:47:30 PM
G - Violated its 50 DMA line with today's 2nd consecutive loss with above average volume triggering a technical sell signal. Only a prompt rebound would help its outlook improve. Prior notes cautioned members - "Fundamental concerns were raised by earnings reported +0% on +34% sales revenues for the Jun '14 quarter, below the +25% minimum earnings guideline (C criteria)."
>>> FEATURED STOCK ARTICLE : Higher Volume Behind Loss Testing 50-Day Moving Average - 9/15/2014
View all notes |
Set NEW NOTE alert |
CANSLIM.net Company Profile |
SEC
News |
Chart |
Request a new note
C
A N
S L
I M
|
Symbol/Exchange
Company Name
Industry Group |
PRICE |
CHANGE
(%Change) |
Day High |
Volume
(% DAV)
(% 50 day avg vol) |
52 Wk Hi
% From Hi |
Featured
Date |
Price
Featured |
Pivot Featured |
|
Max Buy |
WLK
-
NYSE
Westlake Chemical Corp
CHEMICALS - Specialty Chemicals
|
$93.18
|
-2.11
-2.21% |
$95.21
|
485,998
96.43% of 50 DAV
50 DAV is 504,000
|
$98.44
-5.34%
|
4/29/2014
|
$72.79
|
PP = $69.31
|
|
MB = $72.78
|
Most Recent Note - 9/16/2014 8:17:56 PM
G - Churned higher volume today while consolidating above prior highs in the $92 area defining support above its 50 DMA line. Subsequent violations would raise greater concerns and trigger technical sell signals. Technical strength has continued despite recent fundamental concerns.
>>> FEATURED STOCK ARTICLE : Consolidating Above Near-Term Support Levels - 9/11/2014
View all notes |
Set NEW NOTE alert |
CANSLIM.net Company Profile |
SEC
News |
Chart |
Request a new note
C
A N
S L
I M
|
|
|
|
THESE ARE NOT BUY RECOMMENDATIONS!
Comments contained in the body of this report are technical
opinions only. The material herein has been obtained
from sources believed to be reliable and accurate, however,
its accuracy and completeness cannot be guaranteed.
This site is not an investment advisor, hence it does
not endorse or recommend any securities or other investments.
Any recommendation contained in this report may not
be suitable for all investors and it is not to be deemed
an offer or solicitation on our part with respect to
the purchase or sale of any securities. All trademarks,
service marks and trade names appearing in this report
are the property of their respective owners, and are
likewise used for identification purposes only.
This report is a service available
only to active Paid Premium Members.
You may opt-out of receiving report notifications
at any time. Questions or comments may be submitted
by writing to Premium Membership Services 665 S.E. 10 Street, Suite 201 Deerfield Beach, FL 33441-5634 or by calling 1-800-965-8307
or 954-785-1121.
|
|
|

