***Last / Change / Volume data in this table is the closing quote data***
Symbol/Exchange
Company Name
Industry Group |
PRICE |
CHANGE
(%Change) |
Day High |
Volume
(% DAV)
(% 50 day avg vol) |
52 Wk Hi
% From Hi |
Featured
Date |
Price
Featured |
Pivot Featured |
|
Max Buy |
ABV
-
NYSE
Comp De Bebidas Adr
FOOD and BEVERAGE - Beverages - Brewers
|
$120.74
|
+0.89
0.74% |
$121.62
|
678,178
111.38% of 50 DAV
50 DAV is 608,900
|
$122.49
-1.43%
|
6/29/2010
|
$104.74
|
PP = $109.33
|
|
MB = $114.80
|
Most Recent Note - 9/17/2010 4:19:00 PM
G - This Brazil-based beverage firm hit another new all-time high today. Extended from a sound base, its prior highs in the $111-112 area define support above its 50 DMA line.
>>> The latest Featured Stock Update with an annotated graph appeared on 8/18/2010. Click here.
View all notes |
Alert me of new notes |
CANSLIM.net Company Profile |
SEC |
Zacks Reports |
StockTalk |
News |
Chart |
Request a new note
C
A N
S L
I M


|
ARUN
-
NASDAQ
Aruba Networks Inc
COMPUTER HARDWARE - Networking andamp; Communication Dev
|
$20.85
|
-1.11
-5.05% |
$22.00
|
2,422,351
120.74% of 50 DAV
50 DAV is 2,006,200
|
$22.18
-6.00%
|
8/30/2010
|
$18.12
|
PP = $18.51
|
|
MB = $19.44
|
 Most Recent Note - 9/22/2010 2:29:32 PM
G - Considerable loss today, erasing the prior session's big volume-driven gain. Extended from its latest base. Prior highs near $18 define a chart support level to watch.
>>> The latest Featured Stock Update with an annotated graph appeared on 9/2/2010. Click here.
View all notes |
Alert me of new notes |
CANSLIM.net Company Profile |
SEC |
Zacks Reports |
StockTalk |
News |
Chart |
Request a new note
C
A N
S L
I M
|
BIDU
-
NASDAQ
Baidu Inc Ads
INTERNET - Internet Information Providers
|
$91.81
|
+0.62
0.68% |
$91.98
|
6,204,339
65.82% of 50 DAV
50 DAV is 9,426,300
|
$92.31
-0.54%
|
9/17/2010
|
$85.73
|
PP = $88.42
|
|
MB = $92.84
|
Most Recent Note - 9/21/2010 12:32:15 PM
Y - Up again today after volume on the prior session was +40% above average and it rose above its pivot point for a new all-time high from a 6-week consolidation. The technical breakout is noted as a riskier "late stage" base.
>>> The latest Featured Stock Update with an annotated graph appeared on 8/13/2010. Click here.
View all notes |
Alert me of new notes |
CANSLIM.net Company Profile |
SEC |
Zacks Reports |
StockTalk |
News |
Chart |
Request a new note
C
A N
S L
I M
|
CACC
-
NASDAQ
Credit Acceptance Corp
FINANCIAL SERVICES - Credit Services
|
$60.89
|
+0.70
1.16% |
$61.65
|
17,654
37.97% of 50 DAV
50 DAV is 46,500
|
$63.45
-4.03%
|
7/29/2010
|
$52.04
|
PP = $54.07
|
|
MB = $56.77
|
Most Recent Note - 9/21/2010 4:47:15 PM
G - Loss on light volume today, finishing under its old high closes and slumping back into the previous short (4-week) flat base. An upward trendline defines support above its 50 DMA line and its recent chart low ($56.06).
>>> The latest Featured Stock Update with an annotated graph appeared on 8/2/2010. Click here.
View all notes |
Alert me of new notes |
CANSLIM.net Company Profile |
SEC |
Zacks Reports |
StockTalk |
News |
Chart |
Request a new note
C
A N
S L
I M
|
CMG
-
NYSE
Chipotle Mexican Grill
LEISURE - Restaurants
|
$165.74
|
-2.57
-1.53% |
$169.10
|
461,547
65.09% of 50 DAV
50 DAV is 709,100
|
$171.46
-3.34%
|
9/1/2010
|
$158.31
|
PP = $155.52
|
|
MB = $163.30
|
Most Recent Note - 9/20/2010 5:42:20 PM
G - Gain today with below average volume for a new all-time high. Extended from prior highs in the $155 area that define chart support.
>>> The latest Featured Stock Update with an annotated graph appeared on 9/1/2010. Click here.
View all notes |
Alert me of new notes |
CANSLIM.net Company Profile |
SEC |
Zacks Reports |
StockTalk |
News |
Chart |
Request a new note
C
A N
S L
I M
|
Symbol/Exchange
Company Name
Industry Group |
PRICE |
CHANGE
(%Change) |
Day High |
Volume
(% DAV)
(% 50 day avg vol) |
52 Wk Hi
% From Hi |
Featured
Date |
Price
Featured |
Pivot Featured |
|
Max Buy |
CRM
-
NYSE
Salesforce.Com Inc
INTERNET - Internet Software and Services
|
$118.69
|
-2.70
-2.22% |
$121.45
|
2,608,185
97.59% of 50 DAV
50 DAV is 2,672,500
|
$123.77
-4.10%
|
6/2/2010
|
$88.44
|
PP = $89.60
|
|
MB = $94.08
|
Most Recent Note - 9/22/2010 2:51:31 PM
G - Pulling back on lighter volume after its 9/20/10 gain with +54% above average volume helped it rally from an advanced "3-weeks tight" type pattern to a new all-time high.
>>> The latest Featured Stock Update with an annotated graph appeared on 8/16/2010. Click here.
View all notes |
Alert me of new notes |
CANSLIM.net Company Profile |
SEC |
Zacks Reports |
StockTalk |
News |
Chart |
Request a new note
C
A N
S L
I M
|
EGO
-
NYSE
Eldorado Gold Corp
METALS and MINING - Gold
|
$18.95
|
+0.06
0.32% |
$19.34
|
5,745,676
133.74% of 50 DAV
50 DAV is 4,296,200
|
$20.23
-6.33%
|
8/19/2010
|
$18.25
|
PP = $19.17
|
|
MB = $20.13
|
Most Recent Note - 9/22/2010 6:25:16 PM
Y - Gain today halted its slide after 3 consecutive losses with above average volume. It encountered heavy distributional pressure, pulling back under its pivot point near prior highs in the $18-19 area.
>>> The latest Featured Stock Update with an annotated graph appeared on 8/19/2010. Click here.
View all notes |
Alert me of new notes |
CANSLIM.net Company Profile |
SEC |
Zacks Reports |
StockTalk |
News |
Chart |
Request a new note
C
A N
S L
I M
|
FFIV
-
NASDAQ
F 5 Networks Inc
INTERNET - Internet Software and Services
|
$100.49
|
-2.89
-2.80% |
$103.82
|
1,678,375
100.22% of 50 DAV
50 DAV is 1,674,700
|
$105.20
-4.48%
|
6/16/2010
|
$74.50
|
PP = $74.10
|
|
MB = $77.81
|
Most Recent Note - 9/22/2010 2:34:51 PM
G - Pulling back on lighter volume after starting the week with a gain for a new all-time high with volume slightly above average. A steep upward trendline connecting July-August lows defines an initial chart support level well above its 50 DMA line.
>>> The latest Featured Stock Update with an annotated graph appeared on 9/13/2010. Click here.
View all notes |
Alert me of new notes |
CANSLIM.net Company Profile |
SEC |
Zacks Reports |
StockTalk |
News |
Chart |
Request a new note
C
A N
S L
I M
|
FOSL
-
NASDAQ
Fossil Inc
CONSUMER DURABLES - Recreational Goods, Other
|
$51.31
|
-0.53
-1.02% |
$52.41
|
393,128
51.32% of 50 DAV
50 DAV is 766,100
|
$52.64
-2.53%
|
8/10/2010
|
$45.54
|
PP = $42.69
|
|
MB = $44.82
|
Most Recent Note - 9/20/2010 2:28:10 PM
G - Gain today with below average volume for another new all-time high. Extended from any sound base after a recent streak of gains, its prior high in the $46 area defines support to watch.
>>> The latest Featured Stock Update with an annotated graph appeared on 8/11/2010. Click here.
View all notes |
Alert me of new notes |
CANSLIM.net Company Profile |
SEC |
Zacks Reports |
StockTalk |
News |
Chart |
Request a new note
C
A N
S L
I M
|
GMCR
-
NASDAQ
Green Mtn Coffee Roastrs
FOOD and BEVERAGE - Processed and Packaged Goods
|
$35.81
|
-1.19
-3.22% |
$37.31
|
2,375,309
94.35% of 50 DAV
50 DAV is 2,517,500
|
$37.32
-4.05%
|
8/17/2010
|
$33.62
|
PP = $33.30
|
|
MB = $34.97
|
Most Recent Note - 9/22/2010 2:37:55 PM
G - Loss today with lighter volume erased the prior session's big volume-driven gain. Prior highs in the $33 area define support to watch.
>>> The latest Featured Stock Update with an annotated graph appeared on 8/17/2010. Click here.
View all notes |
Alert me of new notes |
CANSLIM.net Company Profile |
SEC |
Zacks Reports |
StockTalk |
News |
Chart |
Request a new note
C
A N
S L
I M
|
Symbol/Exchange
Company Name
Industry Group |
PRICE |
CHANGE
(%Change) |
Day High |
Volume
(% DAV)
(% 50 day avg vol) |
52 Wk Hi
% From Hi |
Featured
Date |
Price
Featured |
Pivot Featured |
|
Max Buy |
HS
-
NYSE
Healthspring Inc
HEALTH SERVICES - Health Care Plans
|
$24.52
|
+0.25
1.03% |
$24.53
|
1,130,281
166.27% of 50 DAV
50 DAV is 679,800
|
$24.65
-0.53%
|
8/27/2010
|
$19.91
|
PP = $19.75
|
|
MB = $20.74
|
Most Recent Note - 9/22/2010 1:05:13 PM
G - Support to watch is prior chart highs in the $19-20 area. Disciplined investors do not chase stocks that are extended from a sound base.
>>> The latest Featured Stock Update with an annotated graph appeared on 8/27/2010. Click here.
View all notes |
Alert me of new notes |
CANSLIM.net Company Profile |
SEC |
Zacks Reports |
StockTalk |
News |
Chart |
Request a new note
C
A N
S L
I M
|
IGTE
-
NASDAQ
Igate Corp
COMPUTER SOFTWARE and SERVICES - Information Technology Service
|
$18.49
|
-0.51
-2.68% |
$19.03
|
392,057
88.66% of 50 DAV
50 DAV is 442,200
|
$19.45
-4.94%
|
9/8/2010
|
$17.29
|
PP = $18.26
|
|
MB = $19.17
|
Most Recent Note - 9/22/2010 2:41:36 PM
Y - Hovering near its 52-week high. Holding its ground stubbornly after 2 consecutive gains with above average volume were a sign of prompt support at its 50 DMA line and solid new buying demand as it followed-through to new highs, reconfirming its prior breakout.
>>> The latest Featured Stock Update with an annotated graph appeared on 9/10/2010. Click here.
View all notes |
Alert me of new notes |
CANSLIM.net Company Profile |
SEC |
Zacks Reports |
StockTalk |
News |
Chart |
Request a new note
C
A N
S L
I M
|
JOBS
-
NASDAQ
Fifty One Job Inc Ads
DIVERSIFIED SERVICES - Staffing and; Outsourcing Service
|
$36.42
|
-0.53
-1.43% |
$37.56
|
196,936
154.34% of 50 DAV
50 DAV is 127,600
|
$37.00
-1.57%
|
9/16/2010
|
$31.59
|
PP = $30.40
|
|
MB = $31.92
|
Most Recent Note - 9/22/2010 1:09:38 PM
G - Pulling back into the red after an early gain today for a new 52-week high. Very extended from a sound base, its prior highs in the $30 area define chart support now.
>>> The latest Featured Stock Update with an annotated graph appeared on 9/16/2010. Click here.
View all notes |
Alert me of new notes |
CANSLIM.net Company Profile |
SEC |
Zacks Reports |
StockTalk |
News |
Chart |
Request a new note
C
A N
S L
I M
|
MELI
-
NASDAQ
Mercadolibre Inc
INTERNET - Internet Software and; Services
|
$71.75
|
-0.43
-0.60% |
$72.33
|
439,705
52.93% of 50 DAV
50 DAV is 830,700
|
$74.78
-4.05%
|
5/13/2010
|
$54.21
|
PP = $55.85
|
|
MB = $58.64
|
Most Recent Note - 9/17/2010 10:18:51 AM
G - Gapped down today. In recent weeks it wedged to new high ground with light volume behind gains as it got extended from a sound base. Its 50 DMA line defines important chart support.
>>> The latest Featured Stock Update with an annotated graph appeared on 8/26/2010. Click here.
View all notes |
Alert me of new notes |
CANSLIM.net Company Profile |
SEC |
Zacks Reports |
StockTalk |
News |
Chart |
Request a new note
C
A N
S L
I M
|
MRX
-
NYSE
Medicis Pharmaceut Cl A
DRUGS - Biotechnology
|
$29.60
|
-0.64
-2.12% |
$30.14
|
765,230
62.71% of 50 DAV
50 DAV is 1,220,200
|
$30.29
-2.28%
|
8/12/2010
|
$26.88
|
PP = $26.71
|
|
MB = $28.05
|
Most Recent Note - 9/22/2010 6:21:12 PM
G - Loss on light volume today after a gain with above average volume on the prior session for a new 2010 high. Prior highs in the $28 area define the initial chart support level to watch.
>>> The latest Featured Stock Update with an annotated graph appeared on 8/12/2010. Click here.
View all notes |
Alert me of new notes |
CANSLIM.net Company Profile |
SEC |
Zacks Reports |
StockTalk |
News |
Chart |
Request a new note
C
A N
S L
I M
|
Symbol/Exchange
Company Name
Industry Group |
PRICE |
CHANGE
(%Change) |
Day High |
Volume
(% DAV)
(% 50 day avg vol) |
52 Wk Hi
% From Hi |
Featured
Date |
Price
Featured |
Pivot Featured |
|
Max Buy |
MWIV
-
NASDAQ
M W I Veterinary Supply
HEALTH SERVICES - Medical Instruments and; Supplies
|
$57.22
|
-0.58
-1.00% |
$57.66
|
38,594
51.39% of 50 DAV
50 DAV is 75,100
|
$57.99
-1.33%
|
7/29/2010
|
$52.05
|
PP = $52.09
|
|
MB = $54.69
|
Most Recent Note - 9/20/2010 2:26:58 PM
G - Gain today has it quietly rising further above its "max buy" level, poised for a new high close. Its 50 DMA line defines important chart support.
>>> The latest Featured Stock Update with an annotated graph appeared on 9/7/2010. Click here.
View all notes |
Alert me of new notes |
CANSLIM.net Company Profile |
SEC |
Zacks Reports |
StockTalk |
News |
Chart |
Request a new note
C
A N
S L
I M
|
NEM
-
NYSE
Newmont Mining Corp
METALS and MINING - Gold
|
$64.94
|
+0.81
1.26% |
$65.50
|
7,498,520
118.67% of 50 DAV
50 DAV is 6,318,700
|
$64.40
0.84%
|
8/31/2010
|
$61.32
|
PP = $63.48
|
|
MB = $66.65
|
Most Recent Note - 9/22/2010 1:18:26 PM
Y - Gapped up and hit a new all-time high today. A positive reversal and strong close on the prior session helped it rally above its pivot point for a gain with +48% above average volume. Technically the breakout was near the minimum volume guideline for a proper buy signal. No overhead supply remains to hinder its progress. Leadership in the Mining - Gold/Silver/Gems group (L criteria) is a nice reassurance.
>>> The latest Featured Stock Update with an annotated graph appeared on 9/14/2010. Click here.
View all notes |
Alert me of new notes |
CANSLIM.net Company Profile |
SEC |
Zacks Reports |
StockTalk |
News |
Chart |
Request a new note
C
A N
S L
I M
|
NEOG
-
NASDAQ
Neogen Corp
DRUGS - Diagnostic Substances
|
$32.40
|
-0.10
-0.31% |
$32.60
|
109,149
108.82% of 50 DAV
50 DAV is 100,300
|
$32.95
-1.67%
|
9/1/2010
|
$30.79
|
PP = $30.49
|
|
MB = $32.01
|
Most Recent Note - 9/22/2010 1:22:04 PM
G- Pulling back from it 52-week high hit on the prior session. Reports earnings news on Thursday, September 23rd. Prior highs in the $30 area define initial support to watch.
>>> The latest Featured Stock Update with an annotated graph appeared on 8/20/2010. Click here.
View all notes |
Alert me of new notes |
CANSLIM.net Company Profile |
SEC |
Zacks Reports |
StockTalk |
News |
Chart |
Request a new note
C
A N
S L
I M
|
NFLX
-
NASDAQ
Netflix Inc
SPECIALTY RETAIL - Music and Video Stores
|
$156.93
|
+9.73
6.61% |
$156.95
|
8,874,986
181.54% of 50 DAV
50 DAV is 4,888,800
|
$149.95
4.65%
|
8/10/2010
|
$124.05
|
PP = $124.00
|
|
MB = $130.20
|
Most Recent Note - 9/22/2010 1:23:58 PM
G - Gapped up today, hitting new all-time highs. Prior highs define important support to watch along with an upward trendline that comes into play well above its 50 DMA line.
>>> The latest Featured Stock Update with an annotated graph appeared on 8/10/2010. Click here.
View all notes |
Alert me of new notes |
CANSLIM.net Company Profile |
SEC |
Zacks Reports |
StockTalk |
News |
Chart |
Request a new note
C
A N
S L
I M
|
NTAP
-
NASDAQ
Netapp Inc
COMPUTER HARDWARE - Data Storage Devices
|
$48.45
|
+0.25
0.52% |
$48.54
|
10,101,064
129.21% of 50 DAV
50 DAV is 7,817,300
|
$49.87
-2.85%
|
9/8/2010
|
$46.98
|
PP = $44.99
|
|
MB = $47.24
|
Most Recent Note - 9/21/2010 4:49:19 PM
G - Loss today with above average volume, a sign of distribution. Extended from a sound base, support to watch is at prior chart highs near its latest pivot point.
>>> The latest Featured Stock Update with an annotated graph appeared on 9/8/2010. Click here.
View all notes |
Alert me of new notes |
CANSLIM.net Company Profile |
SEC |
Zacks Reports |
StockTalk |
News |
Chart |
Request a new note
C
A N
S L
I M
|
Symbol/Exchange
Company Name
Industry Group |
PRICE |
CHANGE
(%Change) |
Day High |
Volume
(% DAV)
(% 50 day avg vol) |
52 Wk Hi
% From Hi |
Featured
Date |
Price
Featured |
Pivot Featured |
|
Max Buy |
ORCL
-
NASDAQ
Oracle Corp
COMPUTER SOFTWARE and SERVICES - Application Software
|
$27.20
|
+0.38
1.42% |
$27.33
|
51,909,391
150.85% of 50 DAV
50 DAV is 34,412,000
|
$27.63
-1.54%
|
9/20/2010
|
$27.32
|
PP = $26.73
|
|
MB = $28.07
|
Most Recent Note - 9/22/2010 1:26:11 PM
Y - Rising today after slumping near its pivot point. A "breakaway gap" on 9/17/10 was backed by 5 times average volume, and it was featured in yellow in the 9/20/10 mid-day report.. It has maintained a strong annual earnings (A criteria) history and sales revenues and earnings increases have shown impressive acceleration in its recent quarterly comparisons. Large supply of 5.03 billion shares outstanding makes it an unlikely sprinter.
>>> The latest Featured Stock Update with an annotated graph appeared on 9/20/2010. Click here.
View all notes |
Alert me of new notes |
CANSLIM.net Company Profile |
SEC |
Zacks Reports |
StockTalk |
News |
Chart |
Request a new note
C
A N
S L
I M
|
PAY
-
NYSE
Verifone Systems Inc
COMPUTER HARDWARE - Transaction Automation Systems
|
$28.19
|
-0.59
-2.05% |
$28.90
|
1,203,366
90.30% of 50 DAV
50 DAV is 1,332,600
|
$29.54
-4.58%
|
8/25/2010
|
$24.30
|
PP = $23.74
|
|
MB = $24.93
|
Most Recent Note - 9/21/2010 4:50:41 PM
G - Pulling back with average volume today. Very extended from a sound base, its prior highs in the $23 area define chart support.
>>> The latest Featured Stock Update with an annotated graph appeared on 8/30/2010. Click here.
View all notes |
Alert me of new notes |
CANSLIM.net Company Profile |
SEC |
Zacks Reports |
StockTalk |
News |
Chart |
Request a new note
C
A N
S L
I M
|
PRGO
-
NASDAQ
Perrigo Co
DRUGS - Drug Related Products
|
$64.52
|
+0.98
1.54% |
$64.69
|
1,059,983
100.62% of 50 DAV
50 DAV is 1,053,500
|
$65.38
-1.31%
|
9/15/2010
|
$63.73
|
PP = $64.76
|
|
MB = $68.00
|
Most Recent Note - 9/20/2010 5:45:34 PM
Y - Gain today with light volume, closing -3.5% off its 52-week high. Distributional pressure was noted last week after, technically, it did not trigger a proper technical buy signal.
>>> The latest Featured Stock Update with an annotated graph appeared on 9/15/2010. Click here.
View all notes |
Alert me of new notes |
CANSLIM.net Company Profile |
SEC |
Zacks Reports |
StockTalk |
News |
Chart |
Request a new note
C
A N
S L
I M
|
RAX
-
NYSE
Rackspace Hosting Inc
INTERNET - Internet Software and; Services
|
$22.98
|
+0.01
0.04% |
$23.19
|
1,459,734
80.43% of 50 DAV
50 DAV is 1,814,800
|
$23.51
-2.25%
|
9/21/2010
|
$22.84
|
PP = $23.61
|
|
MB = $24.79
|
Most Recent Note - 9/21/2010 1:11:50 PM
Y - Gain today has it trading pennies from its 52-week high, with no overhead supply remaining to hinder its progress. A solid gain on the prior session reconfirmed a recent technical breakout above prior chart highs. Subsequent gains into new high territory with volume conviction could signal the beginning of a meaningful price advance. This high-ranked Internet-Networking Solutions firm has earned very high ranks, and 3 of the past 4 quarterly earnings comparisons showed better than +25% increases. Its annual earnings history (A criteria) since trading began in 2008 has been good.
>>> The latest Featured Stock Update with an annotated graph appeared on 9/21/2010. Click here.
View all notes |
Alert me of new notes |
CANSLIM.net Company Profile |
SEC |
Zacks Reports |
StockTalk |
News |
Chart |
Request a new note
C
A N
S L
I M
|
ROVI
-
NASDAQ
Rovi Corp
COMPUTER SOFTWARE andamp; SERVICES - Security Software andamp; Services
|
$46.05
|
-1.29
-2.72% |
$47.75
|
1,275,633
99.25% of 50 DAV
50 DAV is 1,285,300
|
$48.72
-5.48%
|
8/31/2010
|
$43.31
|
PP = $45.06
|
|
MB = $47.31
|
Most Recent Note - 9/22/2010 2:44:22 PM
Y - Color code is changed to yellow as it pulls back under its "max buy" level with today's loss on lighter volume. Two very strong gains with heavy volume followed news of a multi-year licensing deal with Apple Corp (AAPL), and it found prompt support near its 50 DMA line.
>>> The latest Featured Stock Update with an annotated graph appeared on 8/24/2010. Click here.
View all notes |
Alert me of new notes |
CANSLIM.net Company Profile |
SEC |
Zacks Reports |
StockTalk |
News |
Chart |
Request a new note
C
A N
S L
I M
|
Symbol/Exchange
Company Name
Industry Group |
PRICE |
CHANGE
(%Change) |
Day High |
Volume
(% DAV)
(% 50 day avg vol) |
52 Wk Hi
% From Hi |
Featured
Date |
Price
Featured |
Pivot Featured |
|
Max Buy |
SHOO
-
NASDAQ
Steven Madden Limited
CONSUMER NON-DURABLES - Textile - Apparel Footwear
|
$38.49
|
-0.87
-2.21% |
$39.38
|
209,356
47.69% of 50 DAV
50 DAV is 439,000
|
$40.98
-6.08%
|
9/15/2010
|
$38.94
|
PP = $40.27
|
|
MB = $42.28
|
Most Recent Note - 9/22/2010 2:45:52 PM
Y - Holding its ground, quietly perched near its August high and only -5.8% from its 52-week high. New pivot point was cited based on its 7/30/10 high plus ten cents.
>>> The latest Featured Stock Update with an annotated graph appeared on 8/5/2010. Click here.
View all notes |
Alert me of new notes |
CANSLIM.net Company Profile |
SEC |
Zacks Reports |
StockTalk |
News |
Chart |
Request a new note
C
A N
S L
I M
|
SLW
-
NYSE
Silver Wheaton Corp
METALS and; MINING - Silver
|
$25.96
|
+0.81
3.22% |
$25.99
|
8,647,651
176.93% of 50 DAV
50 DAV is 4,887,500
|
$25.56
1.56%
|
8/25/2010
|
$21.40
|
PP = $21.99
|
|
MB = $23.09
|
Most Recent Note - 9/22/2010 1:37:38 PM
G - Small gap up today for a new all-time high. Extended from any sound base, its previous highs in the $21 area define chart support to watch.
>>> The latest Featured Stock Update with an annotated graph appeared on 8/25/2010. Click here.
View all notes |
Alert me of new notes |
CANSLIM.net Company Profile |
SEC |
Zacks Reports |
StockTalk |
News |
Chart |
Request a new note
C
A N
S L
I M
|
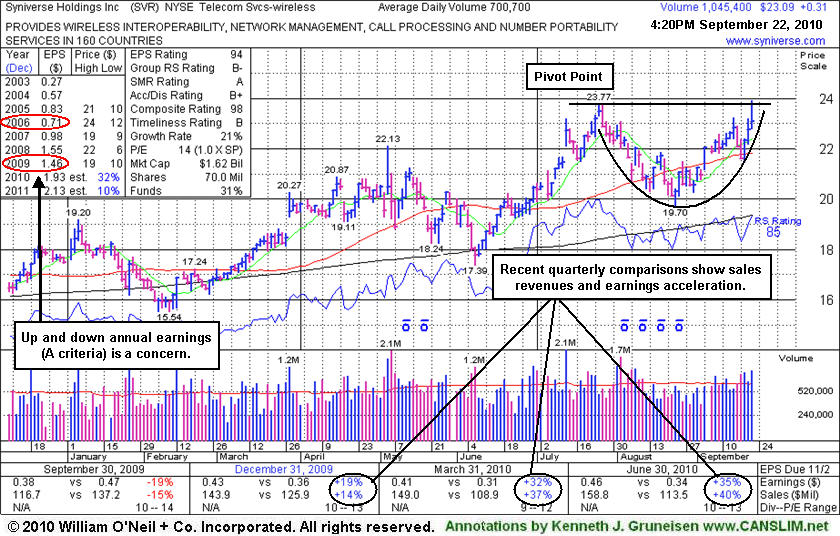
SVR
-
NYSE
Syniverse Holdings Inc
TELECOMMUNICATIONS - Diversified Communication Serv
|
$23.09
|
+0.31
1.36% |
$23.92
|
1,049,878
149.83% of 50 DAV
50 DAV is 700,700
|
$23.77
-2.86%
|
9/22/2010
|
$23.60
|
PP = $23.87
|
|
MB = $25.06
|
Most Recent Note - 9/22/2010 1:48:35 PM
Y - Spiked up to a new 52-week high earlier today. It has formed a saucer-like base in the past 9 weeks that included a couple of weeks trading under its 50 DMA line. It found support near prior chart highs following the previously noted 7/13/10 breakaway gap to a new multi-year high. Recent quarterly comparisons show encouraging sales revenues and earnings acceleration versus the year-ago periods. Up and down annual earnings history (A criteria) remains a concern.
>>> The latest Featured Stock Update with an annotated graph appeared on 9/22/2010. Click here.
View all notes |
Alert me of new notes |
CANSLIM.net Company Profile |
SEC |
Zacks Reports |
StockTalk |
News |
Chart |
Request a new note
C
A N
S L
I M
|
UA
-
NYSE
Under Armour Inc Cl A
CONSUMER NON-DURABLES - Textile - Apparel Clothing
|
$44.00
|
-1.08
-2.40% |
$45.27
|
844,062
111.99% of 50 DAV
50 DAV is 753,700
|
$45.44
-3.17%
|
9/9/2010
|
$39.99
|
PP = $40.10
|
|
MB = $42.11
|
Most Recent Note - 9/22/2010 2:47:52 PM
G - Pulling back on lighter volume, it is extended from its latest sound base pattern following a streak of 14 consecutive gains.
>>> The latest Featured Stock Update with an annotated graph appeared on 9/9/2010. Click here.
View all notes |
Alert me of new notes |
CANSLIM.net Company Profile |
SEC |
Zacks Reports |
StockTalk |
News |
Chart |
Request a new note
C
A N
S L
I M
|
UFPT
-
NASDAQ
U F P Tech Inc
CONSUMER NON-DURABLES - Packaging and Containers
|
$11.53
|
-0.19
-1.62% |
$11.83
|
25,157
61.66% of 50 DAV
50 DAV is 40,800
|
$11.80
-2.29%
|
9/16/2010
|
$11.20
|
PP = $11.69
|
|
MB = $12.27
|
Most Recent Note - 9/21/2010 1:33:42 PM
Y - Hit a new 52-week high and traded above its pivot point earlier today, posting a 7th consecutive small gain. No resistance remains due to overhead supply, and with only 6.21 million shares outstanding (S criteria) any institutional buying or selling can lead to greater price volatility.
>>> The latest Featured Stock Update with an annotated graph appeared on 9/17/2010. Click here.
View all notes |
Alert me of new notes |
CANSLIM.net Company Profile |
SEC |
Zacks Reports |
StockTalk |
News |
Chart |
Request a new note
C
A N
S L
I M
|
Symbol/Exchange
Company Name
Industry Group |
PRICE |
CHANGE
(%Change) |
Day High |
Volume
(% DAV)
(% 50 day avg vol) |
52 Wk Hi
% From Hi |
Featured
Date |
Price
Featured |
Pivot Featured |
|
Max Buy |
ULTA
-
NASDAQ
Ulta Salon Cosm & Frag
SPECIALTY RETAIL - Specialty Retail, Other
|
$27.94
|
-1.17
-4.02% |
$29.07
|
626,911
103.16% of 50 DAV
50 DAV is 607,700
|
$29.47
-5.19%
|
9/3/2010
|
$26.36
|
PP = $25.89
|
|
MB = $27.18
|
Most Recent Note - 9/22/2010 2:31:45 PM
G - Loss today has erased the prior session's big volume-driven gain. Prior highs in the $26 area define support to watch now.
>>> The latest Featured Stock Update with an annotated graph appeared on 9/3/2010. Click here.
View all notes |
Alert me of new notes |
CANSLIM.net Company Profile |
SEC |
Zacks Reports |
StockTalk |
News |
Chart |
Request a new note
C
A N
S L
I M
|
VIT
-
NYSE
Vanceinfo Tech Inc Ads
COMPUTER SOFTWARE and SERVICES - Business Software and Services
|
$30.74
|
+0.14
0.46% |
$30.81
|
328,352
59.02% of 50 DAV
50 DAV is 556,300
|
$31.88
-3.58%
|
7/8/2010
|
$25.20
|
PP = $26.58
|
|
MB = $27.91
|
Most Recent Note - 9/21/2010 1:38:42 PM
G - At an all-time high today, it is extended from a prior resistance level in the $26 area. Its 50 DMA line defines chart support to watch.
>>> The latest Featured Stock Update with an annotated graph appeared on 8/31/2010. Click here.
View all notes |
Alert me of new notes |
CANSLIM.net Company Profile |
SEC |
Zacks Reports |
StockTalk |
News |
Chart |
Request a new note
C
A N
S L
I M
|
WCRX
-
NASDAQ
Warner Chilcott Plc
DRUGS - Drug Manufacturers - Other
|
$22.78
|
-0.18
-0.78% |
$23.38
|
2,471,680
103.92% of 50 DAV
50 DAV is 2,378,500
|
$23.53
-3.19%
|
8/23/2010
|
$21.04
|
PP = $20.84
|
|
MB = $21.88
|
Most Recent Note - 9/20/2010 5:17:09 PM
G - Gain today with near average volume for yet another new all-time high. Color code was changed to green after getting extended from its prior base. (Featured price, pivot point, and max buy data are adjusted -$8.50 following recent cash dividend.)
>>> The latest Featured Stock Update with an annotated graph appeared on 8/23/2010. Click here.
View all notes |
Alert me of new notes |
CANSLIM.net Company Profile |
SEC |
Zacks Reports |
StockTalk |
News |
Chart |
Request a new note
C
A N
S L
I M
|