You are not logged in.
This means you
CAN ONLY VIEW reports that were published prior to Monday, April 14, 2025.
You
MUST UPGRADE YOUR MEMBERSHIP if you want to see any current reports.
AFTER MARKET UPDATE - TUESDAY, SEPTEMBER 22ND, 2009
Previous After Market Report Next After Market Report >>>
|
|
|
|
DOW |
+51.01 |
9,829.87 |
+0.52% |
|
Volume |
1,266,269,810 |
+6% |
|
Volume |
2,548,416,380 |
+3% |
|
NASDAQ |
+8.26 |
2,146.30 |
+0.39% |
|
Advancers |
2,165 |
69% |
|
Advancers |
1,563 |
55% |
|
S&P 500 |
+7.00 |
1,071.66 |
+0.66% |
|
Decliners |
873 |
28% |
|
Decliners |
1,168 |
41% |
|
Russell 2000 |
+4.72 |
620.69 |
+0.77% |
|
52 Wk Highs |
245 |
|
|
52 Wk Highs |
129 |
|
|
S&P 600 |
+2.16 |
324.48 |
+0.67% |
|
52 Wk Lows |
1 |
|
|
52 Wk Lows |
4 |
|
|
 |
Stocks Inch Higher While Gold Rallies & US Dollar Falls To 2009 Low Versus Euro
Adam Sarhan, Contributing Writer,
On Tuesday the major averages closed with small gains amid signs that the global recovery is improving and another decline in the greenback. Volume totals were higher than the prior session's levels across the board which indicated mild accumulation from the institutional crowd. Advancers led decliners by more than a 2-to-1 ratio on the NYSE while, but they led by a narrower 4-to-3 ratio on the Nasdaq exchange. There were 36 high-ranked companies from the CANSLIM.net Leaders List that made a new 52-week high and appeared on the CANSLIM.net BreakOuts Page, up from 26 issues that appeared on the prior session. New 52-week highs were in the triple digits on both exchanges, while new 52-week lows were in the single digits yet again.
Stocks rallied across the globe after the Asian Development Bank (ADB) raised its economic growth forecast for the region. The ADB cited stronger economic activity in China, India and Indonesia, predicting Asia, excluding Japan, will grow +3.9% in 2009. This set the tone for the Group of 20 (G-20) meeting in Pittsburgh on September 24-25. The G-20 will discuss details on how to prevent another massive global financial crisis, work on sustaining this recovery, and discuss how to properly regulate the financial sector.
The dollar fell to a fresh 2009 low against the euro which helped send oil, gold, silver, copper and US Treasuries higher. Gold dominated the headlines and rallied over $13 higher after finding support above support (psychologically and technically important $1,000 per ounce level) on Monday. Several gold stocks gapped higher but pulled back throughout the day. Financial stocks caught a bid after several well-known analysts raised their price targets and Q3 estimates. Richard Bove of Rochdale Securities LLC raised his price target on Bank of America (BAC +2.09%) to $25 from $19/share. Other analysts raised their outlook for other large financial institutions. The Federal Reserve Board also kicked off its two-day meeting. Fed Chairman Ben S. Bernanke said last week that he thinks that the recession has likely ended. Nearly everyone on the Street believes the Federal Open Market Committee will hold interest rates steady when they conclude their meeting on Wednesday. The Fed's overnight lending rate is sitting at a record low range of 0%-to-0.25%.
Q3 Webcast- Last Chance- Sign Up Now!
If you have not already signed up for Wednesday night's webcast- please Click Here. The webcast will be available On-Demand,which means that you can play, pause, stop, rewind and fast forward as many times as you like.
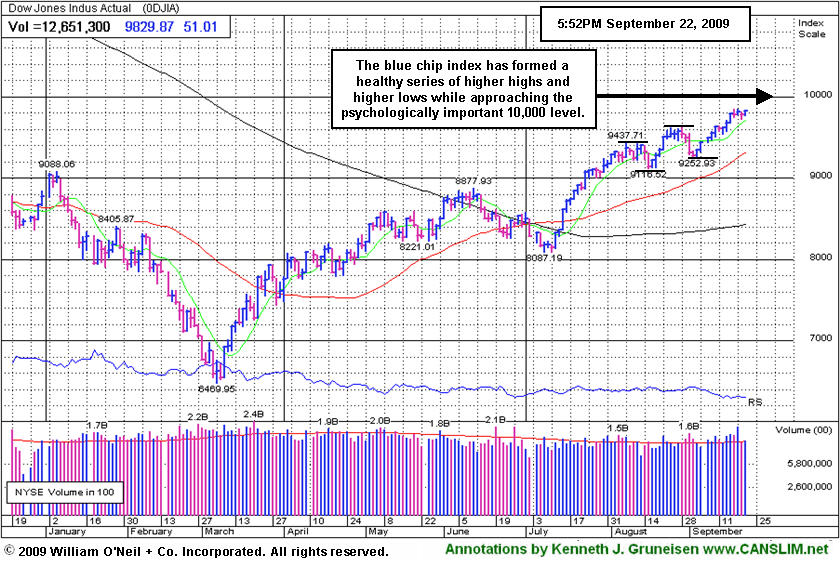
PICTURED: The blue chip index has formed a healthy series of higher highs and higher lows while approaching the psychologically important 10,000 level.
|
|
|
 |
Healthcare Index Consolidating After +90% Rally Off March Lows
Kenneth J. Gruneisen - Passed the CAN SLIM® Master's Exam
Financial and commodity-linked stocks were some of Tuesday's leading gainers. The Bank Index ($BKX +2.30%) and Broker/Dealer Index ($XBD +2.44%) each posted better than +2% gains. The Gold & Silver Index ($XAU +2.31%), Oil Services Index ($OSX +2.30%), and Integrated Oil Index ($XOI +1.50%) tallied decent gains. The tech sector also edged higher for the most part as the Semiconductor Index ($SOX +0.90%) and Networking Index ($NWX +0.83%) led the Internet Index ($IIX +0.37%). Meanwhile, the Healthcare Index ($HMO -1.14%) lagged and the Biotechnology Index ($BTK -0.82%) and Retail Index ($RLX -0.23%) created a slight drag on the major averages.
Charts courtesy www.stockcharts.com
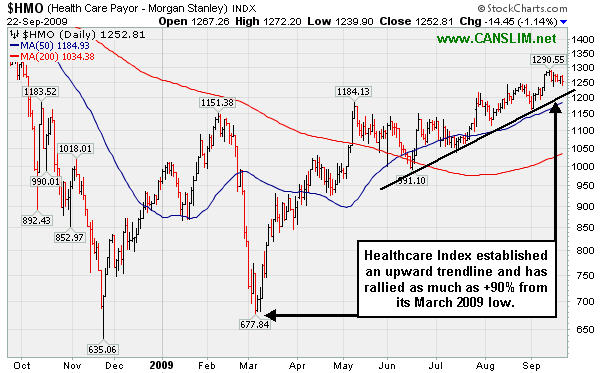
PICTURED: The Healthcare Index established an upward trend and has rallied as much as +90% from its March 2009 low. Continued strength in the healthcare group would be an encouraging sign, but deterioration in the upward trend would signal pessimism about the earnings outlook for companies in the healthcare group.
| Oil Services |
$OSX |
198.29 |
+4.46 |
+2.30% |
+63.35% |
| Healthcare |
$HMO |
1,252.81 |
-14.45 |
-1.14% |
+30.48% |
| Integrated Oil |
$XOI |
1,055.93 |
+15.65 |
+1.50% |
+7.78% |
| Semiconductor |
$SOX |
329.33 |
+2.93 |
+0.90% |
+55.22% |
| Networking |
$NWX |
240.39 |
+1.99 |
+0.83% |
+67.07% |
| Internet |
$IIX |
220.07 |
+0.81 |
+0.37% |
+64.51% |
| Broker/Dealer |
$XBD |
122.72 |
+2.92 |
+2.44% |
+58.41% |
| Retail |
$RLX |
384.92 |
-0.87 |
-0.23% |
+37.84% |
| Gold & Silver |
$XAU |
169.86 |
+3.84 |
+2.31% |
+37.15% |
| Bank |
$BKX |
48.55 |
+1.09 |
+2.30% |
+9.54% |
| Biotech |
$BTK |
957.04 |
-7.93 |
-0.82% |
+47.88% |
|
|
|
 |
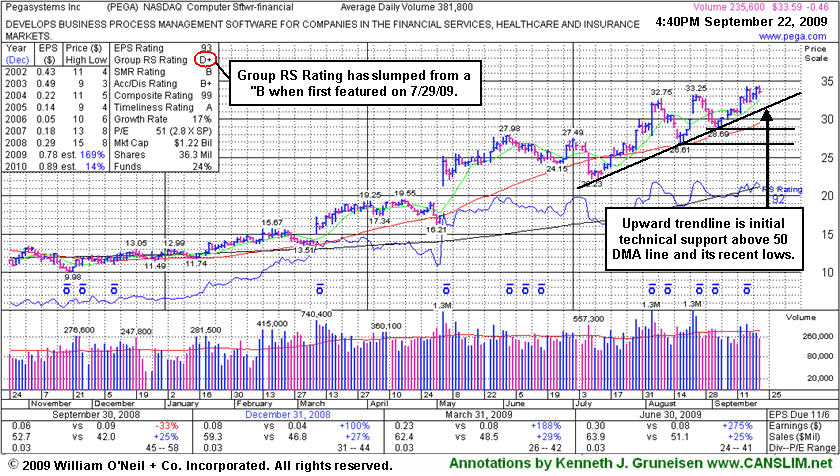
All-Time High Despite Software Group's Waning Relative Strength
Kenneth J. Gruneisen - Passed the CAN SLIM® Master's Exam
Pegasystems Inc (PEGA -$0.47 or -1.38% to $33.58) reached a new all-time high today but it reversed for a small loss on lighter volume. Volume-driven gains pegged the high-ranked Computer Software - Financial firm to a new all-time high on 9/16/09. Now an upward trendline connecting its July-September chart lows may be watched as an initial chart support level. Additional support might be expected at its 50-day moving average (DMA) line and its recent low ($28.69 on 9/03/09).
The group's RS Rating (see red circle) has slumped to D+ from a B when PEGA first triggered a technical buy signal as its broke out from a "double bottom" base on the day it was featured in the 7/29/09 mid-day report (read here). The stock itself has a 92 Relative Strength rank now, but it might be acting stronger if the industry group was strengthening rather than weakening in the recent period. PEGA has shown solid sales revenues increases and +25% earnings increases in the 3 last quarterly comparisons versus the year ago period. The previously noted downturn in annual earnings (the A criteria) from 2003 to 2006 has been followed by a solid turn around and big earnings increases in '07 and '08, and Street expectations for '09 are calling for well above +25% growth.
|
|
|
Color Codes Explained :
Y - Better candidates highlighted by our
staff of experts.
G - Previously featured
in past reports as yellow but may no longer be buyable under the
guidelines.
***Last / Change / Volume quote data in this table corresponds with the timestamp on the note***
Symbol/Exchange
Company Name
Industry Group |
Last |
Chg. |
Vol
% DAV |
Date Featured |
Price Featured |
Latest Pivot Point
Featured |
Status |
| Latest Max Buy Price |
ARO
- NYSE
Aeropostale Inc
RETAIL - Apparel Stores
|
$44.05
|
-0.15
|
491,385
18% DAV
2,770,900
|
8/21/2009
(Date
Featured) |
$39.21
(Price
Featured) |
PP = $38.84 |
G |
| MB = $40.78 |
Most Recent Note - 9/22/2009 4:11:09 PM
G - This high-ranked leader in the Retail - Clothing/shoe group negatively reversed after initially inching to a new all-time high today. It is extended from a sound base and not buyable under the investment system guidelines now. Support to watch is at prior highs in the $38 area. It was featured in yellow in the 8/21/09 Mid-Day BreakOuts Report (read here).
>>> The latest Featured Stock Update with an annotated graph appeared on 9/18/2009. click here.
|
|
C
A
S
I |
News |
Chart |
SEC
View all notes Alert
me of new notes
Company
Profile
|
ARST
-
|
$23.33
|
+0.15
|
318,313
43% DAV
735,900
|
9/1/2009
(Date
Featured) |
$19.91
(Price
Featured) |
PP = $20.90 |
G |
| MB = $21.95 |
Most Recent Note - 9/22/2009 4:12:53 PM
G - Today's 3rd consecutive gain with above average volume helped it hit another new all-time high. It is extended from its latest base. Prior chart highs in the $20 area are important support to watch on pullbacks.
>>> The latest Featured Stock Update with an annotated graph appeared on 9/17/2009. click here.
|
|
C
A
S
I |
News |
Chart |
SEC
View all notes Alert
me of new notes
Company
Profile
|
BIDU
- NASDAQ
Baidu Inc Ads
INTERNET - Internet Information Providers
|
$399.61
|
-0.64
|
556,954
30% DAV
1,834,600
|
9/8/2009
(Date
Featured) |
$351.80
(Price
Featured) |
PP = $368.59 |
G |
| MB = $387.02 |
Most Recent Note - 9/22/2009 4:14:23 PM
G - Negatively reversed again while hovering near the $400 level. Extended from a sound base, thus not buyable now under the investment system guidelines. BIDU was featured in yellow in the 9/08/09 Mid-Day BreakOuts Report (read here).
>>> The latest Featured Stock Update with an annotated graph appeared on 9/21/2009. click here.
|
|
C
A
S
I |
News |
Chart |
SEC
View all notes Alert
me of new notes
Company
Profile
|
CRM
- NYSE
Salesforce.com Inc
INTERNET - Internet Software & Services
|
$57.30
|
+0.22
|
374,356
18% DAV
2,035,300
|
8/16/2009
(Date
Featured) |
$47.12
(Price
Featured) |
PP = $45.59 |
G |
| MB = $47.87 |
Most Recent Note - 9/22/2009 4:16:20 PM
G - Today was its 3rd consecutive decline on ever-decreasing volume. It is still extended from a sound base, thus not buyable now under the guidelines. Prior highs near $55 are an intial support level to watch on pullbacks.
>>> The latest Featured Stock Update with an annotated graph appeared on 9/15/2009. click here.
|
|
C
A
S
I |
News |
Chart |
SEC
View all notes Alert
me of new notes
Company
Profile
|
EBIX
- NASDAQ
Ebix Inc
COMPUTER SOFTWARE & SERVICES - Business Software & Services
|
$47.38
|
-0.05
|
62,103
47% DAV
133,000
|
8/28/2009
(Date
Featured) |
$45.86
(Price
Featured) |
PP = $45.35 |
G |
| MB = $47.62 |
Most Recent Note - 9/22/2009 4:18:16 PM
G - Losses on heavy volume in recent weeks are indicative of distributional pressure while it falls toward important support at prior chart highs and its 50 DMA line in the $44-45 area. Recent whipsaw action briefly tested support, like its shakeout in mid-August. It has a small supply of only 6.62 million shares in the float. EBIX rallied as much as +19.76% since featured in yellow in the 8/28/09 Mid-Day BreakOuts Report (read here).
>>> The latest Featured Stock Update with an annotated graph appeared on 9/11/2009. click here.
|
|
C
A
S
I |
News |
Chart |
SEC
View all notes Alert
me of new notes
Company
Profile
|
GMCR
- NASDAQ
Green Mtn Coffee Roastrs
FOOD & BEVERAGE - Processed & Packaged Goods
|
$68.29
|
-1.90
|
576,056
39% DAV
1,489,700
|
7/17/2009
(Date
Featured) |
$60.15
(Price
Featured) |
PP = $63.79 |
G |
| MB = $66.98 |
Most Recent Note - 9/22/2009 4:20:42 PM
G - After a small gap up today it negatively reversed and closed in the lower half of its intra-day range. It did a great job of overcoming distributional pressure after it completed an additional share offering on 8/07/09. Volume totals have been light or near average as it recently rose back above its 50 DMA line and rallied up through most overhead supply. GMCR traded up more than +168% since appearing with an annotated graph under the headline "It May Soon Be Time To Go Green" when featured in the January 2009 CANSLIM.net News (read here).
>>> The latest Featured Stock Update with an annotated graph appeared on 9/10/2009. click here.
|
|
C
A
S
I |
News |
Chart |
SEC
View all notes Alert
me of new notes
Company
Profile
|
NTES
- NASDAQ
Netease Inc Adr
INTERNET - Internet Information Providers
|
$45.28
|
+1.49
|
847,844
41% DAV
2,089,200
|
7/17/2009
(Date
Featured) |
$39.29
(Price
Featured) |
PP = $38.74 |
G |
| MB = $40.68 |
Most Recent Note - 9/22/2009 4:23:33 PM
G - Gain today on better volume while still consolidating above important support at its 50 DMA line and upward trendline. Deterioration below those levels would raise more serious concerns and trigger additional sell signals.
>>> The latest Featured Stock Update with an annotated graph appeared on 9/14/2009. click here.
|
|
C
A
S
I |
News |
Chart |
SEC
View all notes Alert
me of new notes
Company
Profile
|
NVEC
- NASDAQ
N V E Corp
ELECTRONICS - Semiconductor - Specialized
|
$57.90
|
+0.05
|
27,865
31% DAV
90,600
|
8/26/2009
(Date
Featured) |
$55.32
(Price
Featured) |
PP = $57.60 |
G |
| MB = $60.48 |
Most Recent Note - 9/22/2009 4:34:37 PM
G - Consolidating above support at its 50 DMA line and near prior resistance in the $56-57 area. As previously noted, "Keep in mind its small supply (the S criteria) of shares outstanding which can contribute to greater than usual volatility. Be mindful of its still rather minuscule sales revenues. These concerns heighten the need for great discipline in trading (buying AND selling)."
>>> The latest Featured Stock Update with an annotated graph appeared on 9/16/2009. click here.
|
|
C
A
S
I |
News |
Chart |
SEC
View all notes Alert
me of new notes
Company
Profile
|
PEGA
- NASDAQ
Pegasystems Inc
COMPUTER SOFTWARE & SERVICES - Business Software & Services
|
$33.64
|
-0.41
|
69,809
18% DAV
381,800
|
9/9/2009
(Date
Featured) |
$31.14
(Price
Featured) |
PP = $33.35 |
Y |
| MB = $35.02 |
Most Recent Note - 9/22/2009 4:36:10 PM
Y - Small loss today on lighter volume. A pullback under its latest pivot point on 9/17/09 raised concerns after volume-driven gains pegged the high-ranked Computer Software - Financial firm to a new all-time high.
>>> The latest Featured Stock Update with an annotated graph appeared on 9/22/2009. click here.
|
|
C
A
S
I |
News |
Chart |
SEC
View all notes Alert
me of new notes
Company
Profile
|
|
|
|
THESE ARE NOT BUY RECOMMENDATIONS!
Comments contained in the body of this report are technical
opinions only. The material herein has been obtained
from sources believed to be reliable and accurate, however,
its accuracy and completeness cannot be guaranteed.
This site is not an investment advisor, hence it does
not endorse or recommend any securities or other investments.
Any recommendation contained in this report may not
be suitable for all investors and it is not to be deemed
an offer or solicitation on our part with respect to
the purchase or sale of any securities. All trademarks,
service marks and trade names appearing in this report
are the property of their respective owners, and are
likewise used for identification purposes only.
This report is a service available
only to active Paid Premium Members.
You may opt-out of receiving report notifications
at any time. Questions or comments may be submitted
by writing to Premium Membership Services 665 S.E. 10 Street, Suite 201 Deerfield Beach, FL 33441-5634 or by calling 1-800-965-8307
or 954-785-1121.
|
|
|


