***Last / Change / Volume data in this table is the closing quote data***
Symbol/Exchange
Company Name
Industry Group |
PRICE |
CHANGE
(%Change) |
Day High |
Volume
(% DAV)
(% 50 day avg vol) |
52 Wk Hi
% From Hi |
Featured
Date |
Price
Featured |
Pivot Featured |
|
Max Buy |
ABV
-
NYSE
Comp De Bebidas Adr
FOOD and BEVERAGE - Beverages - Brewers
|
$121.40
|
+1.32
1.10% |
$122.44
|
421,308
69.58% of 50 DAV
50 DAV is 605,500
|
$121.55
-0.12%
|
6/29/2010
|
$104.74
|
PP = $109.33
|
|
MB = $114.80
|
Most Recent Note - 9/17/2010 4:19:00 PM
G - This Brazil-based beverage firm hit another new all-time high today. Extended from a sound base, its prior highs in the $111-112 area define support above its 50 DMA line.
>>> The latest Featured Stock Update with an annotated graph appeared on 8/18/2010. Click here.
View all notes |
Alert me of new notes |
CANSLIM.net Company Profile |
SEC |
Zacks Reports |
StockTalk |
News |
Chart |
Request a new note
C
A N
S L
I M


|
ARUN
-
NASDAQ
Aruba Networks Inc
COMPUTER HARDWARE - Networking andamp; Communication Dev
|
$20.89
|
+0.05
0.24% |
$20.99
|
2,194,533
112.99% of 50 DAV
50 DAV is 1,942,200
|
$21.29
-1.88%
|
8/30/2010
|
$18.12
|
PP = $18.51
|
|
MB = $19.44
|
Most Recent Note - 9/16/2010 4:55:10 PM
G - Hit yet another new 52-week high today with average volume behind its gain, and it closed near the session high. Extended from its latest base, its prior highs near $18 define a chart support level to watch.
>>> The latest Featured Stock Update with an annotated graph appeared on 9/2/2010. Click here.
View all notes |
Alert me of new notes |
CANSLIM.net Company Profile |
SEC |
Zacks Reports |
StockTalk |
News |
Chart |
Request a new note
C
A N
S L
I M
|
BIDU
-
NASDAQ
Baidu Inc Ads
INTERNET - Internet Information Providers
|
$89.87
|
+4.14
4.83% |
$90.00
|
13,065,237
139.58% of 50 DAV
50 DAV is 9,360,100
|
$88.32
1.75%
|
9/17/2010
|
$85.73
|
PP = $88.42
|
|
MB = $92.84
|
 Most Recent Note - 9/20/2010 2:38:42 PM
Y - Volume is above slightly average behind today's gain for a new all-time high. After its 6-week consolidation, on 9/17/10 a new pivot point was cited based on its all-time high plus ten cents.
>>> The latest Featured Stock Update with an annotated graph appeared on 8/13/2010. Click here.
View all notes |
Alert me of new notes |
CANSLIM.net Company Profile |
SEC |
Zacks Reports |
StockTalk |
News |
Chart |
Request a new note
C
A N
S L
I M
|
CACC
-
NASDAQ
Credit Acceptance Corp
FINANCIAL SERVICES - Credit Services
|
$62.24
|
+0.77
1.25% |
$62.44
|
37,126
76.87% of 50 DAV
50 DAV is 48,300
|
$63.45
-1.91%
|
7/29/2010
|
$52.04
|
PP = $54.07
|
|
MB = $56.77
|
Most Recent Note - 9/16/2010 3:29:05 PM
G - Pulling back toward prior highs after a rally from a short (4-week) flat base. The minimum length for a valid flat base is 5 weeks, so its $61.41 high of 8/18/10 was not cited as the basis for a new pivot point.
>>> The latest Featured Stock Update with an annotated graph appeared on 8/2/2010. Click here.
View all notes |
Alert me of new notes |
CANSLIM.net Company Profile |
SEC |
Zacks Reports |
StockTalk |
News |
Chart |
Request a new note
C
A N
S L
I M
|
CMG
-
NYSE
Chipotle Mexican Grill
LEISURE - Restaurants
|
$170.13
|
+3.10
1.86% |
$170.95
|
507,399
71.79% of 50 DAV
50 DAV is 706,800
|
$170.00
0.08%
|
9/1/2010
|
$158.31
|
PP = $155.52
|
|
MB = $163.30
|
Most Recent Note - 9/20/2010 5:42:20 PM
G - Gain today with below average volume for a new all-time high. Extended from prior highs in the $155 area that define chart support.
>>> The latest Featured Stock Update with an annotated graph appeared on 9/1/2010. Click here.
View all notes |
Alert me of new notes |
CANSLIM.net Company Profile |
SEC |
Zacks Reports |
StockTalk |
News |
Chart |
Request a new note
C
A N
S L
I M
|
Symbol/Exchange
Company Name
Industry Group |
PRICE |
CHANGE
(%Change) |
Day High |
Volume
(% DAV)
(% 50 day avg vol) |
52 Wk Hi
% From Hi |
Featured
Date |
Price
Featured |
Pivot Featured |
|
Max Buy |
CRM
-
NYSE
Salesforce.Com Inc
INTERNET - Internet Software and Services
|
$123.14
|
+6.40
5.48% |
$123.77
|
4,011,930
154.88% of 50 DAV
50 DAV is 2,590,400
|
$122.00
0.93%
|
6/2/2010
|
$88.44
|
PP = $89.60
|
|
MB = $94.08
|
Most Recent Note - 9/20/2010 2:35:58 PM
G - Gain today has it rising from an advanced "3-weeks tight" type pattern to a new all-time high, however volume is not especially heavy behind its considerable gain and a new pivot point is not being cited.
>>> The latest Featured Stock Update with an annotated graph appeared on 8/16/2010. Click here.
View all notes |
Alert me of new notes |
CANSLIM.net Company Profile |
SEC |
Zacks Reports |
StockTalk |
News |
Chart |
Request a new note
C
A N
S L
I M
|
EGO
-
NYSE
Eldorado Gold Corp
METALS and MINING - Gold
|
$19.20
|
-0.29
-1.49% |
$19.58
|
6,451,742
156.08% of 50 DAV
50 DAV is 4,133,600
|
$20.23
-5.09%
|
8/19/2010
|
$18.25
|
PP = $19.17
|
|
MB = $20.13
|
Most Recent Note - 9/20/2010 12:33:08 PM
Y - Pulling back again today after a loss on the prior session with above average volume was noted as a sign of distributional pressure. Prior highs in the $18-19 area define the initial chart support level to watch above its 50 DMA line.
>>> The latest Featured Stock Update with an annotated graph appeared on 8/19/2010. Click here.
View all notes |
Alert me of new notes |
CANSLIM.net Company Profile |
SEC |
Zacks Reports |
StockTalk |
News |
Chart |
Request a new note
C
A N
S L
I M
|
FFIV
-
NASDAQ
F 5 Networks Inc
INTERNET - Internet Software and Services
|
$104.64
|
+3.66
3.62% |
$105.15
|
1,779,666
107.63% of 50 DAV
50 DAV is 1,653,500
|
$101.45
3.14%
|
6/16/2010
|
$74.50
|
PP = $74.10
|
|
MB = $77.81
|
Most Recent Note - 9/20/2010 2:40:39 PM
G - Today's 4th consecutive gain with below average volume helped it hit another new all-time high. Steep upward trendline connecting July-August lows defines an initial chart support level well above its 50 DMA line.
>>> The latest Featured Stock Update with an annotated graph appeared on 9/13/2010. Click here.
View all notes |
Alert me of new notes |
CANSLIM.net Company Profile |
SEC |
Zacks Reports |
StockTalk |
News |
Chart |
Request a new note
C
A N
S L
I M
|
FOSL
-
NASDAQ
Fossil Inc
CONSUMER DURABLES - Recreational Goods, Other
|
$52.43
|
+0.85
1.64% |
$52.54
|
632,597
84.61% of 50 DAV
50 DAV is 747,700
|
$52.08
0.67%
|
8/10/2010
|
$45.54
|
PP = $42.69
|
|
MB = $44.82
|
Most Recent Note - 9/20/2010 2:28:10 PM
G - Gain today with below average volume for another new all-time high. Extended from any sound base after a recent streak of gains, its prior high in the $46 area defines support to watch.
>>> The latest Featured Stock Update with an annotated graph appeared on 8/11/2010. Click here.
View all notes |
Alert me of new notes |
CANSLIM.net Company Profile |
SEC |
Zacks Reports |
StockTalk |
News |
Chart |
Request a new note
C
A N
S L
I M
|
GMCR
-
NASDAQ
Green Mtn Coffee Roastrs
FOOD and BEVERAGE - Processed and Packaged Goods
|
$35.97
|
+0.54
1.52% |
$36.53
|
2,847,363
117.06% of 50 DAV
50 DAV is 2,432,500
|
$35.94
0.08%
|
8/17/2010
|
$33.62
|
PP = $33.30
|
|
MB = $34.97
|
Most Recent Note - 9/20/2010 5:32:00 PM
G - Hit another new 52-week high today. Extended from its prior highs in the $33 area that define support to watch.
>>> The latest Featured Stock Update with an annotated graph appeared on 8/17/2010. Click here.
View all notes |
Alert me of new notes |
CANSLIM.net Company Profile |
SEC |
Zacks Reports |
StockTalk |
News |
Chart |
Request a new note
C
A N
S L
I M
|
Symbol/Exchange
Company Name
Industry Group |
PRICE |
CHANGE
(%Change) |
Day High |
Volume
(% DAV)
(% 50 day avg vol) |
52 Wk Hi
% From Hi |
Featured
Date |
Price
Featured |
Pivot Featured |
|
Max Buy |
HS
-
NYSE
Healthspring Inc
HEALTH SERVICES - Health Care Plans
|
$23.35
|
+0.55
2.41% |
$23.44
|
879,325
135.36% of 50 DAV
50 DAV is 649,600
|
$23.47
-0.51%
|
8/27/2010
|
$19.91
|
PP = $19.75
|
|
MB = $20.74
|
Most Recent Note - 9/20/2010 2:29:59 PM
G - Still holding its ground and trading in a tight range near its 52-week high. Extended from its prior base, support to watch now is prior chart highs in the $19-20 area.
>>> The latest Featured Stock Update with an annotated graph appeared on 8/27/2010. Click here.
View all notes |
Alert me of new notes |
CANSLIM.net Company Profile |
SEC |
Zacks Reports |
StockTalk |
News |
Chart |
Request a new note
C
A N
S L
I M
|
IGTE
-
NASDAQ
Igate Corp
COMPUTER SOFTWARE and SERVICES - Information Technology Service
|
$19.17
|
+1.55
8.80% |
$19.44
|
846,803
203.12% of 50 DAV
50 DAV is 416,900
|
$18.80
1.97%
|
9/8/2010
|
$17.29
|
PP = $18.26
|
|
MB = $19.17
|
Most Recent Note - 9/20/2010 12:41:11 PM
Y - Gapped up today and it has rallied above its pivot point to a new 52-week high. Found prompt support at its 50 DMA line on the prior session. No overhead supply remains to act as resistance after its "late stage" base pattern.
>>> The latest Featured Stock Update with an annotated graph appeared on 9/10/2010. Click here.
View all notes |
Alert me of new notes |
CANSLIM.net Company Profile |
SEC |
Zacks Reports |
StockTalk |
News |
Chart |
Request a new note
C
A N
S L
I M
|
JOBS
-
NASDAQ
Fifty One Job Inc Ads
DIVERSIFIED SERVICES - Staffing and; Outsourcing Service
|
$35.36
|
-0.65
-1.81% |
$36.00
|
336,897
297.61% of 50 DAV
50 DAV is 113,200
|
$36.19
-2.29%
|
9/16/2010
|
$31.59
|
PP = $30.40
|
|
MB = $31.92
|
Most Recent Note - 9/20/2010 12:42:54 PM
G - Pulling back today after 2 considerable gains with heavy volume. Prior highs in the $30 area define chart support now.
>>> The latest Featured Stock Update with an annotated graph appeared on 9/16/2010. Click here.
View all notes |
Alert me of new notes |
CANSLIM.net Company Profile |
SEC |
Zacks Reports |
StockTalk |
News |
Chart |
Request a new note
C
A N
S L
I M
|
MELI
-
NASDAQ
Mercadolibre Inc
INTERNET - Internet Software and; Services
|
$72.73
|
+0.25
0.34% |
$73.26
|
779,893
93.36% of 50 DAV
50 DAV is 835,400
|
$74.78
-2.74%
|
5/13/2010
|
$54.21
|
PP = $55.85
|
|
MB = $58.64
|
Most Recent Note - 9/17/2010 10:18:51 AM
G - Gapped down today. In recent weeks it wedged to new high ground with light volume behind gains as it got extended from a sound base. Its 50 DMA line defines important chart support.
>>> The latest Featured Stock Update with an annotated graph appeared on 8/26/2010. Click here.
View all notes |
Alert me of new notes |
CANSLIM.net Company Profile |
SEC |
Zacks Reports |
StockTalk |
News |
Chart |
Request a new note
C
A N
S L
I M
|
MRX
-
NYSE
Medicis Pharmaceut Cl A
DRUGS - Biotechnology
|
$29.85
|
+0.64
2.19% |
$29.90
|
1,097,079
91.81% of 50 DAV
50 DAV is 1,194,900
|
$30.26
-1.35%
|
8/12/2010
|
$26.88
|
PP = $26.71
|
|
MB = $28.05
|
Most Recent Note - 9/20/2010 5:23:56 PM
G - Gain today with near average volume for a new 2010 high close. Prior highs in the $28 area define the initial chart support level to watch.
>>> The latest Featured Stock Update with an annotated graph appeared on 8/12/2010. Click here.
View all notes |
Alert me of new notes |
CANSLIM.net Company Profile |
SEC |
Zacks Reports |
StockTalk |
News |
Chart |
Request a new note
C
A N
S L
I M
|
Symbol/Exchange
Company Name
Industry Group |
PRICE |
CHANGE
(%Change) |
Day High |
Volume
(% DAV)
(% 50 day avg vol) |
52 Wk Hi
% From Hi |
Featured
Date |
Price
Featured |
Pivot Featured |
|
Max Buy |
MWIV
-
NASDAQ
M W I Veterinary Supply
HEALTH SERVICES - Medical Instruments and; Supplies
|
$57.50
|
+2.32
4.20% |
$57.50
|
117,934
161.55% of 50 DAV
50 DAV is 73,000
|
$57.34
0.28%
|
7/29/2010
|
$52.05
|
PP = $52.09
|
|
MB = $54.69
|
Most Recent Note - 9/20/2010 2:26:58 PM
G - Gain today has it quietly rising further above its "max buy" level, poised for a new high close. Its 50 DMA line defines important chart support.
>>> The latest Featured Stock Update with an annotated graph appeared on 9/7/2010. Click here.
View all notes |
Alert me of new notes |
CANSLIM.net Company Profile |
SEC |
Zacks Reports |
StockTalk |
News |
Chart |
Request a new note
C
A N
S L
I M
|
NEM
-
NYSE
Newmont Mining Corp
METALS and MINING - Gold
|
$63.27
|
+0.26
0.41% |
$63.49
|
4,615,680
72.89% of 50 DAV
50 DAV is 6,332,200
|
$64.03
-1.19%
|
8/31/2010
|
$61.32
|
PP = $63.48
|
|
MB = $66.65
|
Most Recent Note - 9/20/2010 5:35:08 PM
Y - Gain today with below above average volume for a new high close near its pivot point. No overhead supply remains to hinder its progress. Leadership in the Mining - Gold/Silver/Gems group (L criteria) is a nice reassurance.
>>> The latest Featured Stock Update with an annotated graph appeared on 9/14/2010. Click here.
View all notes |
Alert me of new notes |
CANSLIM.net Company Profile |
SEC |
Zacks Reports |
StockTalk |
News |
Chart |
Request a new note
C
A N
S L
I M
|
NEOG
-
NASDAQ
Neogen Corp
DRUGS - Diagnostic Substances
|
$32.83
|
+0.94
2.95% |
$32.90
|
112,247
115.72% of 50 DAV
50 DAV is 97,000
|
$32.42
1.26%
|
9/1/2010
|
$30.79
|
PP = $30.49
|
|
MB = $32.01
|
Most Recent Note - 9/20/2010 5:11:37 PM
G- Gain today for a new 52-week high. Color code is changed to green after rallying beyond "max buy" level. Due to report earnings news on Thursday, September 23rd. Prior highs in the $30 area define initial support to watch.
>>> The latest Featured Stock Update with an annotated graph appeared on 8/20/2010. Click here.
View all notes |
Alert me of new notes |
CANSLIM.net Company Profile |
SEC |
Zacks Reports |
StockTalk |
News |
Chart |
Request a new note
C
A N
S L
I M
|
NFLX
-
NASDAQ
Netflix Inc
SPECIALTY RETAIL - Music and Video Stores
|
$142.89
|
+2.43
1.73% |
$143.90
|
5,286,845
110.95% of 50 DAV
50 DAV is 4,764,900
|
$149.95
-4.71%
|
8/10/2010
|
$124.05
|
PP = $124.00
|
|
MB = $130.20
|
Most Recent Note - 9/20/2010 5:39:49 PM
G - Gain today with higher volume after 4 consecutive small losses with lighter than average volume totals. Its 50 DMA line defines important support to watch.
>>> The latest Featured Stock Update with an annotated graph appeared on 8/10/2010. Click here.
View all notes |
Alert me of new notes |
CANSLIM.net Company Profile |
SEC |
Zacks Reports |
StockTalk |
News |
Chart |
Request a new note
C
A N
S L
I M
|
NTAP
-
NASDAQ
Netapp Inc
COMPUTER HARDWARE - Data Storage Devices
|
$49.67
|
+0.63
1.28% |
$49.86
|
6,432,468
83.88% of 50 DAV
50 DAV is 7,668,200
|
$49.56
0.22%
|
9/8/2010
|
$46.98
|
PP = $44.99
|
|
MB = $47.24
|
Most Recent Note - 9/20/2010 5:33:13 PM
G - Hit yet another new 52-week high today, getting more extended from a sound base. Support to watch is at prior chart highs near its latest pivot point.
>>> The latest Featured Stock Update with an annotated graph appeared on 9/8/2010. Click here.
View all notes |
Alert me of new notes |
CANSLIM.net Company Profile |
SEC |
Zacks Reports |
StockTalk |
News |
Chart |
Request a new note
C
A N
S L
I M
|
Symbol/Exchange
Company Name
Industry Group |
PRICE |
CHANGE
(%Change) |
Day High |
Volume
(% DAV)
(% 50 day avg vol) |
52 Wk Hi
% From Hi |
Featured
Date |
Price
Featured |
Pivot Featured |
|
Max Buy |
ORCL
-
NASDAQ
Oracle Corp
COMPUTER SOFTWARE and SERVICES - Application Software
|
$27.49
|
+0.01
0.04% |
$27.57
|
49,722,726
153.11% of 50 DAV
50 DAV is 32,474,200
|
$27.63
-0.49%
|
9/20/2010
|
$27.32
|
PP = $26.73
|
|
MB = $28.07
|
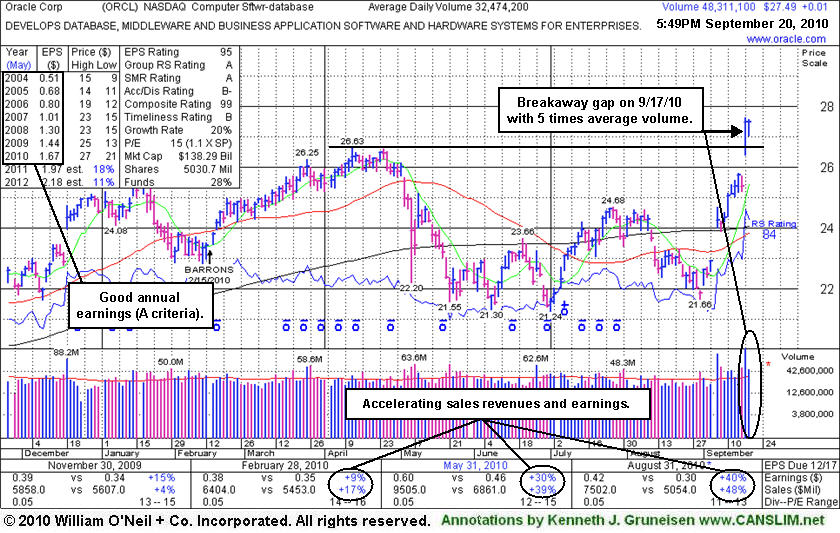
Most Recent Note - 9/20/2010 1:09:12 PM
Y - Pulling back today after a "breakaway gap" on the prior session with 5 times average volume. It has maintained a strong annual earnings (A criteria) history and sales revenues and earnings increases have shown impressive acceleration in its recent quarterly comparisons. Large supply of 5.03 billion shares outstanding makes it an unlikely sprinter.
>>> The latest Featured Stock Update with an annotated graph appeared on 9/20/2010. Click here.
View all notes |
Alert me of new notes |
CANSLIM.net Company Profile |
SEC |
Zacks Reports |
StockTalk |
News |
Chart |
Request a new note
C
A N
S L
I M
|
PAY
-
NYSE
Verifone Systems Inc
COMPUTER HARDWARE - Transaction Automation Systems
|
$29.50
|
+1.00
3.51% |
$29.54
|
1,645,649
126.56% of 50 DAV
50 DAV is 1,300,300
|
$28.74
2.64%
|
8/25/2010
|
$24.30
|
PP = $23.74
|
|
MB = $24.93
|
Most Recent Note - 9/20/2010 2:42:44 PM
G - Hitting yet another new 52-week high today, very extended from a sound base. Prior highs in the $23 area define chart support.
>>> The latest Featured Stock Update with an annotated graph appeared on 8/30/2010. Click here.
View all notes |
Alert me of new notes |
CANSLIM.net Company Profile |
SEC |
Zacks Reports |
StockTalk |
News |
Chart |
Request a new note
C
A N
S L
I M
|
PRGO
-
NASDAQ
Perrigo Co
DRUGS - Drug Related Products
|
$63.12
|
+1.17
1.89% |
$63.84
|
698,303
65.95% of 50 DAV
50 DAV is 1,058,800
|
$65.38
-3.46%
|
9/15/2010
|
$63.73
|
PP = $64.76
|
|
MB = $68.00
|
Most Recent Note - 9/20/2010 5:45:34 PM
Y - Gain today with light volume, closing -3.5% off its 52-week high. Distributional pressure was noted last week after, technically, it did not trigger a proper technical buy signal.
>>> The latest Featured Stock Update with an annotated graph appeared on 9/15/2010. Click here.
View all notes |
Alert me of new notes |
CANSLIM.net Company Profile |
SEC |
Zacks Reports |
StockTalk |
News |
Chart |
Request a new note
C
A N
S L
I M
|
ROVI
-
NASDAQ
Rovi Corp
COMPUTER SOFTWARE andamp; SERVICES - Security Software andamp; Services
|
$46.45
|
+3.89
9.14% |
$47.14
|
5,282,460
458.87% of 50 DAV
50 DAV is 1,151,200
|
$45.80
1.42%
|
8/31/2010
|
$43.31
|
PP = $45.06
|
|
MB = $47.31
|
Most Recent Note - 9/20/2010 1:09:56 PM
Y - Color code was changed to yellow after a gap up today helped it trade back above its pivot point and hit a new 52-week high. Following a violation of its 50 DMA line, its close in the upper third of its intra-day range on 9/17/10 was a reassuring sign of prompt support near that important short-term average.
>>> The latest Featured Stock Update with an annotated graph appeared on 8/24/2010. Click here.
View all notes |
Alert me of new notes |
CANSLIM.net Company Profile |
SEC |
Zacks Reports |
StockTalk |
News |
Chart |
Request a new note
C
A N
S L
I M
|
SHOO
-
NASDAQ
Steven Madden Limited
CONSUMER NON-DURABLES - Textile - Apparel Footwear
|
$39.63
|
+0.79
2.03% |
$39.80
|
345,660
79.81% of 50 DAV
50 DAV is 433,100
|
$40.98
-3.29%
|
9/15/2010
|
$38.94
|
PP = $40.27
|
|
MB = $42.28
|
Most Recent Note - 9/20/2010 5:26:09 PM
Y - Gain today with light volume helped it close 2 cents above its August high close and -3.3% from its 52-week high. New pivot point was cited based on its 7/30/10 high plus ten cents.
>>> The latest Featured Stock Update with an annotated graph appeared on 8/5/2010. Click here.
View all notes |
Alert me of new notes |
CANSLIM.net Company Profile |
SEC |
Zacks Reports |
StockTalk |
News |
Chart |
Request a new note
C
A N
S L
I M
|
Symbol/Exchange
Company Name
Industry Group |
PRICE |
CHANGE
(%Change) |
Day High |
Volume
(% DAV)
(% 50 day avg vol) |
52 Wk Hi
% From Hi |
Featured
Date |
Price
Featured |
Pivot Featured |
|
Max Buy |
SLW
-
NYSE
Silver Wheaton Corp
METALS and; MINING - Silver
|
$25.09
|
+0.07
0.28% |
$25.37
|
5,831,073
123.40% of 50 DAV
50 DAV is 4,725,400
|
$25.56
-1.84%
|
8/25/2010
|
$21.40
|
PP = $21.99
|
|
MB = $23.09
|
Most Recent Note - 9/16/2010 1:08:58 PM
G - Inching higher today, it has been stubbornly holding its ground after recent gains to new all-time highs. Extended from any sound base, its previous highs in the $21 area define chart support to watch.
>>> The latest Featured Stock Update with an annotated graph appeared on 8/25/2010. Click here.
View all notes |
Alert me of new notes |
CANSLIM.net Company Profile |
SEC |
Zacks Reports |
StockTalk |
News |
Chart |
Request a new note
C
A N
S L
I M
|
UA
-
NYSE
Under Armour Inc Cl A
CONSUMER NON-DURABLES - Textile - Apparel Clothing
|
$45.23
|
+1.06
2.40% |
$45.28
|
694,965
92.48% of 50 DAV
50 DAV is 751,500
|
$44.36
1.96%
|
9/9/2010
|
$39.99
|
PP = $40.10
|
|
MB = $42.11
|
Most Recent Note - 9/20/2010 5:29:20 PM
G - Extended from its latest sound base pattern, it hit another new 52-week high today with its 14th consecutive gain.
>>> The latest Featured Stock Update with an annotated graph appeared on 9/9/2010. Click here.
View all notes |
Alert me of new notes |
CANSLIM.net Company Profile |
SEC |
Zacks Reports |
StockTalk |
News |
Chart |
Request a new note
C
A N
S L
I M
|
UFPT
-
NASDAQ
U F P Tech Inc
CONSUMER NON-DURABLES - Packaging and Containers
|
$11.24
|
+0.01
0.09% |
$11.37
|
45,553
118.32% of 50 DAV
50 DAV is 38,500
|
$11.59
-3.02%
|
9/16/2010
|
$11.20
|
PP = $11.69
|
|
MB = $12.27
|
Most Recent Note - 9/20/2010 1:16:03 PM
Y - Posting a 6th consecutive gain today, and no resistance remains due to overhead supply. Disciplined investors know that a proper technical buy signal requires a breakout on heavy volume.
>>> The latest Featured Stock Update with an annotated graph appeared on 9/17/2010. Click here.
View all notes |
Alert me of new notes |
CANSLIM.net Company Profile |
SEC |
Zacks Reports |
StockTalk |
News |
Chart |
Request a new note
C
A N
S L
I M
|
ULTA
-
NASDAQ
Ulta Salon Cosm & Frag
SPECIALTY RETAIL - Specialty Retail, Other
|
$28.23
|
+0.08
0.28% |
$28.33
|
504,859
85.42% of 50 DAV
50 DAV is 591,000
|
$29.25
-3.49%
|
9/3/2010
|
$26.36
|
PP = $25.89
|
|
MB = $27.18
|
Most Recent Note - 9/15/2010 5:10:53 PM
G - Pulled back on lighter volume today after considerable gains for new 52-week highs with above average volume. Its color code was changed to green after getting extended from its latest base.
>>> The latest Featured Stock Update with an annotated graph appeared on 9/3/2010. Click here.
View all notes |
Alert me of new notes |
CANSLIM.net Company Profile |
SEC |
Zacks Reports |
StockTalk |
News |
Chart |
Request a new note
C
A N
S L
I M
|
VIT
-
NYSE
Vanceinfo Tech Inc Ads
COMPUTER SOFTWARE and SERVICES - Business Software and Services
|
$30.94
|
+1.52
5.17% |
$31.42
|
1,284,674
239.23% of 50 DAV
50 DAV is 537,000
|
$30.50
1.44%
|
7/8/2010
|
$25.20
|
PP = $26.58
|
|
MB = $27.91
|
Most Recent Note - 9/20/2010 1:17:59 PM
G - Gain today after gapping up helped it match its all-time high. Its 50 DMA line defines chart support to watch.
>>> The latest Featured Stock Update with an annotated graph appeared on 8/31/2010. Click here.
View all notes |
Alert me of new notes |
CANSLIM.net Company Profile |
SEC |
Zacks Reports |
StockTalk |
News |
Chart |
Request a new note
C
A N
S L
I M
|
Symbol/Exchange
Company Name
Industry Group |
PRICE |
CHANGE
(%Change) |
Day High |
Volume
(% DAV)
(% 50 day avg vol) |
52 Wk Hi
% From Hi |
Featured
Date |
Price
Featured |
Pivot Featured |
|
Max Buy |
WCRX
-
NASDAQ
Warner Chilcott Plc
DRUGS - Drug Manufacturers - Other
|
$23.35
|
+0.60
2.64% |
$23.40
|
2,144,776
92.19% of 50 DAV
50 DAV is 2,326,500
|
$22.90
1.97%
|
8/23/2010
|
$21.04
|
PP = $20.84
|
|
MB = $21.88
|
Most Recent Note - 9/20/2010 5:17:09 PM
G - Gain today with near average volume for yet another new all-time high. Color code was changed to green after getting extended from its prior base. (Featured price, pivot point, and max buy data are adjusted -$8.50 following recent cash dividend.)
>>> The latest Featured Stock Update with an annotated graph appeared on 8/23/2010. Click here.
View all notes |
Alert me of new notes |
CANSLIM.net Company Profile |
SEC |
Zacks Reports |
StockTalk |
News |
Chart |
Request a new note
C
A N
S L
I M
|