You are not logged in.
This means you
CAN ONLY VIEW reports that were published prior to Monday, April 14, 2025.
You
MUST UPGRADE YOUR MEMBERSHIP if you want to see any current reports.
AFTER MARKET UPDATE - FRIDAY, SEPTEMBER 19TH, 2014
Previous After Market Report Next After Market Report >>>
|
|
|
|
DOW |
+13.75 |
17,279.74 |
+0.08% |
|
Volume |
1,833,818,790 |
+177% |
|
Volume |
2,672,879,020 |
+64% |
|
NASDAQ |
-13.64 |
4,579.79 |
-0.30% |
|
Advancers |
1,197 |
38% |
|
Advancers |
1,004 |
34% |
|
S&P 500 |
-0.96 |
2,010.40 |
-0.05% |
|
Decliners |
1,827 |
58% |
|
Decliners |
1,906 |
64% |
|
Russell 2000 |
-12.36 |
1,146.92 |
-1.07% |
|
52 Wk Highs |
119 |
|
|
52 Wk Highs |
90 |
|
|
S&P 600 |
-7.35 |
658.30 |
-1.10% |
|
52 Wk Lows |
97 |
|
|
52 Wk Lows |
107 |
|
|
 |
Breadth Positive While Volume Totals Surged
Kenneth J. Gruneisen - Passed the CAN SLIM® Master's Exam
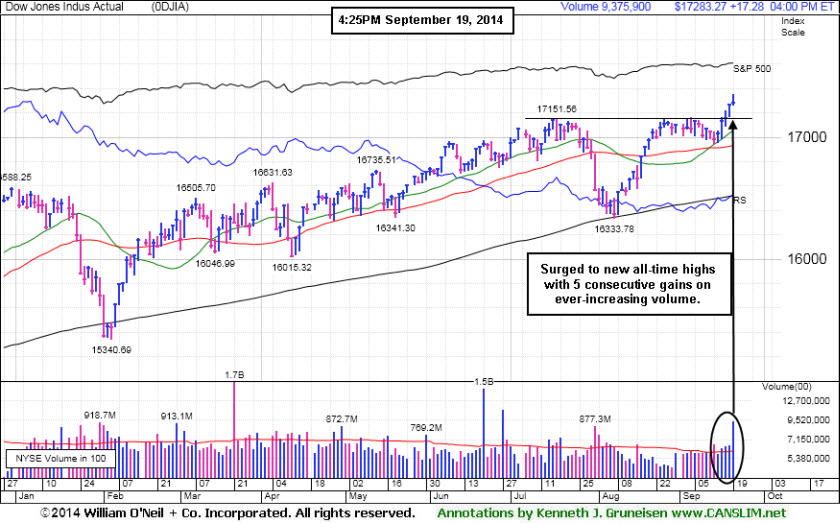
Overall, the major averages finished higher on the week for the sixth time in seven weeks. The Dow posted a weekly advance of +1.7%, the S&P gained +1.3% and the NASDAQ added +0.3%. On Friday the major averages ended mixed. Volume totals were reported much higher than the prior session totals on the NYSE and on the Nasdaq exchange, inflated by options expirations. Breadth was negative as decliners led advancers by a 3-2 margin on the NYSE and by nearly a 2-1 margin on the NASDAQ exchange. Leadership improved again as there were 60 high-ranked companies from the CANSLIM.net Leaders List that made new 52-week highs and appeared on the CANSLIM.net BreakOuts Page, up from the prior session total of 49 stocks. New 52-week highs outnumbered new lows on the NYSE but new lows outnumbered new highs on the Nasdaq exchange. There were gains for 7 of the 11 high-ranked companies currently included on the Featured Stocks Page. The broader market (M criteria) overcame recent distributional pressure while leadership (stocks hitting new 52-week highs) remained healthy. Remember that disciplined investors buy stocks with superior fundamentals only after they have triggered a proper technical buy signal.
PICTURED: The Dow Jones Industrial Average surged to 17,279 as it gained 13 points to new record highs with a 5th consecutive gain on ever-increasing volume. The Blue Chip index is up +4.26% year-to-date.
The major averages finished flat on Friday. The S&P 500 Index was virtually unchanged as it lost less than a point to 2,010. The NASDAQ Composite Index declined 13 points to 4,579.
Stocks toggled between gains and losses as investors digested the largest IPO in U.S. history. Alibaba Group (BABA +37.8%) debuted on the NYSE and its shares rallied. On the economic front, the leading indicators index rose by a less than expected 0.2% in August following largest gain since March 2011.
Six of the 10 S&P 500 sectors advanced. Telecom and utilities were the best performing groups. Verizon (VZ +1.3%) and Southern Co (SO +1%) rose. Technology and financials lagged behind. Oracle (ORCL -4%) fell after Larry Ellison stepped down as CEO. AIG (AIG -1.8%) ended lower.
Treasuries staged a rally. The 10-year note rose 10/32 to yield 2.58%. The 30-year bond gained a full point to yield 3.29%.
The CANSLIM.net Featured Stocks Page shows the most action-worthy candidates and their latest notes and a Headline Link directs members to the latest detailed analysis with data-packed graphs annotated by a Certified expert along with links to additional resources. The Premium Member Homepage includes "dynamic archives" to all prior pay reports published.
|
 Kenneth J. Gruneisen started out as a licensed stockbroker in August 1987, a couple of months prior to the historic stock market crash that took the Dow Jones Industrial Average down -22.6% in a single day. He has published daily fact-based fundamental and technical analysis on high-ranked stocks online for two decades. Through FACTBASEDINVESTING.COM, Kenneth provides educational articles, news, market commentary, and other information regarding proven investment systems that work in good times and bad.
Comments contained in the body of this report are technical opinions only and are not necessarily those of Gruneisen Growth Corp. The material herein has been obtained from sources believed to be reliable and accurate, however, its accuracy and completeness cannot be guaranteed. Our firm, employees, and customers may effect transactions, including transactions contrary to any recommendation herein, or have positions in the securities mentioned herein or options with respect thereto. Any recommendation contained in this report may not be suitable for all investors and it is not to be deemed an offer or solicitation on our part with respect to the purchase or sale of any securities. |
|
 |
Gold & Silver, Tech, and Financial Indexes Fell
Kenneth J. Gruneisen - Passed the CAN SLIM® Master's Exam
In the tech sector, the Semiconductor Index ($SOX -1.19%) and Networking Index ($NWX -1.18%) fell more than -1% each while the Biotechnology Index ($BTK -0.19%) did a better job of holding its ground. Financial shares created a negative drag on the major averages as the Broker/Dealer Index ($XBD -0.90%) outpaced the Bank Index ($BKX -0.37%) to the downside while Retail Index ($RLX +0.06%) held its ground. The Oil Services Index ($OSX -0.89%) slumped while the Integrated Oil Index ($XOI +0.06%) finished flat. The Gold & Silver Index ($XAU -2.48%) was a standout decliner with a large loss.
Charts courtesy www.stockcharts.com
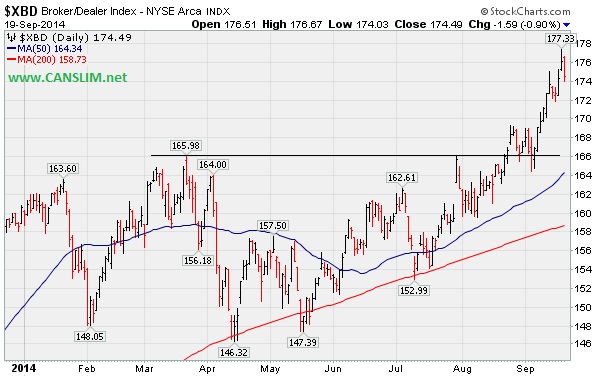
PICTURED: The Broker/Dealer Index ($XBD -0.90%) fell on Friday, yet it has surged into new high territory in a reassuring manner, as financials are important "leading indicators" for the broader market.
| Oil Services |
$OSX |
276.55 |
-2.47 |
-0.89% |
-1.59% |
| Integrated Oil |
$XOI |
1,618.19 |
+0.99 |
+0.06% |
+7.65% |
| Semiconductor |
$SOX |
649.54 |
-7.82 |
-1.19% |
+21.40% |
| Networking |
$NWX |
335.98 |
-4.01 |
-1.18% |
+3.72% |
| Broker/Dealer |
$XBD |
174.49 |
-1.59 |
-0.90% |
+8.67% |
| Retail |
$RLX |
949.97 |
+0.53 |
+0.06% |
+1.08% |
| Gold & Silver |
$XAU |
86.93 |
-2.21 |
-2.48% |
+3.30% |
| Bank |
$BKX |
73.69 |
-0.27 |
-0.37% |
+6.40% |
| Biotech |
$BTK |
3,108.26 |
-5.97 |
-0.19% |
+33.38% |
|
|
|
 |
Finally Volume-backed Gains Confirmed a Technical Buy Signal
Kenneth J. Gruneisen - Passed the CAN SLIM® Master's Exam
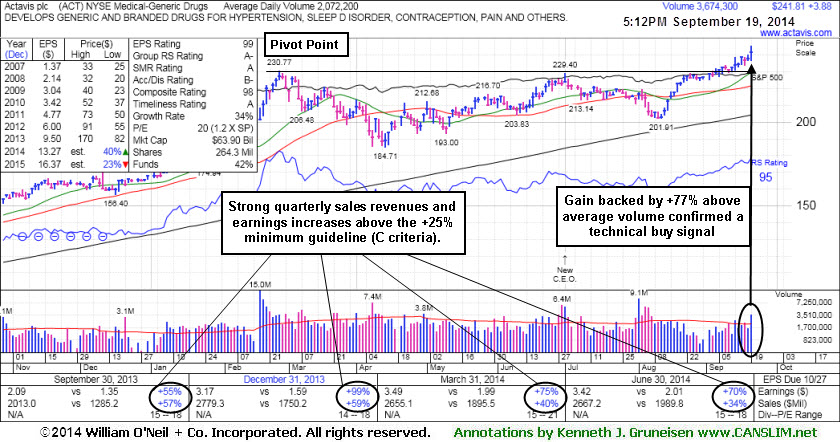
Actavis plc (ACT +$3.88 or +1.63% to $241.81) hit new 52-week and all-tie highs as it rose today approaching its "max buy" level with +77% above average volume behind its gain. The bullish session help to confirm a technical buy signal. It had recently been wedging into new 52-week high territory with gains lacking great volume conviction, and prior notes cautioned members - "Gains above a stock's pivot point must be backed by a minimum of +40% above average volume to trigger a technical buy signal."
Its Accumulation/Distribution Rating has improved from a D to a B- since last shown in this FSU section on 8/28/14 with annotated graphs under the headline, "Quietly Perched Within Striking Distance of 52-Week High". Its streak of gains and rebound above its 50-day moving average (DMA) line helped its outlook improve after it had sputtered since highlighted in yellow in the 6/20/14 mid-day report (read here) with a pivot point based on its 2/26/14 high plus 10 cents.
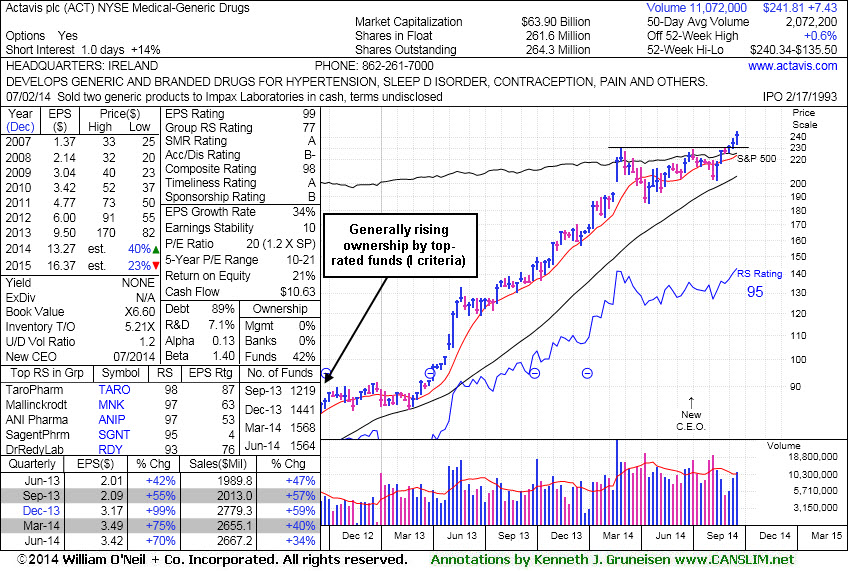
The Medical - Generic Drugs industry group currently has a 77 Group Relative Strength Rating, up from a 66 when shown on 8/28/14. Leadership from other issues in the group is also a reassuring sign concerning the L criteria. It reported earnings +70% on +34% sales revenues for the Jun '14 quarter, and its strong record satisfies the C criteria. Its annual earnings (A criteria) history has also been strong. The number of top-rated funds owning its shares has generally been on the rise, up from 1,219 in Sep '13 to 1,564 in Jun '14, a reassuring sign concerning the I criteria.
|
|
|
Color Codes Explained :
Y - Better candidates highlighted by our
staff of experts.
G - Previously featured
in past reports as yellow but may no longer be buyable under the
guidelines.
***Last / Change / Volume data in this table is the closing quote data***
Symbol/Exchange
Company Name
Industry Group |
PRICE |
CHANGE
(%Change) |
Day High |
Volume
(% DAV)
(% 50 day avg vol) |
52 Wk Hi
% From Hi |
Featured
Date |
Price
Featured |
Pivot Featured |
|
Max Buy |
ACT
-
NYSE
Actavis plc
Medical-Generic Drugs
|
$241.81
|
+3.88
1.63% |
$245.50
|
3,676,989
177.46% of 50 DAV
50 DAV is 2,072,000
|
$240.34
0.61%
|
6/20/2014
|
$216.53
|
PP = $230.87
|
|
MB = $242.41
|
 Most Recent Note - 9/19/2014 5:44:29 PM
Y - Gain today for a new 52-week high backed by +77% above average volume confirmed a technical buy signal. Prior highs near $230 define near-term support to watch on pullbacks. See the latest FSU analysis for more details and new annotated graphs.
>>> FEATURED STOCK ARTICLE : Finally Volume-backed Gains Confirmed a Technical Buy Signal - 9/19/2014
View all notes |
Set NEW NOTE alert |
CANSLIM.net Company Profile |
SEC
News |
Chart |
Request a new note
C
A N
S L
I M


|
BITA
-
NYSE
Bitauto Hldgs Ltd Ads
Internet-Content
|
$83.68
|
-0.28
-0.33% |
$85.36
|
1,149,779
67.75% of 50 DAV
50 DAV is 1,697,000
|
$98.28
-14.86%
|
6/26/2014
|
$46.20
|
PP = $47.03
|
|
MB = $49.38
|
Most Recent Note - 9/18/2014 5:48:51 PM
G - Volume totals have been cooling after halting its slide. See the latest FSU analysis for more details and new annotated graphs. Noted repeatedly with caution - "Has the look of a 'climax run' with volume-driven gains getting very extended from its prior base."
>>> FEATURED STOCK ARTICLE : Volume Totals Recently Cooling After Halting Slide - 9/18/2014
View all notes |
Set NEW NOTE alert |
CANSLIM.net Company Profile |
SEC
News |
Chart |
Request a new note
C
A N
S L
I M
|
FB
-
NASDAQ
Facebook Inc Cl A
INTERNET
|
$77.91
|
+0.91
1.18% |
$78.30
|
76,620,254
215.41% of 50 DAV
50 DAV is 35,570,000
|
$78.36
-0.57%
|
9/9/2014
|
$76.67
|
PP = $76.84
|
|
MB = $80.68
|
Most Recent Note - 9/19/2014 5:50:11 PM
Y - Rallied with 2 times average volume for its second best close today. The volume-driven gain helped confirm a new (or add-on) technical buy signal. Found support at its 50 DMA line ($73.77) this week after a light bout of distributional pressure.
>>> FEATURED STOCK ARTICLE : Wedging Gains Not Indicative of Institutional Conviction - 9/9/2014
View all notes |
Set NEW NOTE alert |
CANSLIM.net Company Profile |
SEC
News |
Chart |
Request a new note
C
A N
S L
I M
|
NVGS
-
NYSE
Navigator Holdings Ltd
Transportation-Ship
|
$31.49
|
+0.19
0.61% |
$31.86
|
481,211
217.74% of 50 DAV
50 DAV is 221,000
|
$31.90
-1.29%
|
9/16/2014
|
$30.33
|
PP = $30.56
|
|
MB = $32.09
|
Most Recent Note - 9/19/2014 1:03:40 PM
Y - Holding its ground perched at a new 52-week high (N criteria) after volume-driven gains triggered a technical buy signal. Highlighted in yellow in the 9/16/14 mid-day report (read here). Prior highs near $30 define initial support to watch on pullbacks. Disciplined investors do not chase stocks more than +5% above their pivot point, and they always limit losses by selling if any stock falls more than -7% from their purchase price. See the latest FSU analysis for more details and annotated graphs.
>>> FEATURED STOCK ARTICLE : Finished Strong While Challenging Pivot Point and Recent Highs - 9/16/2014
View all notes |
Set NEW NOTE alert |
CANSLIM.net Company Profile |
SEC
News |
Chart |
Request a new note
C
A N
S L
I M
|
NXPI
-
NASDAQ
Nxp Semiconductors N V
ELECTRONICS - Semiconductor - Broad Line
|
$71.99
|
-1.03
-1.40% |
$73.82
|
4,107,168
123.41% of 50 DAV
50 DAV is 3,328,000
|
$73.71
-2.34%
|
8/29/2014
|
$68.50
|
PP = $67.89
|
|
MB = $71.28
|
Most Recent Note - 9/18/2014 12:57:39 PM
G - Color code is changed to green while challenging its 52-week high and rallying above its "max buy" level. No overhead supply remains to act as resistance. Prior highs in the $67 area define initial support to watch on pullbacks. See the latest FSU analysis for more details and annotated graphs.
>>> FEATURED STOCK ARTICLE : Consolidating Above Pivot Point and Below "Max Buy" Level - 9/17/2014
View all notes |
Set NEW NOTE alert |
CANSLIM.net Company Profile |
SEC
News |
Chart |
Request a new note
C
A N
S L
I M
|
Symbol/Exchange
Company Name
Industry Group |
PRICE |
CHANGE
(%Change) |
Day High |
Volume
(% DAV)
(% 50 day avg vol) |
52 Wk Hi
% From Hi |
Featured
Date |
Price
Featured |
Pivot Featured |
|
Max Buy |
PANW
-
NYSE
Palo Alto Networks
Computer Sftwr-Security
|
$99.28
|
+0.33
0.33% |
$99.46
|
2,103,121
128.95% of 50 DAV
50 DAV is 1,631,000
|
$102.45
-3.09%
|
7/30/2014
|
$84.21
|
PP = $85.88
|
|
MB = $90.17
|
Most Recent Note - 9/18/2014 1:00:08 PM
G - Stubbornly holding its ground near its 52-week high, extended from any sound base. Prior highs in the $87 area define initial support to watch above its 50 DMA line ($84.97). Disciplined investors avoid chasing extended stocks.
>>> FEATURED STOCK ARTICLE : Pulling Back Following New Technical Breakout - 9/4/2014
View all notes |
Set NEW NOTE alert |
CANSLIM.net Company Profile |
SEC
News |
Chart |
Request a new note
C
A N
S L
I M
|
STRT
-
NASDAQ
Strattec Security Corp
AUTOMOTIVE - Auto Parts
|
$87.25
|
+1.86
2.18% |
$87.85
|
55,184
262.78% of 50 DAV
50 DAV is 21,000
|
$89.87
-2.92%
|
9/19/2014
|
$86.06
|
PP = $89.97
|
|
MB = $94.47
|
Most Recent Note - 9/19/2014 1:24:40 PM
Y - Forming an advanced "3-weeks tight" base while holding its ground stubbornly. Subsequent volume-driven gains above the new pivot point cited may trigger a new (or add-on) technical buy signal. Prior highs in the $74-77 area define initial support to watch on pullbacks.
>>> FEATURED STOCK ARTICLE : Extended From Prior Highs and Previously Noted Base - 9/10/2014
View all notes |
Set NEW NOTE alert |
CANSLIM.net Company Profile |
SEC
News |
Chart |
Request a new note
C
A N
S L
I M
|
TARO
-
NYSE
Taro Pharmaceutical Inds
DRUGS - Drug Manufacturers - Other
|
$159.21
|
-0.71
-0.44% |
$161.49
|
24,770
28.47% of 50 DAV
50 DAV is 87,000
|
$165.30
-3.68%
|
7/30/2014
|
$144.24
|
PP = $149.99
|
|
MB = $157.49
|
Most Recent Note - 9/18/2014 1:03:24 PM
G - Consolidating above its 50 DMA line and -3.2% off its 52-week high. Recently enduring distributional pressure and noted with caution - "Extended from any sound base. Recently reported earnings for the Jun '14 quarter below the +25% minimum earnings guideline (C criteria) raising fundamental concerns."
>>> FEATURED STOCK ARTICLE : Churning Action Indicative of Distributional Pressure - 9/2/2014
View all notes |
Set NEW NOTE alert |
CANSLIM.net Company Profile |
SEC
News |
Chart |
Request a new note
C
A N
S L
I M
|
TRN
-
NYSE
Trinity Industries Inc
TRANSPORTATION - Railroads
|
$50.30
|
+0.27
0.54% |
$50.77
|
4,237,316
170.11% of 50 DAV
50 DAV is 2,491,000
|
$50.43
-0.26%
|
4/30/2014
|
$37.79
|
PP = $38.03
|
|
MB = $39.93
|
Most Recent Note - 9/18/2014 1:04:38 PM
G - Poised for a best-ever close with today's 3rd consecutive gain. It has not formed a sound base. Prior highs near $46-47 define near-term support above its 50 DMA line.
>>> FEATURED STOCK ARTICLE : Consolidating Above 50-Day Moving Average Line - 9/12/2014
View all notes |
Set NEW NOTE alert |
CANSLIM.net Company Profile |
SEC
News |
Chart |
Request a new note
C
A N
S L
I M
|
UA
-
NYSE
Under Armour Inc Cl A
CONSUMER NON-DURABLES - Textile - Apparel Clothing
|
$68.41
|
-1.16
-1.67% |
$70.16
|
5,277,309
223.52% of 50 DAV
50 DAV is 2,361,000
|
$73.42
-6.82%
|
7/10/2014
|
$58.50
|
PP = $60.79
|
|
MB = $63.83
|
Most Recent Note - 9/19/2014 5:46:19 PM
G - Slumped toward its 50 DMA line ($67.51) with higher volume today, retreating from its 52-week high. Prior notes cautioned members - "Fundamental concerns were raised by earnings reported +0% on +34% sales revenues for the Jun '14 quarter, below the +25% minimum earnings guideline (C criteria)."
>>> FEATURED STOCK ARTICLE : Higher Volume Behind Loss Testing 50-Day Moving Average - 9/15/2014
View all notes |
Set NEW NOTE alert |
CANSLIM.net Company Profile |
SEC
News |
Chart |
Request a new note
C
A N
S L
I M
|
Symbol/Exchange
Company Name
Industry Group |
PRICE |
CHANGE
(%Change) |
Day High |
Volume
(% DAV)
(% 50 day avg vol) |
52 Wk Hi
% From Hi |
Featured
Date |
Price
Featured |
Pivot Featured |
|
Max Buy |
WLK
-
NYSE
Westlake Chemical Corp
CHEMICALS - Specialty Chemicals
|
$95.29
|
+0.77
0.81% |
$95.54
|
577,872
115.57% of 50 DAV
50 DAV is 500,000
|
$98.44
-3.20%
|
4/29/2014
|
$72.79
|
PP = $69.31
|
|
MB = $72.78
|
Most Recent Note - 9/16/2014 8:17:56 PM
G - Churned higher volume today while consolidating above prior highs in the $92 area defining support above its 50 DMA line. Subsequent violations would raise greater concerns and trigger technical sell signals. Technical strength has continued despite recent fundamental concerns.
>>> FEATURED STOCK ARTICLE : Consolidating Above Near-Term Support Levels - 9/11/2014
View all notes |
Set NEW NOTE alert |
CANSLIM.net Company Profile |
SEC
News |
Chart |
Request a new note
C
A N
S L
I M
|
|
|
|
THESE ARE NOT BUY RECOMMENDATIONS!
Comments contained in the body of this report are technical
opinions only. The material herein has been obtained
from sources believed to be reliable and accurate, however,
its accuracy and completeness cannot be guaranteed.
This site is not an investment advisor, hence it does
not endorse or recommend any securities or other investments.
Any recommendation contained in this report may not
be suitable for all investors and it is not to be deemed
an offer or solicitation on our part with respect to
the purchase or sale of any securities. All trademarks,
service marks and trade names appearing in this report
are the property of their respective owners, and are
likewise used for identification purposes only.
This report is a service available
only to active Paid Premium Members.
You may opt-out of receiving report notifications
at any time. Questions or comments may be submitted
by writing to Premium Membership Services 665 S.E. 10 Street, Suite 201 Deerfield Beach, FL 33441-5634 or by calling 1-800-965-8307
or 954-785-1121.
|
|
|