***Last / Change / Volume data in this table is the closing quote data***
Symbol/Exchange
Company Name
Industry Group |
PRICE |
CHANGE
(%Change) |
Day High |
Volume
(% DAV)
(% 50 day avg vol) |
52 Wk Hi
% From Hi |
Featured
Date |
Price
Featured |
Pivot Featured |
|
Max Buy |
ALXN
-
NASDAQ
Alexion Pharmaceuticals
DRUGS - Drug Manufacturers - Other
|
$113.97
|
+0.89
0.79% |
$114.37
|
1,113,096
92.96% of 50 DAV
50 DAV is 1,197,400
|
$113.09
0.78%
|
8/23/2012
|
$103.70
|
PP = $110.06
|
|
MB = $115.56
|
Most Recent Note - 9/18/2012 5:45:29 PM
Y - Volume totals have been below average for the past 4 sessions while wedging into new 52-week high territory. Gains above a stock's pivot point backed by a minimum of +40% above average volume are necessary to trigger a proper technical buy signal.
>>> The latest Featured Stock Update with an annotated graph appeared on 8/23/2012. Click here.
View all notes |
Alert me of new notes |
CANSLIM.net Company Profile |
SEC |
Zacks Reports |
StockTalk |
News |
Chart |
Request a new note
C
A N
S L
I M


|
ASPS
-
NASDAQ
Altisource Ptf Sltns Sa
REAL ESTATE - Property Management/Developmen
|
$89.46
|
+0.19
0.21% |
$90.10
|
37,238
28.56% of 50 DAV
50 DAV is 130,400
|
$92.29
-3.07%
|
6/5/2012
|
$60.01
|
PP = $63.00
|
|
MB = $66.15
|
Most Recent Note - 9/17/2012 3:58:14 PM
G - Quietly consolidating in a tight range perched -2.5% from its all-time high today. Recent lows define near-term support along with its 50 DMA line.
>>> The latest Featured Stock Update with an annotated graph appeared on 9/11/2012. Click here.
View all notes |
Alert me of new notes |
CANSLIM.net Company Profile |
SEC |
Zacks Reports |
StockTalk |
News |
Chart |
Request a new note
C
A N
S L
I M
|
CFNL
-
NASDAQ
Cardinal Financial Corp
BANKING - Regional - Southeast Banks
|
$14.42
|
+0.11
0.77% |
$14.53
|
107,882
173.72% of 50 DAV
50 DAV is 62,100
|
$14.51
-0.62%
|
8/17/2012
|
$12.84
|
PP = $13.31
|
|
MB = $13.98
|
 Most Recent Note - 9/19/2012 12:32:21 PM
G - Today's 7th consecutive gain helped it touch another new 52-week high, getting more extended from its prior base. Prior highs and its 50 DMA line define support to watch on pullbacks.
>>> The latest Featured Stock Update with an annotated graph appeared on 8/21/2012. Click here.
View all notes |
Alert me of new notes |
CANSLIM.net Company Profile |
SEC |
Zacks Reports |
StockTalk |
News |
Chart |
Request a new note
C
A N
S L
I M
|
CMCSA
-
NASDAQ
Comcast Corp Cl A
MEDIA - CATV Systems
|
$35.38
|
+0.54
1.54% |
$35.45
|
17,048,934
137.12% of 50 DAV
50 DAV is 12,433,200
|
$35.45
-0.20%
|
6/11/2012
|
$29.94
|
PP = $30.98
|
|
MB = $32.53
|
Most Recent Note - 9/19/2012 6:20:18 PM
G - Gain today with +37% above average volume while matching its 52-week high and closing at its best finish of the year. Wedging out of an orderly flat base without especially great volume conviction. No new pivot point was being cited because fundamental concerns were raised by sub par sales and earnings growth in the Jun '12 quarter.
>>> The latest Featured Stock Update with an annotated graph appeared on 8/15/2012. Click here.
View all notes |
Alert me of new notes |
CANSLIM.net Company Profile |
SEC |
Zacks Reports |
StockTalk |
News |
Chart |
Request a new note
C
A N
S L
I M
|
DVA
-
NYSE
Davita Inc
HEALTH SERVICES - Specialized Health Services
|
$98.57
|
-0.94
-0.94% |
$99.76
|
585,529
87.63% of 50 DAV
50 DAV is 668,200
|
$103.97
-5.19%
|
9/5/2012
|
$102.92
|
PP = $100.62
|
|
MB = $105.65
|
Most Recent Note - 9/14/2012 4:38:26 PM
Y - Enduring mild distributional pressure while consolidating above its 50 DMA line. A subsequent gain for a new high close above its pivot point backed by +40% above average volume is the bare minimum volume needed to trigger a technical buy signal.
>>> The latest Featured Stock Update with an annotated graph appeared on 9/5/2012. Click here.
View all notes |
Alert me of new notes |
CANSLIM.net Company Profile |
SEC |
Zacks Reports |
StockTalk |
News |
Chart |
Request a new note
C
A N
S L
I M
|
Symbol/Exchange
Company Name
Industry Group |
PRICE |
CHANGE
(%Change) |
Day High |
Volume
(% DAV)
(% 50 day avg vol) |
52 Wk Hi
% From Hi |
Featured
Date |
Price
Featured |
Pivot Featured |
|
Max Buy |
ECPG
-
NASDAQ
Encore Capital Group Inc
FINANCIAL SERVICES - Credit Services
|
$30.17
|
-0.37
-1.21% |
$30.70
|
99,504
82.44% of 50 DAV
50 DAV is 120,700
|
$30.91
-2.39%
|
8/3/2012
|
$29.91
|
PP = $30.45
|
|
MB = $31.97
|
Most Recent Note - 9/18/2012 5:41:25 PM
Y - Today's gain with +48% above average volume helped it inch above its pivot point for a best ever close, technically confirming a buy signal with its 5th consecutive small gain. Reassuring signs of accumulation have followed the Secondary Offering completed on 8/08/12.
>>> The latest Featured Stock Update with an annotated graph appeared on 9/12/2012. Click here.
View all notes |
Alert me of new notes |
CANSLIM.net Company Profile |
SEC |
Zacks Reports |
StockTalk |
News |
Chart |
Request a new note
C
A N
S L
I M
|
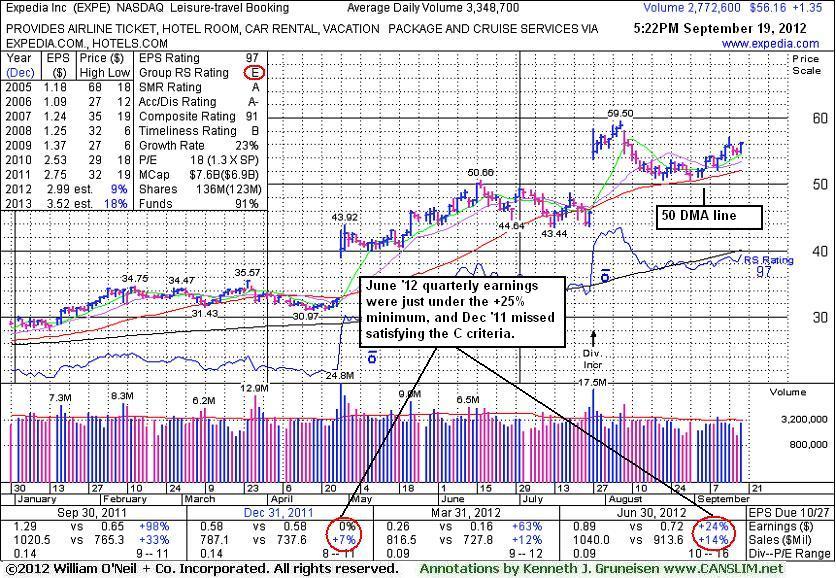
EXPE
-
NASDAQ
Expedia Inc
INTERNET - Internet Information Providers
|
$56.16
|
+1.35
2.46% |
$56.37
|
2,779,780
83.01% of 50 DAV
50 DAV is 3,348,700
|
$59.50
-5.61%
|
4/27/2012
|
$41.80
|
PP = $35.57
|
|
MB = $37.35
|
Most Recent Note - 9/19/2012 6:16:46 PM
G - Consolidating above its 50 DMA line defining important near-term chart support. See the latest FSU analysis for more details and a new annotated graph.
>>> The latest Featured Stock Update with an annotated graph appeared on 9/19/2012. Click here.
View all notes |
Alert me of new notes |
CANSLIM.net Company Profile |
SEC |
Zacks Reports |
StockTalk |
News |
Chart |
Request a new note
C
A N
S L
I M
|
GPX
-
NYSE
G P Strategies Corp
DIVERSIFIED SERVICES - Education and Training Services
|
$19.91
|
-0.06
-0.30% |
$20.03
|
48,901
69.07% of 50 DAV
50 DAV is 70,800
|
$20.67
-3.68%
|
6/29/2012
|
$18.01
|
PP = $18.15
|
|
MB = $19.06
|
Most Recent Note - 9/13/2012 7:07:01 PM
G - Consolidating in a tight trading range perched -4.2% off its 52-week high today, slightly extended from its prior base. Prior highs and its 50 DMA line define chart support in the $18 area. See latest FSU analysis for more details and a new annotated graph.
>>> The latest Featured Stock Update with an annotated graph appeared on 9/13/2012. Click here.
View all notes |
Alert me of new notes |
CANSLIM.net Company Profile |
SEC |
Zacks Reports |
StockTalk |
News |
Chart |
Request a new note
C
A N
S L
I M
|
KH
-
NYSE
China Kanghui Hldgs Ads
HEALTH SERVICES - Medical Appliances and Equipment
|
$25.08
|
-0.04
-0.16% |
$25.43
|
17,131
59.07% of 50 DAV
50 DAV is 29,000
|
$27.47
-8.70%
|
8/30/2012
|
$24.19
|
PP = $22.90
|
|
MB = $24.05
|
Most Recent Note - 9/17/2012 3:56:18 PM
G - Consolidating in a healthy fashion above prior highs defining chart support above its 50 DMA line. It is extended from its prior base.
>>> The latest Featured Stock Update with an annotated graph appeared on 8/30/2012. Click here.
View all notes |
Alert me of new notes |
CANSLIM.net Company Profile |
SEC |
Zacks Reports |
StockTalk |
News |
Chart |
Request a new note
C
A N
S L
I M
|
LKQ
-
NASDAQ
L K Q Corp
WHOLESALE - Auto Parts
|
$18.74
|
-0.08
-0.40% |
$19.01
|
1,702,660
132.16% of 50 DAV
50 DAV is 1,288,300
|
$20.02
-6.37%
|
8/9/2012
|
$37.93
|
PP = $37.44
|
|
MB = $39.31
|
Most Recent Note - 9/19/2012 8:59:35 AM
Y - Do not be confused by a 2:1 share split effective before the market open today (Featured Price, Pivot Point and Max Buy will be adjusted soon to account for the split). Loss on the prior session with more than twice average volume indicated distributional pressure as it sank near prior highs and its 50 DMA line previously noted as important chart support to watch on pullbacks.
>>> The latest Featured Stock Update with an annotated graph appeared on 9/17/2012. Click here.
View all notes |
Alert me of new notes |
CANSLIM.net Company Profile |
SEC |
Zacks Reports |
StockTalk |
News |
Chart |
Request a new note
C
A N
S L
I M
|
Symbol/Exchange
Company Name
Industry Group |
PRICE |
CHANGE
(%Change) |
Day High |
Volume
(% DAV)
(% 50 day avg vol) |
52 Wk Hi
% From Hi |
Featured
Date |
Price
Featured |
Pivot Featured |
|
Max Buy |
LNKD
-
NYSE
Linkedin Corp Class A
INTERNET - Internet Information Providers
|
$122.51
|
+1.08
0.89% |
$123.58
|
1,127,867
44.83% of 50 DAV
50 DAV is 2,515,800
|
$125.50
-2.38%
|
9/5/2012
|
$113.25
|
PP = $113.10
|
|
MB = $118.76
|
Most Recent Note - 9/14/2012 4:08:27 PM
G - Hit new 52-week and all-time highs today with a gain backed by above average volume. Prior highs near $113 define initial support to watch on pullbacks.
>>> The latest Featured Stock Update with an annotated graph appeared on 9/6/2012. Click here.
View all notes |
Alert me of new notes |
CANSLIM.net Company Profile |
SEC |
Zacks Reports |
StockTalk |
News |
Chart |
Request a new note
C
A N
S L
I M
|
MIDD
-
NASDAQ
Middleby Corp
MANUFACTURING - Diversified Machinery
|
$117.01
|
-1.49
-1.26% |
$119.19
|
42,782
40.82% of 50 DAV
50 DAV is 104,800
|
$122.57
-4.54%
|
8/9/2012
|
$118.60
|
PP = $104.92
|
|
MB = $110.17
|
Most Recent Note - 9/18/2012 5:25:56 PM
G - Perched -3.3% off its 52-week high today. Extended from its prior base, and its 50 DMA line and recent lows define near-term chart support to watch. See the latest FSU analysis for more details and a new annotated graph.
>>> The latest Featured Stock Update with an annotated graph appeared on 9/18/2012. Click here.
View all notes |
Alert me of new notes |
CANSLIM.net Company Profile |
SEC |
Zacks Reports |
StockTalk |
News |
Chart |
Request a new note
C
A N
S L
I M
|
N
-
NYSE
Netsuite Inc
DIVERSIFIED SERVICES - Business/Management Services
|
$62.51
|
+0.61
0.99% |
$63.25
|
403,854
62.40% of 50 DAV
50 DAV is 647,200
|
$63.23
-1.14%
|
8/20/2012
|
$55.88
|
PP = $59.32
|
|
MB = $62.29
|
Most Recent Note - 9/18/2012 5:47:10 PM
Y - Holding its ground near its 52-week high today. Rally above its pivot point with +85% above average volume on 9/12/12 triggered a new (or add-on) technical buy signal. Its 50 DMA line defines important near-term support.
>>> The latest Featured Stock Update with an annotated graph appeared on 8/20/2012. Click here.
View all notes |
Alert me of new notes |
CANSLIM.net Company Profile |
SEC |
Zacks Reports |
StockTalk |
News |
Chart |
Request a new note
C
A N
S L
I M
|
NSM
-
NYSE
Nationstar Mtg Hldgs Inc
FINANCIAL SERVICES - Credit Services
|
$30.55
|
+1.55
5.34% |
$31.32
|
3,409,354
424.47% of 50 DAV
50 DAV is 803,200
|
$30.07
1.60%
|
8/29/2012
|
$27.96
|
PP = $28.85
|
|
MB = $30.29
|
Most Recent Note - 9/19/2012 12:39:27 PM
Y - Gapped up today and hit a new 52-week high with volume running at an heavy pace already more than 3 times its daily average volume. Disciplined investors avoid chasing stocks more than +5% above their pivot point.
>>> The latest Featured Stock Update with an annotated graph appeared on 9/7/2012. Click here.
View all notes |
Alert me of new notes |
CANSLIM.net Company Profile |
SEC |
Zacks Reports |
StockTalk |
News |
Chart |
Request a new note
C
A N
S L
I M
|
OSIS
-
NASDAQ
O S I Systems Inc
ELECTRONICS - Semiconductor Equipment and Mate
|
$76.43
|
+0.24
0.32% |
$77.30
|
115,206
100.18% of 50 DAV
50 DAV is 115,000
|
$76.29
0.18%
|
9/5/2012
|
$74.39
|
PP = $75.10
|
|
MB = $78.86
|
Most Recent Note - 9/18/2012 5:34:10 PM
Y - Today's gain with +55% above average volume and a strong close above its pivot point clinched a new (or add-on) technical buy signal. Near term support is at its 50 DMA line.
>>> The latest Featured Stock Update with an annotated graph appeared on 9/14/2012. Click here.
View all notes |
Alert me of new notes |
CANSLIM.net Company Profile |
SEC |
Zacks Reports |
StockTalk |
News |
Chart |
Request a new note
C
A N
S L
I M
|
Symbol/Exchange
Company Name
Industry Group |
PRICE |
CHANGE
(%Change) |
Day High |
Volume
(% DAV)
(% 50 day avg vol) |
52 Wk Hi
% From Hi |
Featured
Date |
Price
Featured |
Pivot Featured |
|
Max Buy |
RNF
-
NYSE
Rentech Nitrogen Ptnr Lp
CHEMICALS - Agricultural Chemicals
|
$38.52
|
+1.89
5.16% |
$38.61
|
501,560
117.76% of 50 DAV
50 DAV is 425,900
|
$37.69
2.20%
|
7/27/2012
|
$29.58
|
PP = $30.60
|
|
MB = $32.13
|
Most Recent Note - 9/19/2012 6:14:44 PM
G - Hit another new 52-week high and finished near the session high today with above average volume behind its gain, getting more extended from its prior base. An upward trendline defines near-term chart support that comes into play above its 50 DMA line.
>>> The latest Featured Stock Update with an annotated graph appeared on 8/31/2012. Click here.
View all notes |
Alert me of new notes |
CANSLIM.net Company Profile |
SEC |
Zacks Reports |
StockTalk |
News |
Chart |
Request a new note
C
A N
S L
I M
|
SWI
-
NYSE
Solarwinds Inc
COMPUTER SOFTWARE and SERVICES - Application Software
|
$59.61
|
+0.18
0.30% |
$59.98
|
663,648
60.77% of 50 DAV
50 DAV is 1,092,100
|
$60.95
-2.20%
|
7/25/2012
|
$47.82
|
PP = $47.89
|
|
MB = $50.28
|
Most Recent Note - 9/19/2012 6:21:05 PM
G - Volume totals have been cooling while still holding its ground near its all-time high. Its 50 DMA line defines important chart support to watch on pullbacks.
>>> The latest Featured Stock Update with an annotated graph appeared on 8/29/2012. Click here.
View all notes |
Alert me of new notes |
CANSLIM.net Company Profile |
SEC |
Zacks Reports |
StockTalk |
News |
Chart |
Request a new note
C
A N
S L
I M
|
TDG
-
NYSE
Transdigm Group Inc
AEROSPACE/DEFENSE - Aerospace/Defense Products and; Services
|
$143.05
|
+0.38
0.27% |
$143.66
|
424,035
117.20% of 50 DAV
50 DAV is 361,800
|
$146.21
-2.16%
|
8/16/2012
|
$132.23
|
PP = $136.44
|
|
MB = $143.26
|
Most Recent Note - 9/19/2012 6:22:24 PM
G - Holding its ground near its all-time high. Prior highs along with its 50 DMA line define near-term chart support to watch on pullbacks.
>>> The latest Featured Stock Update with an annotated graph appeared on 8/17/2012. Click here.
View all notes |
Alert me of new notes |
CANSLIM.net Company Profile |
SEC |
Zacks Reports |
StockTalk |
News |
Chart |
Request a new note
C
A N
S L
I M
|
ULTA
-
NASDAQ
Ulta Salon Cosm & Frag
SPECIALTY RETAIL - Specialty Retail, Other
|
$98.55
|
+0.78
0.80% |
$98.82
|
468,399
58.27% of 50 DAV
50 DAV is 803,800
|
$103.52
-4.80%
|
9/4/2012
|
$93.17
|
PP = $98.52
|
|
MB = $103.45
|
Most Recent Note - 9/18/2012 5:29:17 PM
Y - Small gap down and loss today on light volume led to a close below its pivot point, raising concerns. Disciplined investors always limit losses if ever any stock falls -7% or more from their purchase price.
>>> The latest Featured Stock Update with an annotated graph appeared on 9/4/2012. Click here.
View all notes |
Alert me of new notes |
CANSLIM.net Company Profile |
SEC |
Zacks Reports |
StockTalk |
News |
Chart |
Request a new note
C
A N
S L
I M
|
ULTI
-
NASDAQ
Ultimate Software Group
INTERNET - Internet Software and Services
|
$100.25
|
-0.18
-0.18% |
$100.92
|
77,968
47.60% of 50 DAV
50 DAV is 163,800
|
$106.40
-5.78%
|
8/27/2012
|
$98.36
|
PP = $99.19
|
|
MB = $104.15
|
Most Recent Note - 9/14/2012 4:33:18 PM
Y - Today's gain broke a streak of 5 consecutive losses while retreating from its all-time high. Prior chart highs define initial support to watch above its 50 DMA line.
>>> The latest Featured Stock Update with an annotated graph appeared on 8/27/2012. Click here.
View all notes |
Alert me of new notes |
CANSLIM.net Company Profile |
SEC |
Zacks Reports |
StockTalk |
News |
Chart |
Request a new note
C
A N
S L
I M
|
Symbol/Exchange
Company Name
Industry Group |
PRICE |
CHANGE
(%Change) |
Day High |
Volume
(% DAV)
(% 50 day avg vol) |
52 Wk Hi
% From Hi |
Featured
Date |
Price
Featured |
Pivot Featured |
|
Max Buy |
VSI
-
NYSE
Vitamin Shoppe Inc
SPECIALTY RETAIL - Specialty Retail, Other
|
$58.74
|
+1.05
1.82% |
$58.90
|
267,403
72.66% of 50 DAV
50 DAV is 368,000
|
$61.83
-4.99%
|
6/29/2012
|
$54.93
|
PP = $55.03
|
|
MB = $57.78
|
Most Recent Note - 9/14/2012 4:35:23 PM
G - Quiet gain today on lighter volume halted a streak of 4 consecutive losses. Prior lows near $52 define important chart support below its 50 DMA line.
>>> The latest Featured Stock Update with an annotated graph appeared on 9/10/2012. Click here.
View all notes |
Alert me of new notes |
CANSLIM.net Company Profile |
SEC |
Zacks Reports |
StockTalk |
News |
Chart |
Request a new note
C
A N
S L
I M
|
WPI
-
NYSE
Watson Pharmaceuticals
DRUGS - Drugs - Generic
|
$83.73
|
+0.80
0.96% |
$83.94
|
777,675
66.80% of 50 DAV
50 DAV is 1,164,200
|
$84.02
-0.35%
|
8/24/2012
|
$82.90
|
PP = $81.10
|
|
MB = $85.16
|
Most Recent Note - 9/18/2012 5:42:38 PM
Y - Posted a gain today with below average volume. Still holding its ground in a tight range near its 52-week high since triggering a technical buy signal on 8/24/12 when highlighted in the mid-day report with a gap up gain backed by above average volume. Prior highs in the $81 area define initial support to watch on pullbacks.
>>> The latest Featured Stock Update with an annotated graph appeared on 8/28/2012. Click here.
View all notes |
Alert me of new notes |
CANSLIM.net Company Profile |
SEC |
Zacks Reports |
StockTalk |
News |
Chart |
Request a new note
C
A N
S L
I M
|