You are not logged in.
This means you
CAN ONLY VIEW reports that were published prior to Monday, April 14, 2025.
You
MUST UPGRADE YOUR MEMBERSHIP if you want to see any current reports.
AFTER MARKET UPDATE - THURSDAY, SEPTEMBER 18TH, 2014
Previous After Market Report Next After Market Report >>>
|
|
|
|
DOW |
+109.14 |
17,265.99 |
+0.64% |
|
Volume |
662,965,960 |
+1% |
|
Volume |
1,634,730,300 |
-1% |
|
NASDAQ |
+31.24 |
4,593.43 |
+0.68% |
|
Advancers |
1,862 |
58% |
|
Advancers |
1,743 |
59% |
|
S&P 500 |
+9.79 |
2,011.36 |
+0.49% |
|
Decliners |
1,209 |
38% |
|
Decliners |
1,100 |
37% |
|
Russell 2000 |
+5.38 |
1,159.27 |
+0.47% |
|
52 Wk Highs |
112 |
|
|
52 Wk Highs |
87 |
|
|
S&P 600 |
+1.39 |
661.91 |
+0.21% |
|
52 Wk Lows |
70 |
|
|
52 Wk Lows |
64 |
|
|
 |
Dow and the S&P 500 Index Both Hit New All-Time Highs
Kenneth J. Gruneisen - Passed the CAN SLIM® Master's Exam
On Thursday the major averages finished higher for a third day. The Dow gained 109 points to close at a record high of 17,265. The NASDAQ rose 31 points to 4,593. Volume totals were reported mixed, higher than the prior session total on the NYSE and lighter on the Nasdaq exchange. Breadth was positive as advancers led decliners on the NYSE and on the NASDAQ exchange by a 3-2 margin. Leadership improved again as there were 49 high-ranked companies from the CANSLIM.net Leaders List that made new 52-week highs and appeared on the CANSLIM.net BreakOuts Page, up from the prior session total of 41 stocks. New 52-week highs totals expanded and outnumbered new lows on the Nasdaq exchange and on the NYSE. There were gains for 10 of the 13 high-ranked companies currently included on the Featured Stocks Page. The broader market (M criteria) overcame recent distributional pressure while leadership (stocks hitting new 52-week highs) remained healthy. Remember that disciplined investors buy stocks with superior fundamentals only after they have triggered a proper technical buy signal.
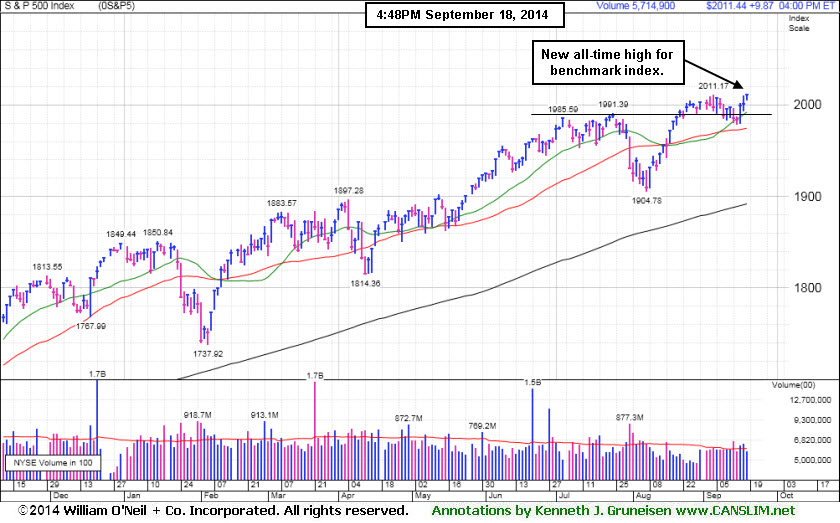
PICTURED: The S&P 500 index finished at a new all-time high as it increased 9 points to 2,011.
Stocks advanced following Wednesday's news that the Fed will keep interest rates low for a "considerable time" after its quantitative easing program ends in October. This prompted a rally in bank stocks including Citigroup (C +2.5%) and Bank of America (BAC +1.8%). Positive jobs data added to the upside as claims for unemployment benefits unexpectedly dropped to a two-month low of 280,000. Other data was overlooked as housing starts reversed last month’s jump higher while a gauge on Mid-Atlantic manufacturing activity declined.
Overall, eight of the 10 S&P 500 sectors advanced. Materials and health care stocks were among the best performing groups. DuPont (DD +2.8%) rallied for a second day following news that an activist investor called for a break-up of the company. Gilead Sciences (GILD +1.6%) rose. Energy stocks including Exxon Mobil (XOM -0.3%) fell as WTI crude continued to slide.
Treasuries were mixed. The 10-year note fell 1/32 to yield 2.62%. The 30-year bond rose 7/32 to yield 3.36%.
The CANSLIM.net Featured Stocks Page shows the most action-worthy candidates and their latest notes and a Headline Link directs members to the latest detailed analysis with data-packed graphs annotated by a Certified expert along with links to additional resources. The Premium Member Homepage includes "dynamic archives" to all prior pay reports published.
|
 Kenneth J. Gruneisen started out as a licensed stockbroker in August 1987, a couple of months prior to the historic stock market crash that took the Dow Jones Industrial Average down -22.6% in a single day. He has published daily fact-based fundamental and technical analysis on high-ranked stocks online for two decades. Through FACTBASEDINVESTING.COM, Kenneth provides educational articles, news, market commentary, and other information regarding proven investment systems that work in good times and bad.
Comments contained in the body of this report are technical opinions only and are not necessarily those of Gruneisen Growth Corp. The material herein has been obtained from sources believed to be reliable and accurate, however, its accuracy and completeness cannot be guaranteed. Our firm, employees, and customers may effect transactions, including transactions contrary to any recommendation herein, or have positions in the securities mentioned herein or options with respect thereto. Any recommendation contained in this report may not be suitable for all investors and it is not to be deemed an offer or solicitation on our part with respect to the purchase or sale of any securities. |
|
 |
Financial, Tech and Retail Index Gains Led Market Higher
Kenneth J. Gruneisen - Passed the CAN SLIM® Master's Exam
Financial shares added a positive influence on the major averages as the Bank Index ($BKX +0.65%) and the Broker/Dealer Index ($XBD +1.02%) rallied. The Networking Index ($NWX +1.06%) and Semiconductor Index ($SOX +1.47%) led the tech sector higher while the Biotechnology Index ($BTK +0.66%) and the Retail Index ($RLX +0.68%) both followed with modest gains. Meanwhile, commodity-linked groups created a drag on the market as the Gold & Silver Index ($XAU -1.43%) outpaced the Integrated Oil Index ($XOI -0.59%) to the downside and the Oil Services Index ($OSX -0.06%) finished flat.
Charts courtesy www.stockcharts.com
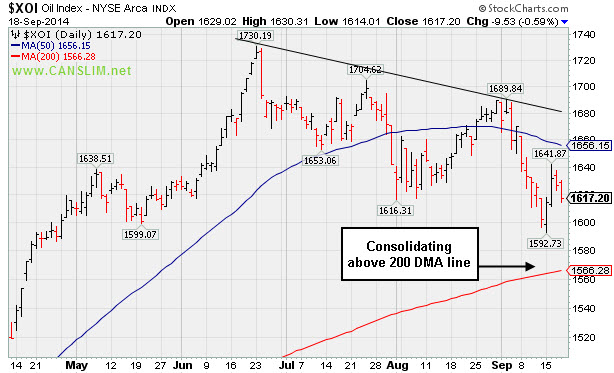
PICTURED: The Integrated Oil Index ($XOI -0.59%) is consolidating above its 200-day moving average (DMA) line, facing near term resistance at its 50 DMA and multi-month downward trendline..
| Oil Services |
$OSX |
279.02 |
-0.16 |
-0.06% |
-0.72% |
| Integrated Oil |
$XOI |
1,617.20 |
-9.53 |
-0.59% |
+7.59% |
| Semiconductor |
$SOX |
657.36 |
+9.53 |
+1.47% |
+22.86% |
| Networking |
$NWX |
339.99 |
+3.57 |
+1.06% |
+4.95% |
| Broker/Dealer |
$XBD |
176.08 |
+1.77 |
+1.02% |
+9.66% |
| Retail |
$RLX |
949.44 |
+6.41 |
+0.68% |
+1.03% |
| Gold & Silver |
$XAU |
89.14 |
-1.29 |
-1.43% |
+5.93% |
| Bank |
$BKX |
73.96 |
+0.91 |
+1.25% |
+6.79% |
| Biotech |
$BTK |
3,114.23 |
+20.31 |
+0.66% |
+33.63% |
|
|
|
 |
Volume Totals Recently Cooling After Halting Slide
Kenneth J. Gruneisen - Passed the CAN SLIM® Master's Exam
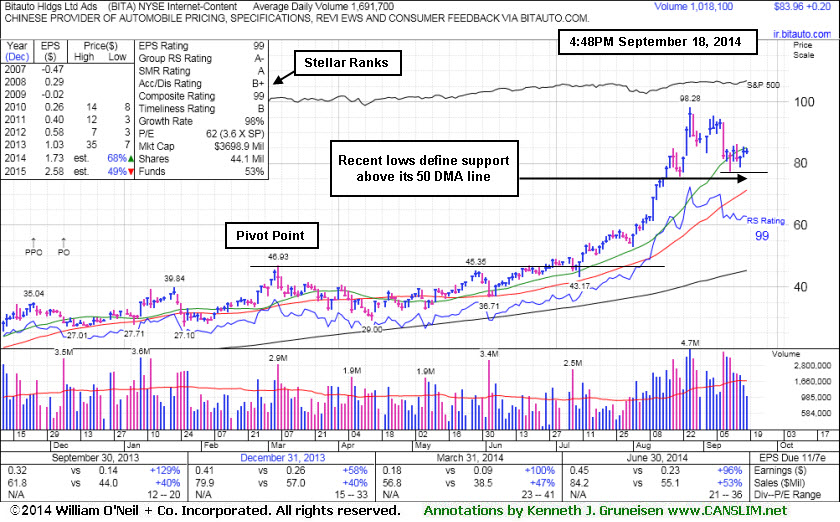
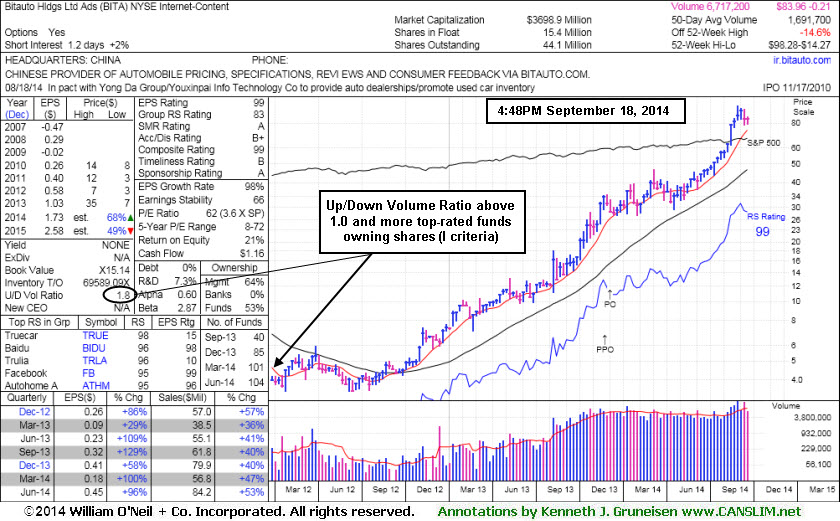
Biotauto Hldgs Ltd Ads (BITA +$0.20 or +0.24% to $83.96) has seen volume totals cooling since it halted its slide following losses with above average volume. Its current consolidation is too brief in duration to be recognized as a new base. It was noted repeatedly with caution - "Has the look of a 'climax run' with volume-driven gains getting very extended from its prior base." Recently it has endured distributional pressure, yet its fundamentals remain strong.
Recent lows ($77.50 on 9/11/14) define near-term support to watch above its 50-day moving average (DMA) line ($71.40) which is usually an important near-term support level for chart readers. BITA was last shown in this FSU section on 8/27/14 with an annotated graphs under the headline,"Finished Near Session Low - Noted With Look of 'Climax Run'". It has not spent much time base building during its ascent since highlighted in yellow in the 6/26/14 mid-day report (read here) with pivot point cited based on the 3/06/14 high plus 10 cents.
Fundamentals remain strong with respect to the C and A criteria as it reported earnings +96% on +53% sales revenues for the Jun '14 quarter. It was first highlighted in the 8/07/13 mid-day report in yellow at $12.01 with the prior pivot point based on its 5/08/13 high plus 10 cents (read here). This China-based Internet-Content firm's quarterly and annual earnings (C and A criteria) history has been strong. Its small supply (S criteria) of only 15.4 million shares in the public float can contribute to great volatility in the event of institutional buying or selling. There are 104 top-rated mutual funds as of Jun '14 owning an interest in the company, up from 41 in Sep '13, a reassuring sign concerning the I criteria. Its current Up/Down Volume Ratio is 1.8, an unbiased indication its shares have been under accumulation over the past 50 days.
|
|
|
Color Codes Explained :
Y - Better candidates highlighted by our
staff of experts.
G - Previously featured
in past reports as yellow but may no longer be buyable under the
guidelines.
***Last / Change / Volume data in this table is the closing quote data***
Symbol/Exchange
Company Name
Industry Group |
PRICE |
CHANGE
(%Change) |
Day High |
Volume
(% DAV)
(% 50 day avg vol) |
52 Wk Hi
% From Hi |
Featured
Date |
Price
Featured |
Pivot Featured |
|
Max Buy |
ACT
-
NYSE
Actavis plc
Medical-Generic Drugs
|
$237.93
|
+0.84
0.35% |
$240.34
|
1,613,774
77.40% of 50 DAV
50 DAV is 2,085,000
|
$239.58
-0.69%
|
6/20/2014
|
$216.53
|
PP = $230.87
|
|
MB = $242.41
|
 Most Recent Note - 9/18/2014 1:08:52 PM
Y - Wedging into new 52-week high territory with recent gains lacking great volume conviction. Prior notes cautioned members - "Gains above a stock's pivot point must be backed by a minimum of +40% above average volume to trigger a technical buy signal."
>>> FEATURED STOCK ARTICLE : Quietly Perched Within Striking Distance of 52-Week High - 8/28/2014
View all notes |
Set NEW NOTE alert |
CANSLIM.net Company Profile |
SEC
News |
Chart |
Request a new note
C
A N
S L
I M


|
BITA
-
NYSE
Bitauto Hldgs Ltd Ads
Internet-Content
|
$83.96
|
+0.20
0.24% |
$84.95
|
1,018,161
60.21% of 50 DAV
50 DAV is 1,691,000
|
$98.28
-14.57%
|
6/26/2014
|
$46.20
|
PP = $47.03
|
|
MB = $49.38
|
Most Recent Note - 9/18/2014 5:48:51 PM
G - Volume totals have been cooling after halting its slide. See the latest FSU analysis for more details and new annotated graphs. Noted repeatedly with caution - "Has the look of a 'climax run' with volume-driven gains getting very extended from its prior base."
>>> FEATURED STOCK ARTICLE : Volume Totals Recently Cooling After Halting Slide - 9/18/2014
View all notes |
Set NEW NOTE alert |
CANSLIM.net Company Profile |
SEC
News |
Chart |
Request a new note
C
A N
S L
I M
|
EQM
-
NYSE
E Q T Midstream Partners
ENERGY - Oil and Gas Pipelines
|
$89.91
|
-0.21
-0.23% |
$90.75
|
229,170
131.71% of 50 DAV
50 DAV is 174,000
|
$102.51
-12.29%
|
12/12/2013
|
$53.17
|
PP = $56.51
|
|
MB = $59.34
|
Most Recent Note - 9/18/2014 1:11:26 PM
Halted its slide after recently violating its 50 DMA line triggering a technical sell signal. A rebound above the 50 DMA line is needed for its outlook to improve. Reported earnings +37% on +21% sales revenues for the Jun '14 quarter, an improvement after 2 sub par quarterly earnings comparisons. It will be dropped from the Featured Stocks list tonight.
>>> FEATURED STOCK ARTICLE : Forming New Base But Fundamental Flaws Remain a Concern - 9/3/2014
View all notes |
Set NEW NOTE alert |
CANSLIM.net Company Profile |
SEC
News |
Chart |
Request a new note
C
A N
S L
I M
|
FB
-
NASDAQ
Facebook Inc Cl A
INTERNET
|
$77.00
|
+0.57
0.75% |
$77.33
|
22,819,064
63.14% of 50 DAV
50 DAV is 36,138,000
|
$78.36
-1.74%
|
9/9/2014
|
$76.67
|
PP = $76.84
|
|
MB = $80.68
|
Most Recent Note - 9/18/2014 1:13:52 PM
Y - Found support at its 50 DMA line ($73.51) this week after a bout of distributional pressure. Prior notes repeatedly cautioned members - "Recent gains lacked great volume conviction while gains above a stock's pivot point must have at least +40% above averages volume to trigger a proper new (or add-on) technical buy signal. See the latest FSU analysis for more details and annotated graphs. Prior highs in the $72 area define initial support along with its 50 DMA line."
>>> FEATURED STOCK ARTICLE : Wedging Gains Not Indicative of Institutional Conviction - 9/9/2014
View all notes |
Set NEW NOTE alert |
CANSLIM.net Company Profile |
SEC
News |
Chart |
Request a new note
C
A N
S L
I M
|
NVGS
-
NYSE
Navigator Holdings Ltd
Transportation-Ship
|
$31.30
|
-0.19
-0.60% |
$31.90
|
738,181
349.85% of 50 DAV
50 DAV is 211,000
|
$31.55
-0.79%
|
9/16/2014
|
$30.33
|
PP = $30.56
|
|
MB = $32.09
|
Most Recent Note - 9/18/2014 12:27:11 PM
Y - Gapped up for a small gain into new high territory today. No resistance remains due to overhead supply and it ended near the prior session high at a new 52-week high (N criteria) while triggering a convincing technical buy signal with its 4th volume-driven gain in the span of 5 sessions. Highlighted in yellow in the 9/16/14 mid-day report (read here). See the latest FSU analysis for more details and annotated graphs.
>>> FEATURED STOCK ARTICLE : Finished Strong While Challenging Pivot Point and Recent Highs - 9/16/2014
View all notes |
Set NEW NOTE alert |
CANSLIM.net Company Profile |
SEC
News |
Chart |
Request a new note
C
A N
S L
I M
|
Symbol/Exchange
Company Name
Industry Group |
PRICE |
CHANGE
(%Change) |
Day High |
Volume
(% DAV)
(% 50 day avg vol) |
52 Wk Hi
% From Hi |
Featured
Date |
Price
Featured |
Pivot Featured |
|
Max Buy |
NXPI
-
NASDAQ
Nxp Semiconductors N V
ELECTRONICS - Semiconductor - Broad Line
|
$72.93
|
+2.20
3.11% |
$73.71
|
5,012,571
153.71% of 50 DAV
50 DAV is 3,261,000
|
$73.09
-0.22%
|
8/29/2014
|
$68.50
|
PP = $67.89
|
|
MB = $71.28
|
Most Recent Note - 9/18/2014 12:57:39 PM
G - Color code is changed to green while challenging its 52-week high and rallying above its "max buy" level. No overhead supply remains to act as resistance. Prior highs in the $67 area define initial support to watch on pullbacks. See the latest FSU analysis for more details and annotated graphs.
>>> FEATURED STOCK ARTICLE : Consolidating Above Pivot Point and Below "Max Buy" Level - 9/17/2014
View all notes |
Set NEW NOTE alert |
CANSLIM.net Company Profile |
SEC
News |
Chart |
Request a new note
C
A N
S L
I M
|
PANW
-
NYSE
Palo Alto Networks
Computer Sftwr-Security
|
$98.95
|
+0.34
0.34% |
$99.57
|
1,127,643
69.01% of 50 DAV
50 DAV is 1,634,000
|
$102.45
-3.42%
|
7/30/2014
|
$84.21
|
PP = $85.88
|
|
MB = $90.17
|
Most Recent Note - 9/18/2014 1:00:08 PM
G - Stubbornly holding its ground near its 52-week high, extended from any sound base. Prior highs in the $87 area define initial support to watch above its 50 DMA line ($84.97). Disciplined investors avoid chasing extended stocks.
>>> FEATURED STOCK ARTICLE : Pulling Back Following New Technical Breakout - 9/4/2014
View all notes |
Set NEW NOTE alert |
CANSLIM.net Company Profile |
SEC
News |
Chart |
Request a new note
C
A N
S L
I M
|
STRT
-
NASDAQ
Strattec Security Corp
AUTOMOTIVE - Auto Parts
|
$85.39
|
+0.86
1.02% |
$86.16
|
25,999
123.80% of 50 DAV
50 DAV is 21,000
|
$89.87
-4.99%
|
8/22/2014
|
$71.47
|
PP = $73.97
|
|
MB = $77.67
|
Most Recent Note - 9/18/2014 1:02:38 PM
G - Possibly forming an advanced "3-weeks tight" base while holding its ground stubbornly after 6 consecutive weekly gains. Prior highs in the $74-77 area define initial support to watch on pullbacks.
>>> FEATURED STOCK ARTICLE : Extended From Prior Highs and Previously Noted Base - 9/10/2014
View all notes |
Set NEW NOTE alert |
CANSLIM.net Company Profile |
SEC
News |
Chart |
Request a new note
C
A N
S L
I M
|
TARO
-
NYSE
Taro Pharmaceutical Inds
DRUGS - Drug Manufacturers - Other
|
$159.92
|
+1.12
0.71% |
$162.44
|
58,654
67.42% of 50 DAV
50 DAV is 87,000
|
$165.30
-3.25%
|
7/30/2014
|
$144.24
|
PP = $149.99
|
|
MB = $157.49
|
Most Recent Note - 9/18/2014 1:03:24 PM
G - Consolidating above its 50 DMA line and -3.2% off its 52-week high. Recently enduring distributional pressure and noted with caution - "Extended from any sound base. Recently reported earnings for the Jun '14 quarter below the +25% minimum earnings guideline (C criteria) raising fundamental concerns."
>>> FEATURED STOCK ARTICLE : Churning Action Indicative of Distributional Pressure - 9/2/2014
View all notes |
Set NEW NOTE alert |
CANSLIM.net Company Profile |
SEC
News |
Chart |
Request a new note
C
A N
S L
I M
|
TRN
-
NYSE
Trinity Industries Inc
TRANSPORTATION - Railroads
|
$50.03
|
+1.27
2.60% |
$50.03
|
3,169,250
129.15% of 50 DAV
50 DAV is 2,454,000
|
$50.43
-0.79%
|
4/30/2014
|
$37.79
|
PP = $38.03
|
|
MB = $39.93
|
Most Recent Note - 9/18/2014 1:04:38 PM
G - Poised for a best-ever close with today's 3rd consecutive gain. It has not formed a sound base. Prior highs near $46-47 define near-term support above its 50 DMA line.
>>> FEATURED STOCK ARTICLE : Consolidating Above 50-Day Moving Average Line - 9/12/2014
View all notes |
Set NEW NOTE alert |
CANSLIM.net Company Profile |
SEC
News |
Chart |
Request a new note
C
A N
S L
I M
|
Symbol/Exchange
Company Name
Industry Group |
PRICE |
CHANGE
(%Change) |
Day High |
Volume
(% DAV)
(% 50 day avg vol) |
52 Wk Hi
% From Hi |
Featured
Date |
Price
Featured |
Pivot Featured |
|
Max Buy |
UA
-
NYSE
Under Armour Inc Cl A
CONSUMER NON-DURABLES - Textile - Apparel Clothing
|
$69.57
|
+0.48
0.69% |
$69.75
|
1,354,119
56.78% of 50 DAV
50 DAV is 2,385,000
|
$73.42
-5.24%
|
7/10/2014
|
$58.50
|
PP = $60.79
|
|
MB = $63.83
|
Most Recent Note - 9/18/2014 1:06:16 PM
G - Found support at its 50 DMA line ($67.31) recently after retreating from its 52-week high. Prior notes cautioned members - "Fundamental concerns were raised by earnings reported +0% on +34% sales revenues for the Jun '14 quarter, below the +25% minimum earnings guideline (C criteria)."
>>> FEATURED STOCK ARTICLE : Higher Volume Behind Loss Testing 50-Day Moving Average - 9/15/2014
View all notes |
Set NEW NOTE alert |
CANSLIM.net Company Profile |
SEC
News |
Chart |
Request a new note
C
A N
S L
I M
|
WLK
-
NYSE
Westlake Chemical Corp
CHEMICALS - Specialty Chemicals
|
$94.52
|
+0.64
0.68% |
$94.99
|
291,745
58.00% of 50 DAV
50 DAV is 503,000
|
$98.44
-3.98%
|
4/29/2014
|
$72.79
|
PP = $69.31
|
|
MB = $72.78
|
Most Recent Note - 9/16/2014 8:17:56 PM
G - Churned higher volume today while consolidating above prior highs in the $92 area defining support above its 50 DMA line. Subsequent violations would raise greater concerns and trigger technical sell signals. Technical strength has continued despite recent fundamental concerns.
>>> FEATURED STOCK ARTICLE : Consolidating Above Near-Term Support Levels - 9/11/2014
View all notes |
Set NEW NOTE alert |
CANSLIM.net Company Profile |
SEC
News |
Chart |
Request a new note
C
A N
S L
I M
|
YY
-
NASDAQ
YY Inc Ads
INTERNET - Internet Service Providers
|
$78.53
|
-2.42
-2.99% |
$81.88
|
2,767,059
178.06% of 50 DAV
50 DAV is 1,554,000
|
$96.39
-18.53%
|
8/19/2014
|
$85.81
|
PP = $91.03
|
|
MB = $95.58
|
Most Recent Note - 9/18/2014 3:55:29 PM
Volume is running at a well above average pace while slumping below recent lows and further below its 50 DMA line today, action raising greater concerns and triggering technical sell signals. A prompt rebound above its 50 DMA line is needed for its outlook to improve. It will be dropped from the Featured Stocks list tonight.
>>> FEATURED STOCK ARTICLE : Perched at High After Triggering Technical Buy Signal - 9/5/2014
View all notes |
Set NEW NOTE alert |
CANSLIM.net Company Profile |
SEC
News |
Chart |
Request a new note
C
A N
S L
I M
|
|
|
|
THESE ARE NOT BUY RECOMMENDATIONS!
Comments contained in the body of this report are technical
opinions only. The material herein has been obtained
from sources believed to be reliable and accurate, however,
its accuracy and completeness cannot be guaranteed.
This site is not an investment advisor, hence it does
not endorse or recommend any securities or other investments.
Any recommendation contained in this report may not
be suitable for all investors and it is not to be deemed
an offer or solicitation on our part with respect to
the purchase or sale of any securities. All trademarks,
service marks and trade names appearing in this report
are the property of their respective owners, and are
likewise used for identification purposes only.
This report is a service available
only to active Paid Premium Members.
You may opt-out of receiving report notifications
at any time. Questions or comments may be submitted
by writing to Premium Membership Services 665 S.E. 10 Street, Suite 201 Deerfield Beach, FL 33441-5634 or by calling 1-800-965-8307
or 954-785-1121.
|
|
|

