Symbol/Exchange
Company Name
Industry Group |
PRICE |
CHANGE
(%Change) |
Day High |
Volume
(% DAV)
(% 50 day avg vol) |
52 Wk Hi
% From Hi |
Featured
Date |
Price
Featured |
Pivot Featured |
|
Max Buy |
AVG
-
NYSE
A V G Technologies N.V.
INTERNET - Internet Software and Services
|
$25.37
|
+0.95
3.89% |
$25.41
|
2,149,580
258.11% of 50 DAV
50 DAV is 832,800
|
$25.12
1.00%
|
9/13/2013
|
$23.06
|
PP = $23.88
|
|
MB = $25.07
|
 Most Recent Note - 9/18/2013 12:23:14 PM
G - Color code is changed to green after rallying beyond its "max buy" level. Triggered a technical buy signal on 9/16/13 with 5 times average volume behind its breakout gain above the pivot point. More details and an annotated graph were included on 9/13/13 in the latest FSU analysis under the headline, "Rallying Near Pivot Point With Greater Volume Conviction".
>>> The latest Featured Stock Update with an annotated graph appeared on 9/13/2013. Click here.
View all notes |
Alert me of new notes |
CANSLIM.net Company Profile |
SEC |
Zacks Reports |
StockTalk |
News |
Chart |
Request a new note
C
A N
S L
I M


|
BITA
-
NYSE
Bitauto Hldgs Ltd Ads
INTERNET - Internet Information Providers
|
$14.60
|
-0.25
-1.68% |
$14.96
|
576,467
161.43% of 50 DAV
50 DAV is 357,100
|
$18.10
-19.34%
|
8/7/2013
|
$12.01
|
PP = $13.30
|
|
MB = $13.97
|
Most Recent Note - 9/17/2013 3:17:41 PM
G - Recently encountered distributional pressure. Its choppy 6-week consolidation above its 50 DMA line and prior highs is not recognized as a sound base pattern.
>>> The latest Featured Stock Update with an annotated graph appeared on 9/3/2013. Click here.
View all notes |
Alert me of new notes |
CANSLIM.net Company Profile |
SEC |
Zacks Reports |
StockTalk |
News |
Chart |
Request a new note
C
A N
S L
I M
|
CELG
-
NASDAQ
Celgene Corp
DRUGS - Drug Manufacturers - Major
|
$148.67
|
+1.63
1.11% |
$150.15
|
3,433,180
138.15% of 50 DAV
50 DAV is 2,485,100
|
$151.20
-1.67%
|
9/12/2013
|
$149.50
|
PP = $150.02
|
|
MB = $157.52
|
Most Recent Note - 9/12/2013 4:08:38 PM
Y - Wedging into new high territory this week with a streak of gains lacking volume conviction. New pivot point is cited based on its 8/01/13 high plus 10 cents, and subsequent volume-driven gains may trigger a new (or add-on) technical buy signal. It formed a base-on-base type pattern. Its 50 DMA line defines important chart support.
>>> The latest Featured Stock Update with an annotated graph appeared on 8/21/2013. Click here.
View all notes |
Alert me of new notes |
CANSLIM.net Company Profile |
SEC |
Zacks Reports |
StockTalk |
News |
Chart |
Request a new note
C
A N
S L
I M
|
EGBN
-
NASDAQ
Eagle Bancorp Inc
BANKING - Regional - Mid-Atlantic Banks
|
$27.60
|
-0.14
-0.50% |
$27.99
|
42,551
59.02% of 50 DAV
50 DAV is 72,100
|
$28.24
-2.27%
|
9/16/2013
|
$27.48
|
PP = $27.77
|
|
MB = $29.16
|
Most Recent Note - 9/16/2013 6:53:19 PM
Y - Finished lower today following a "negative reversal" after hitting a new 52-week high. Highlighted in yellow with a new pivot point based on its 7/25/13 high plus 10 cents. Reported earnings +33% on +15% sales revenues for the Jun '13 quarter. Found support at its 50 DMA line again since noted in the 7/26/13 mid-day report - "This Bank holding company with operations in the Northeast has shown strong sales revenues and earnings increases (C criteria) in recent quarterly comparisons. Annual earnings (A criteria) history included a downturn in FY '07-09 yet improved in recent years." See the latest FSU analysis for more details and a new annotated graph.
>>> The latest Featured Stock Update with an annotated graph appeared on 9/16/2013. Click here.
View all notes |
Alert me of new notes |
CANSLIM.net Company Profile |
SEC |
Zacks Reports |
StockTalk |
News |
Chart |
Request a new note
C
A N
S L
I M
|
FLT
-
NYSE
Fleetcor Technologies
DIVERSIFIED SERVICES - Business/Management Services
|
$110.98
|
+1.41
1.29% |
$111.18
|
425,039
69.85% of 50 DAV
50 DAV is 608,500
|
$110.42
0.50%
|
8/19/2013
|
$99.01
|
PP = $100.97
|
|
MB = $106.02
|
Most Recent Note - 9/12/2013 12:33:46 PM
G - Blasted beyond its "max buy" level to new highs after pricing a 2.75M share Secondary Offering at $105.25. FLT has traded up as much as +55% since first featured in yellow in the mid-day report on 3/21/13 (read here)
>>> The latest Featured Stock Update with an annotated graph appeared on 9/6/2013. Click here.
View all notes |
Alert me of new notes |
CANSLIM.net Company Profile |
SEC |
Zacks Reports |
StockTalk |
News |
Chart |
Request a new note
C
A N
S L
I M
|
Symbol/Exchange
Company Name
Industry Group |
PRICE |
CHANGE
(%Change) |
Day High |
Volume
(% DAV)
(% 50 day avg vol) |
52 Wk Hi
% From Hi |
Featured
Date |
Price
Featured |
Pivot Featured |
|
Max Buy |
GNRC
-
NYSE
Generac Hldgs Inc
CONSUMER DURABLES - Electronic Equipment
|
$42.07
|
+0.20
0.48% |
$42.19
|
419,340
50.29% of 50 DAV
50 DAV is 833,900
|
$44.30
-5.03%
|
9/12/2013
|
$41.40
|
PP = $43.27
|
|
MB = $45.43
|
Most Recent Note - 9/12/2013 5:47:27 PM
Y - Rebounded above its 50 DMA line, its color code is changed to yellow while building on a new base with pivot point based on its 8/14/13 high. Subsequent volume-driven gains may trigger a new technical buy signal.
>>> The latest Featured Stock Update with an annotated graph appeared on 8/22/2013. Click here.
View all notes |
Alert me of new notes |
CANSLIM.net Company Profile |
SEC |
Zacks Reports |
StockTalk |
News |
Chart |
Request a new note
C
A N
S L
I M
|
KORS
-
NYSE
Michael Kors Hldgs Ltd
RETAIL - Apparel Stores
|
$75.72
|
+0.70
0.93% |
$75.79
|
3,575,006
100.41% of 50 DAV
50 DAV is 3,560,300
|
$76.74
-1.33%
|
8/6/2013
|
$69.66
|
PP = $66.28
|
|
MB = $69.59
|
Most Recent Note - 9/17/2013 3:04:29 PM
G - Extended from its prior base and volume totals have been cooling while consolidating near its 52-week high. Its 50 DMA line defines support above prior highs in the $66 area.
>>> The latest Featured Stock Update with an annotated graph appeared on 8/29/2013. Click here.
View all notes |
Alert me of new notes |
CANSLIM.net Company Profile |
SEC |
Zacks Reports |
StockTalk |
News |
Chart |
Request a new note
C
A N
S L
I M
|
LOPE
-
NASDAQ
Grand Canyon Education
DIVERSIFIED SERVICES - Education and; Training Services
|
$39.66
|
+1.65
4.34% |
$39.90
|
519,797
128.28% of 50 DAV
50 DAV is 405,200
|
$38.11
4.07%
|
6/19/2013
|
$31.47
|
PP = $34.17
|
|
MB = $35.88
|
Most Recent Note - 9/18/2013 7:39:16 PM
G - Surged to a new all-time high with today's gain backed by above average volume. Fundamental concerns remain while technical action has been reassuring.
>>> The latest Featured Stock Update with an annotated graph appeared on 9/12/2013. Click here.
View all notes |
Alert me of new notes |
CANSLIM.net Company Profile |
SEC |
Zacks Reports |
StockTalk |
News |
Chart |
Request a new note
C
A N
S L
I M
|
MRLN
-
NASDAQ
Marlin Business Services
DIVERSIFIED SERVICES - Rental and Leasing Services
|
$25.79
|
+0.40
1.58% |
$26.01
|
21,913
58.28% of 50 DAV
50 DAV is 37,600
|
$26.96
-4.34%
|
9/9/2013
|
$25.75
|
PP = $26.07
|
|
MB = $27.37
|
Most Recent Note - 9/12/2013 12:52:07 PM
Y - Trading at a new 52-week high today. The company announced plans to pay a Special Dividend to shareholders of record 9/16/13. Held its ground stubbornly and rose since a volume-driven breakout gain on 9/05/13. See the latest FSU analysis for more details and an annotated weekly graph.
>>> The latest Featured Stock Update with an annotated graph appeared on 9/9/2013. Click here.
View all notes |
Alert me of new notes |
CANSLIM.net Company Profile |
SEC |
Zacks Reports |
StockTalk |
News |
Chart |
Request a new note
C
A N
S L
I M
|
PCLN
-
NASDAQ
Priceline.Com Inc
INTERNET - Internet Software and Services
|
$995.09
|
+24.85
2.56% |
$1,001.00
|
673,190
107.50% of 50 DAV
50 DAV is 626,200
|
$994.98
0.01%
|
9/13/2013
|
$966.82
|
PP = $995.08
|
|
MB = $1,044.83
|
Most Recent Note - 9/13/2013 8:30:57 PM
Y - Color code is changed to yellow with new pivot point cited based on its 8/09/13 high plus 10 cents. Consolidating in an orderly fashion above prior highs, still building a new flat base. Subsequent volume-driven gains may trigger a new (or add-on) technical buy signal.
>>> The latest Featured Stock Update with an annotated graph appeared on 8/19/2013. Click here.
View all notes |
Alert me of new notes |
CANSLIM.net Company Profile |
SEC |
Zacks Reports |
StockTalk |
News |
Chart |
Request a new note
C
A N
S L
I M
|
Symbol/Exchange
Company Name
Industry Group |
PRICE |
CHANGE
(%Change) |
Day High |
Volume
(% DAV)
(% 50 day avg vol) |
52 Wk Hi
% From Hi |
Featured
Date |
Price
Featured |
Pivot Featured |
|
Max Buy |
PRAA
-
NASDAQ
Portfolio Recovery Assoc
DIVERSIFIED SERVICES - Business/Management Services
|
$58.63
|
-0.51
-0.86% |
$59.31
|
327,310
60.31% of 50 DAV
50 DAV is 542,700
|
$59.45
-1.37%
|
7/31/2013
|
$51.43
|
PP = $54.72
|
|
MB = $57.46
|
Most Recent Note - 9/17/2013 3:19:21 PM
G - Extended from its prior base and hovering very near its 52-week high for the past week with volume totals cooling. Found support above its 50 DMA line during the latest consolidation.
>>> The latest Featured Stock Update with an annotated graph appeared on 8/28/2013. Click here.
View all notes |
Alert me of new notes |
CANSLIM.net Company Profile |
SEC |
Zacks Reports |
StockTalk |
News |
Chart |
Request a new note
C
A N
S L
I M
|
PRLB
-
NYSE
Proto Labs Inc
MANUFACTURING - Small Tools and Accessories
|
$75.65
|
+0.09
0.12% |
$76.09
|
287,201
71.87% of 50 DAV
50 DAV is 399,600
|
$76.73
-1.41%
|
7/29/2013
|
$64.86
|
PP = $67.50
|
|
MB = $70.88
|
Most Recent Note - 9/16/2013 6:54:53 PM
G - Gapped up today and posted a gain with light volume. Support to watch is at prior highs and above its 50 DMA line coinciding in the $67 area.
>>> The latest Featured Stock Update with an annotated graph appeared on 8/27/2013. Click here.
View all notes |
Alert me of new notes |
CANSLIM.net Company Profile |
SEC |
Zacks Reports |
StockTalk |
News |
Chart |
Request a new note
C
A N
S L
I M
|
QCOR
-
NASDAQ
Questcor Pharmaceuticals
DRUGS - Biotechnology
|
$65.63
|
+0.10
0.15% |
$66.45
|
964,932
57.27% of 50 DAV
50 DAV is 1,684,800
|
$74.76
-12.21%
|
7/31/2013
|
$66.46
|
PP = $59.01
|
|
MB = $61.96
|
Most Recent Note - 9/16/2013 6:57:03 PM
G - Consolidating above its 50 DMA line defining important near-term support. A subsequent violation would trigger a technical sell signal.
>>> The latest Featured Stock Update with an annotated graph appeared on 8/26/2013. Click here.
View all notes |
Alert me of new notes |
CANSLIM.net Company Profile |
SEC |
Zacks Reports |
StockTalk |
News |
Chart |
Request a new note
C
A N
S L
I M
|
SFUN
-
NYSE
Soufun Hldgs Ltd Ads A
INTERNET - Internet Information Providers
|
$49.88
|
+4.48
9.87% |
$50.19
|
2,169,729
249.22% of 50 DAV
50 DAV is 870,600
|
$53.77
-7.23%
|
7/16/2013
|
$29.54
|
PP = $27.90
|
|
MB = $29.30
|
Most Recent Note - 9/18/2013 12:45:14 PM
G - Rebounding toward its prior high with above average volume behind today's considerable gain. Recently noted - "It is still very extended from any sound base. Recent highs near $42 define initial support to watch on pullbacks."
>>> The latest Featured Stock Update with an annotated graph appeared on 8/30/2013. Click here.
View all notes |
Alert me of new notes |
CANSLIM.net Company Profile |
SEC |
Zacks Reports |
StockTalk |
News |
Chart |
Request a new note
C
A N
S L
I M
|
SSNC
-
NASDAQ
S S & C Technologies
COMPUTER SOFTWARE and SERVICES - Application Software
|
$39.45
|
+0.48
1.23% |
$39.94
|
944,856
260.51% of 50 DAV
50 DAV is 362,700
|
$39.69
-0.60%
|
9/5/2013
|
$36.01
|
PP = $38.90
|
|
MB = $40.85
|
Most Recent Note - 9/17/2013 3:22:08 PM
Y - Today's 4th consecutive gain has it rallying above its pivot point cited based on its 8/02/13 high plus 10 cents. Gains above the pivot point should have a minimum of +40% above average volume to trigger a proper technical buy signal.
>>> The latest Featured Stock Update with an annotated graph appeared on 9/5/2013. Click here.
View all notes |
Alert me of new notes |
CANSLIM.net Company Profile |
SEC |
Zacks Reports |
StockTalk |
News |
Chart |
Request a new note
C
A N
S L
I M
|
Symbol/Exchange
Company Name
Industry Group |
PRICE |
CHANGE
(%Change) |
Day High |
Volume
(% DAV)
(% 50 day avg vol) |
52 Wk Hi
% From Hi |
Featured
Date |
Price
Featured |
Pivot Featured |
|
Max Buy |
SSYS
-
NASDAQ
Stratasys Ltd
COMPUTER HARDWARE - Computer Peripherals
|
$97.71
|
+0.89
0.92% |
$98.50
|
1,366,265
128.94% of 50 DAV
50 DAV is 1,059,600
|
$113.49
-13.90%
|
7/8/2013
|
$91.44
|
PP = $95.00
|
|
MB = $99.75
|
Most Recent Note - 9/17/2013 3:34:35 PM
Y - Rebounding near its 50 DMA line after completing a new Public Offering on 9/13/13 perched near all-time highs.
>>> The latest Featured Stock Update with an annotated graph appeared on 9/10/2013. Click here.
View all notes |
Alert me of new notes |
CANSLIM.net Company Profile |
SEC |
Zacks Reports |
StockTalk |
News |
Chart |
Request a new note
C
A N
S L
I M
|
STMP
-
NASDAQ
Stamps.Com Inc
INTERNET - Internet Software and Services
|
$45.07
|
+0.64
1.44% |
$45.55
|
111,986
86.54% of 50 DAV
50 DAV is 129,400
|
$46.47
-3.01%
|
7/31/2013
|
$40.00
|
PP = $42.98
|
|
MB = $45.13
|
Most Recent Note - 9/17/2013 3:39:21 PM
Y - Poised for a best-ever close with today's small gain on light volume. Recently found encouraging support at its 50 DMA line.
>>> The latest Featured Stock Update with an annotated graph appeared on 8/23/2013. Click here.
View all notes |
Alert me of new notes |
CANSLIM.net Company Profile |
SEC |
Zacks Reports |
StockTalk |
News |
Chart |
Request a new note
C
A N
S L
I M
|
TBBK
-
NASDAQ
Bancorp Inc
BANKING - Regional - Mid-Atlantic Banks
|
$17.78
|
-0.16
-0.89% |
$18.01
|
137,561
81.74% of 50 DAV
50 DAV is 168,300
|
$18.38
-3.26%
|
9/4/2013
|
$16.26
|
PP = $16.79
|
|
MB = $17.63
|
Most Recent Note - 9/12/2013 1:03:15 PM
G - Perched at its 52-week high today following a streak of 10 consecutive gains, extended from its prior base. Prior highs define important near-term support to watch near $16 on pullbacks. Rallied +12% higher since highlighted on 9/04/13 under the headline, "Forming Sound Set-Up While "M" Correction Remains Overriding Concern".
>>> The latest Featured Stock Update with an annotated graph appeared on 9/4/2013. Click here.
View all notes |
Alert me of new notes |
CANSLIM.net Company Profile |
SEC |
Zacks Reports |
StockTalk |
News |
Chart |
Request a new note
C
A N
S L
I M
|
TNGO
-
NASDAQ
Tangoe Inc
COMPUTER SOFTWARE and SERVICES - Technical and System Software
|
$23.52
|
-0.09
-0.38% |
$23.70
|
479,120
94.04% of 50 DAV
50 DAV is 509,500
|
$23.72
-0.84%
|
9/12/2013
|
$21.30
|
PP = $23.15
|
|
MB = $24.31
|
Most Recent Note - 9/17/2013 6:43:01 PM
Y - Today's gain lacked sufficient volume conviction while wedging above its pivot point cited based on its May 2012 high plus 10 cents. See the latest FSU analysis for more details and a new annotated daily graph.
>>> The latest Featured Stock Update with an annotated graph appeared on 9/17/2013. Click here.
View all notes |
Alert me of new notes |
CANSLIM.net Company Profile |
SEC |
Zacks Reports |
StockTalk |
News |
Chart |
Request a new note
C
A N
S L
I M
|
VRX
-
NYSE
Valeant Pharmaceuticals
DRUGS - Drug Manufacturers - Other
|
$102.83
|
+0.06
0.06% |
$103.52
|
1,074,528
90.83% of 50 DAV
50 DAV is 1,183,000
|
$105.40
-2.44%
|
9/11/2013
|
$100.26
|
PP = $105.50
|
|
MB = $110.78
|
Most Recent Note - 9/17/2013 3:23:58 PM
Y- Wedging higher with gains lacking great volume conviction while rising toward the pivot point cited based on its 8/14/13 high plus 10 cents. Recent insider buying while trading near its highs has been noted as an encouraging sign.
>>> The latest Featured Stock Update with an annotated graph appeared on 9/11/2013. Click here.
View all notes |
Alert me of new notes |
CANSLIM.net Company Profile |
SEC |
Zacks Reports |
StockTalk |
News |
Chart |
Request a new note
C
A N
S L
I M
|
Symbol/Exchange
Company Name
Industry Group |
PRICE |
CHANGE
(%Change) |
Day High |
Volume
(% DAV)
(% 50 day avg vol) |
52 Wk Hi
% From Hi |
Featured
Date |
Price
Featured |
Pivot Featured |
|
Max Buy |
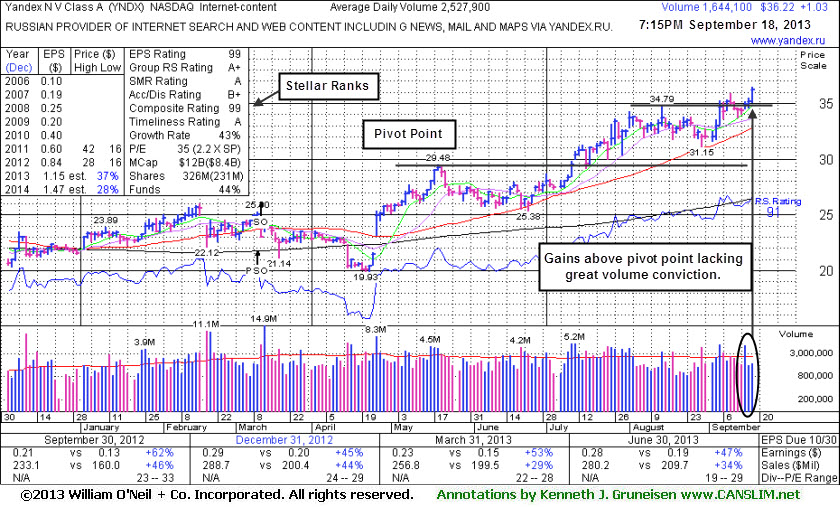
YNDX
-
NASDAQ
Yandex N V Class A
INTERNET - Internet Information Providers
|
$36.22
|
+1.03
2.93% |
$36.45
|
1,644,863
65.07% of 50 DAV
50 DAV is 2,527,900
|
$35.88
0.95%
|
9/5/2013
|
$34.24
|
PP = $34.79
|
|
MB = $36.53
|
Most Recent Note - 9/18/2013 7:38:09 PM
Y - Hit new 52-week and all-time highs today with lighter than average volume while approaching its "max buy" level. See the latest FSU analysis for more details and a new annotated graph.
>>> The latest Featured Stock Update with an annotated graph appeared on 9/18/2013. Click here.
View all notes |
Alert me of new notes |
CANSLIM.net Company Profile |
SEC |
Zacks Reports |
StockTalk |
News |
Chart |
Request a new note
C
A N
S L
I M
|