You are not logged in.
This means you
CAN ONLY VIEW reports that were published prior to Monday, April 14, 2025.
You
MUST UPGRADE YOUR MEMBERSHIP if you want to see any current reports.
AFTER MARKET UPDATE - WEDNESDAY, SEPTEMBER 17TH, 2014
Previous After Market Report Next After Market Report >>>
|
|
|
|
DOW |
+24.88 |
17,156.85 |
+0.15% |
|
Volume |
653,274,350 |
+3% |
|
Volume |
1,656,943,740 |
-5% |
|
NASDAQ |
+9.43 |
4,562.19 |
+0.21% |
|
Advancers |
1,582 |
50% |
|
Advancers |
1,564 |
55% |
|
S&P 500 |
+2.59 |
2,001.57 |
+0.13% |
|
Decliners |
1,503 |
47% |
|
Decliners |
1,156 |
41% |
|
Russell 2000 |
+2.92 |
1,153.89 |
+0.25% |
|
52 Wk Highs |
83 |
|
|
52 Wk Highs |
61 |
|
|
S&P 600 |
+1.39 |
661.91 |
+0.21% |
|
52 Wk Lows |
58 |
|
|
52 Wk Lows |
48 |
|
|
 |
Major Averages Rose and Dow Hit Another Record High
Kenneth J. Gruneisen - Passed the CAN SLIM® Master's Exam
The major averages finished higher on Wednesday. The Dow closed at fresh record high of 17,156 as it gained 24 points. The S&P 500 rose 2 points to 2,001. Volume totals were reported mixed, higher than the prior session total on the NYSE and lighter on the Nasdaq exchange. Breadth was slightly positive as advancers narrowly led decliners on the NYSE and by a 5-4 margin on the NASDAQ exchange. Leadership improved again as there were 41 high-ranked companies from the CANSLIM.net Leaders List that made new 52-week highs and appeared on the CANSLIM.net BreakOuts Page, up from the prior session total of 17 stocks. New 52-week highs totals also improved and outnumbered new lows on the Nasdaq exchange and on the NYSE. There were gains for 11 of the 13 high-ranked companies currently included on the Featured Stocks Page. The broader market (M criteria) overcame recent distributional pressure while leadership (stocks hitting new 52-week highs) remained healthy. Remember that disciplined investors buy stocks with superior fundamentals only after they have triggered a proper technical buy signal.
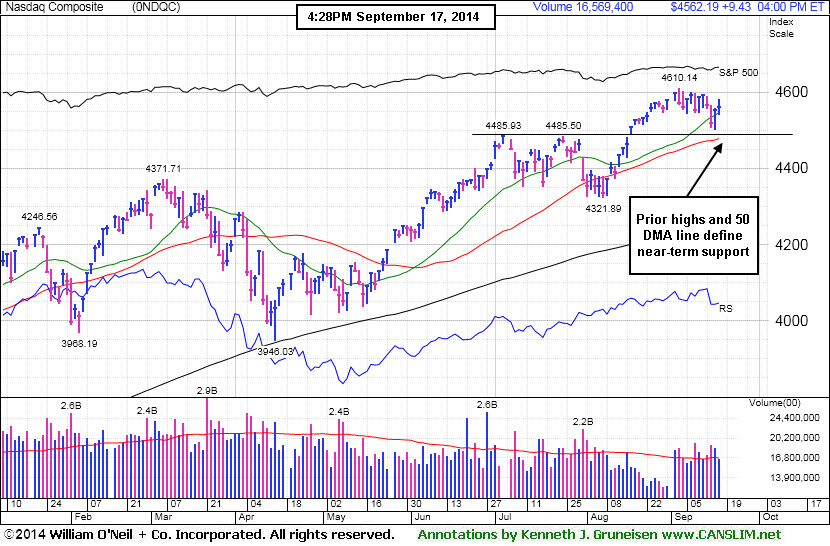
PICTURED: The Nasdaq Composite Index increased 9 points to 4,562. The tech-heavy index is consolidating above prior highs and above its 50-day moving average (DMA) line defining near-term support to watch.
Stocks rose for a second day as the FOMC statement revealed that the Fed retained its guidance that interest rates will remain low for a "considerable time" after its quantitative easing program ends in October. In addition, Chairwoman Janet Yellen reiterated during her press conference that any move in rates will be "data-dependent" and not based on a calendar projection.
On the economic front, a gauge of homebuilder confidence unexpectedly jumped to the best level since November 2005 while a separate report showed consumer prices fell last month for the first time since April 2013.
Overall, seven of the 10 S&P 500 sectors advanced. Materials and financials were the best performing groups. DuPont (DD +5%) jumped after an activist investor called for a break-up of the company. Bank of America (BAC +0.6%) rose. Industrials also helped lift the market. FedEx (FDX +3.3%) rose after reporting better-than-expected earnings results. Energy stocks retreated as WTI crude fell from a two-week high, and Schlumberger (SLB -1.6%) fell.
Treasuries declined following the FOMC statement. The 10-year note fell 5/32 to yield 2.61%.
The CANSLIM.net Featured Stocks Page shows the most action-worthy candidates and their latest notes and a Headline Link directs members to the latest detailed analysis with data-packed graphs annotated by a Certified expert along with links to additional resources. The Premium Member Homepage includes "dynamic archives" to all prior pay reports published.
|
 Kenneth J. Gruneisen started out as a licensed stockbroker in August 1987, a couple of months prior to the historic stock market crash that took the Dow Jones Industrial Average down -22.6% in a single day. He has published daily fact-based fundamental and technical analysis on high-ranked stocks online for two decades. Through FACTBASEDINVESTING.COM, Kenneth provides educational articles, news, market commentary, and other information regarding proven investment systems that work in good times and bad.
Comments contained in the body of this report are technical opinions only and are not necessarily those of Gruneisen Growth Corp. The material herein has been obtained from sources believed to be reliable and accurate, however, its accuracy and completeness cannot be guaranteed. Our firm, employees, and customers may effect transactions, including transactions contrary to any recommendation herein, or have positions in the securities mentioned herein or options with respect thereto. Any recommendation contained in this report may not be suitable for all investors and it is not to be deemed an offer or solicitation on our part with respect to the purchase or sale of any securities. |
|
 |
Financial and Tech Groups Rose; Commodity-Linked Groups Fell
Kenneth J. Gruneisen - Passed the CAN SLIM® Master's Exam
The Broker/Dealer Index ($XBD +0.93%) and the Bank Index ($BKX +0.65%) rose as financials underpinned the major averages rally on Wednesday. The Biotechnology Index ($BTK +0.38%) and the Semiconductor Index ($SOX +0.73%) tallied modest gains while the Networking Index ($NWX -0.12%) and the Retail Index ($RLX -0.09%) inched lower. Energy-related shares retreated as the Oil Services Index ($OSX -1.35%) outpaced the Integrated Oil Index ($XOI -0.32%) to the downside.
Charts courtesy www.stockcharts.com
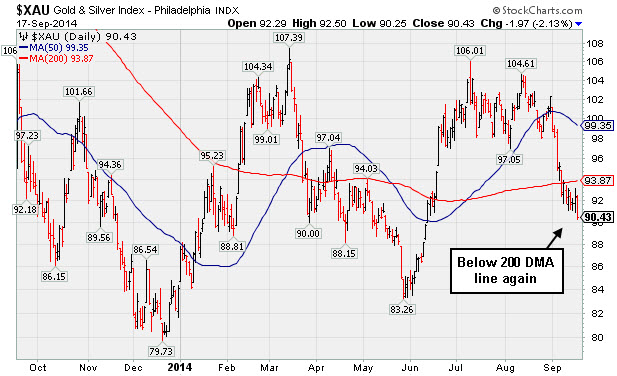
PICTURED: The Gold & Silver Index ($XAU -2.13%) slumped further below its 200-day moving average (DMA) line with a large loss.
| Oil Services |
$OSX |
279.18 |
-3.82 |
-1.35% |
-0.66% |
| Integrated Oil |
$XOI |
1,626.73 |
-5.16 |
-0.32% |
+8.22% |
| Semiconductor |
$SOX |
647.83 |
+4.71 |
+0.73% |
+21.08% |
| Networking |
$NWX |
336.42 |
-0.39 |
-0.12% |
+3.85% |
| Broker/Dealer |
$XBD |
174.31 |
+1.61 |
+0.93% |
+8.56% |
| Retail |
$RLX |
943.03 |
-0.88 |
-0.09% |
+0.34% |
| Gold & Silver |
$XAU |
90.43 |
-1.97 |
-2.13% |
+7.46% |
| Bank |
$BKX |
73.05 |
+0.47 |
+0.65% |
+5.47% |
| Biotech |
$BTK |
3,093.92 |
+11.71 |
+0.38% |
+32.76% |
|
|
|
 |
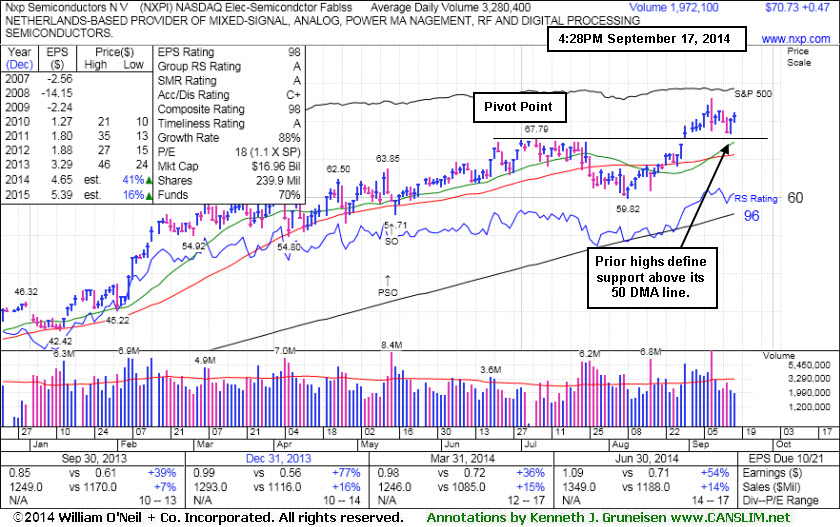
Consolidating Above Pivot Point and Below "Max Buy" Level
Kenneth J. Gruneisen - Passed the CAN SLIM® Master's Exam
Nxp Semiconductors N V (NXPI +$0.47 or +0.67% to $70.73) has recently been consolidating above prior highs in the $67 area and above its 50-day moving average (DMA) line defining near-term support to watch on pullbacks. It is perched -3.2% off its 52-week high, remaining above its pivot point and below its "max buy" level. No overhead supply remains to act as resistance. Disciplined investors avoid chasing stocks more than +5% above their prior high or pivot point and always limit losses by selling any stock that falls more than -7% from their purchase price.
NXPI was last shown in this FSU section on 8/29/14 with annotated graphs under the headline, "Gap Up For New High With Volume Triggered Technical Buy Signal", after highlighted in yellow with pivot point cited based on its 7/07/14 high plus 10 cents in the earlier mid-day report (read here). Its gap up gain backed by +95% above average volume helped it trigger a technical buy signal.
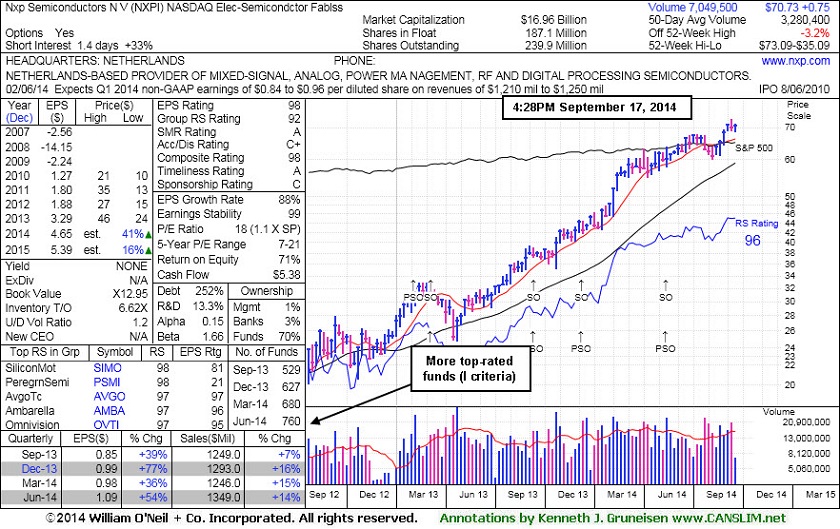
Quarterly earnings (C criteria) through Jun '14 have shown strong growth and its annual earnings (A criteria) history is a good match the investment system guidelines. The number of top-rated funds owning its shares rose from 530 in Sep '13 to 760 in Jun '14, a reassuring sign concerning the I criteria. The Elec - Semicondctor Fablss group has a high 92 Group Relative Strength Rating and leadership from others in the industry group is a reassuring sign concerning the L criteria. It completed a Secondary Offering on 5/14/14 and earlier Secondary Offerings on 2/04/13, 3/08/13, 9/13/13, and 12/10/13.
|
|
|
Color Codes Explained :
Y - Better candidates highlighted by our
staff of experts.
G - Previously featured
in past reports as yellow but may no longer be buyable under the
guidelines.
***Last / Change / Volume data in this table is the closing quote data***
Symbol/Exchange
Company Name
Industry Group |
PRICE |
CHANGE
(%Change) |
Day High |
Volume
(% DAV)
(% 50 day avg vol) |
52 Wk Hi
% From Hi |
Featured
Date |
Price
Featured |
Pivot Featured |
|
Max Buy |
ACT
-
NYSE
Actavis plc
Medical-Generic Drugs
|
$237.09
|
-1.67
-0.70% |
$238.78
|
2,237,306
106.23% of 50 DAV
50 DAV is 2,106,000
|
$239.58
-1.04%
|
6/20/2014
|
$216.53
|
PP = $230.87
|
|
MB = $242.41
|
Most Recent Note - 9/12/2014 11:57:54 AM
Y - Hitting a new 52-week high today with volume running at an above average pace. Gains above a stock's pivot point must be backed by a minimum of +40% above average volume to trigger a technical buy signal.
>>> FEATURED STOCK ARTICLE : Quietly Perched Within Striking Distance of 52-Week High - 8/28/2014
View all notes |
Set NEW NOTE alert |
CANSLIM.net Company Profile |
SEC
News |
Chart |
Request a new note
C
A N
S L
I M


|
BITA
-
NYSE
Bitauto Hldgs Ltd Ads
Internet-Content
|
$83.76
|
+1.81
2.21% |
$85.41
|
1,478,561
86.42% of 50 DAV
50 DAV is 1,711,000
|
$98.28
-14.77%
|
6/26/2014
|
$46.20
|
PP = $47.03
|
|
MB = $49.38
|
Most Recent Note - 9/15/2014 7:37:12 PM
G - Erased early gains and suffered another loss with above average volume. Recently enduring distributional pressure while fundamentals remain strong. Noted repeatedly with caution - "Has the look of a 'climax run' with volume-driven gains getting very extended from its prior base."
>>> FEATURED STOCK ARTICLE : Finished Near Session Low - Noted With Look of "Climax Run" - 8/27/2014
View all notes |
Set NEW NOTE alert |
CANSLIM.net Company Profile |
SEC
News |
Chart |
Request a new note
C
A N
S L
I M
|
EQM
-
NYSE
E Q T Midstream Partners
ENERGY - Oil and Gas Pipelines
|
$90.12
|
+0.55
0.61% |
$90.52
|
141,734
80.99% of 50 DAV
50 DAV is 175,000
|
$102.51
-12.09%
|
12/12/2013
|
$53.17
|
PP = $56.51
|
|
MB = $59.34
|
Most Recent Note - 9/12/2014 6:05:53 PM
G - Violated its 50 DMA line raising concerns with a loss today on higher volume indicative of distributional pressure. Reported earnings +37% on +21% sales revenues for the Jun '14 quarter, an improvement after 2 sub par quarterly earnings comparisons.
>>> FEATURED STOCK ARTICLE : Forming New Base But Fundamental Flaws Remain a Concern - 9/3/2014
View all notes |
Set NEW NOTE alert |
CANSLIM.net Company Profile |
SEC
News |
Chart |
Request a new note
C
A N
S L
I M
|
FB
-
NASDAQ
Facebook Inc Cl A
INTERNET
|
$76.43
|
+0.35
0.46% |
$77.25
|
28,392,172
76.86% of 50 DAV
50 DAV is 36,942,000
|
$78.36
-2.46%
|
9/9/2014
|
$76.67
|
PP = $76.84
|
|
MB = $80.68
|
Most Recent Note - 9/15/2014 3:31:32 PM
Y - Down considerably with heavy volume behind today's loss, action indicative of distributional pressure. Prior notes cautioned members "Recent gains lacked great volume conviction while gains above a stock's pivot point must have at least +40% above averages volume to trigger a proper new (or add-on) technical buy signal. See the latest FSU analysis for more details and annotated graphs. Prior highs in the $72 area define initial support along with its 50 DMA line."
>>> FEATURED STOCK ARTICLE : Wedging Gains Not Indicative of Institutional Conviction - 9/9/2014
View all notes |
Set NEW NOTE alert |
CANSLIM.net Company Profile |
SEC
News |
Chart |
Request a new note
C
A N
S L
I M
|
NVGS
-
NYSE
Navigator Holdings Ltd
Transportation-Ship
|
$31.49
|
+0.97
3.18% |
$31.55
|
982,615
488.86% of 50 DAV
50 DAV is 201,000
|
$30.75
2.41%
|
9/16/2014
|
$30.33
|
PP = $30.56
|
|
MB = $32.09
|
 Most Recent Note - 9/17/2014 4:09:01 PM
Y - No resistance remains due to overhead supply and it ended near the session high at a new 52-week high (N criteria) while triggering a convincing technical buy signal with today's 4th volume-driven gain in the span of 5 sessions. Highlighted in yellow in the 9/16/14 mid-day report (read here). See the latest FSU analysis for more details and annotated graphs.
>>> FEATURED STOCK ARTICLE : Finished Strong While Challenging Pivot Point and Recent Highs - 9/16/2014
View all notes |
Set NEW NOTE alert |
CANSLIM.net Company Profile |
SEC
News |
Chart |
Request a new note
C
A N
S L
I M
|
Symbol/Exchange
Company Name
Industry Group |
PRICE |
CHANGE
(%Change) |
Day High |
Volume
(% DAV)
(% 50 day avg vol) |
52 Wk Hi
% From Hi |
Featured
Date |
Price
Featured |
Pivot Featured |
|
Max Buy |
NXPI
-
NASDAQ
Nxp Semiconductors N V
ELECTRONICS - Semiconductor - Broad Line
|
$70.73
|
+0.47
0.67% |
$71.24
|
1,973,472
60.17% of 50 DAV
50 DAV is 3,280,000
|
$73.09
-3.23%
|
8/29/2014
|
$68.50
|
PP = $67.89
|
|
MB = $71.28
|
Most Recent Note - 9/17/2014 5:40:38 PM
Y - Perched -3.2% off its 52-week high, still consolidating above its pivot point and below its "max buy" level. No overhead supply remains to act as resistance. Prior highs in the $67 area define initial support to watch on pullbacks. See the latest FSU analysis for more details and new annotated graphs.
>>> FEATURED STOCK ARTICLE : Consolidating Above Pivot Point and Below "Max Buy" Level - 9/17/2014
View all notes |
Set NEW NOTE alert |
CANSLIM.net Company Profile |
SEC
News |
Chart |
Request a new note
C
A N
S L
I M
|
PANW
-
NYSE
Palo Alto Networks
Computer Sftwr-Security
|
$98.61
|
+0.28
0.28% |
$100.75
|
1,795,193
107.43% of 50 DAV
50 DAV is 1,671,000
|
$102.45
-3.75%
|
7/30/2014
|
$84.21
|
PP = $85.88
|
|
MB = $90.17
|
Most Recent Note - 9/15/2014 12:47:25 PM
G - Perched near its 52-week high following considerable volume-driven gains last week while getting extended from any sound base. No resistance remains due to overhead supply. Prior highs in the $87 area define initial support to watch above its 50 DMA line. Reported earnings +57% on +59% sales revenues for the Jul '14 quarter, continuing its strong earnings history satisfying the C criteria. Its Earnings Per Share (EPS) Rating is right at the 80+ minimum guideline for buy candidates.
>>> FEATURED STOCK ARTICLE : Pulling Back Following New Technical Breakout - 9/4/2014
View all notes |
Set NEW NOTE alert |
CANSLIM.net Company Profile |
SEC
News |
Chart |
Request a new note
C
A N
S L
I M
|
STRT
-
NASDAQ
Strattec Security Corp
AUTOMOTIVE - Auto Parts
|
$84.53
|
+0.14
0.17% |
$86.11
|
8,859
42.19% of 50 DAV
50 DAV is 21,000
|
$89.87
-5.95%
|
8/22/2014
|
$71.47
|
PP = $73.97
|
|
MB = $77.67
|
Most Recent Note - 9/15/2014 7:34:25 PM
G - Perched -6.6% off its 52-week high, consolidating after getting extended from its prior base. Prior highs in the $74-77 area define initial support to watch on pullbacks.
>>> FEATURED STOCK ARTICLE : Extended From Prior Highs and Previously Noted Base - 9/10/2014
View all notes |
Set NEW NOTE alert |
CANSLIM.net Company Profile |
SEC
News |
Chart |
Request a new note
C
A N
S L
I M
|
TARO
-
NYSE
Taro Pharmaceutical Inds
DRUGS - Drug Manufacturers - Other
|
$158.80
|
+2.33
1.49% |
$159.65
|
186,642
219.58% of 50 DAV
50 DAV is 85,000
|
$165.30
-3.93%
|
7/30/2014
|
$144.24
|
PP = $149.99
|
|
MB = $157.49
|
Most Recent Note - 9/15/2014 7:35:16 PM
G - Consolidating near its 50 DMA line and -8.4% off its 52-week high. Recently enduring distributional pressure and noted with caution - "Extended from any sound base. Recently reported earnings for the Jun '14 quarter below the +25% minimum earnings guideline (C criteria) raising fundamental concerns."
>>> FEATURED STOCK ARTICLE : Churning Action Indicative of Distributional Pressure - 9/2/2014
View all notes |
Set NEW NOTE alert |
CANSLIM.net Company Profile |
SEC
News |
Chart |
Request a new note
C
A N
S L
I M
|
TRN
-
NYSE
Trinity Industries Inc
TRANSPORTATION - Railroads
|
$48.76
|
+0.64
1.33% |
$49.50
|
2,878,653
117.98% of 50 DAV
50 DAV is 2,440,000
|
$50.43
-3.31%
|
4/30/2014
|
$37.79
|
PP = $38.03
|
|
MB = $39.93
|
Most Recent Note - 9/12/2014 6:07:07 PM
G - Pulling back since a "negative reversal" at its 52-week high on 9/03/14. It has not formed a sound base. Prior highs near $46-47 define near-term support above its 50 DMA line. See the latest FSU analysis for more details and new annotated graphs.
>>> FEATURED STOCK ARTICLE : Consolidating Above 50-Day Moving Average Line - 9/12/2014
View all notes |
Set NEW NOTE alert |
CANSLIM.net Company Profile |
SEC
News |
Chart |
Request a new note
C
A N
S L
I M
|
Symbol/Exchange
Company Name
Industry Group |
PRICE |
CHANGE
(%Change) |
Day High |
Volume
(% DAV)
(% 50 day avg vol) |
52 Wk Hi
% From Hi |
Featured
Date |
Price
Featured |
Pivot Featured |
|
Max Buy |
UA
-
NYSE
Under Armour Inc Cl A
CONSUMER NON-DURABLES - Textile - Apparel Clothing
|
$69.09
|
+1.34
1.98% |
$69.60
|
2,506,238
104.47% of 50 DAV
50 DAV is 2,399,000
|
$73.42
-5.90%
|
7/10/2014
|
$58.50
|
PP = $60.79
|
|
MB = $63.83
|
Most Recent Note - 9/15/2014 7:25:46 PM
G - Testing support at its 50 DMA line ($66.73) with higher volume behind today's 5th consecutive loss while retreating from its 52-week high. Fundamental concerns were raised by earnings reported +0% on +34% sales revenues for the Jun '14 quarter, below the +25% minimum earnings guideline (C criteria). See the latest FSU analysis for more details and new annotated graphs.
>>> FEATURED STOCK ARTICLE : Higher Volume Behind Loss Testing 50-Day Moving Average - 9/15/2014
View all notes |
Set NEW NOTE alert |
CANSLIM.net Company Profile |
SEC
News |
Chart |
Request a new note
C
A N
S L
I M
|
WLK
-
NYSE
Westlake Chemical Corp
CHEMICALS - Specialty Chemicals
|
$93.88
|
+0.15
0.16% |
$94.78
|
366,304
72.11% of 50 DAV
50 DAV is 508,000
|
$98.44
-4.63%
|
4/29/2014
|
$72.79
|
PP = $69.31
|
|
MB = $72.78
|
Most Recent Note - 9/16/2014 8:17:56 PM
G - Churned higher volume today while consolidating above prior highs in the $92 area defining support above its 50 DMA line. Subsequent violations would raise greater concerns and trigger technical sell signals. Technical strength has continued despite recent fundamental concerns.
>>> FEATURED STOCK ARTICLE : Consolidating Above Near-Term Support Levels - 9/11/2014
View all notes |
Set NEW NOTE alert |
CANSLIM.net Company Profile |
SEC
News |
Chart |
Request a new note
C
A N
S L
I M
|
YY
-
NASDAQ
YY Inc Ads
INTERNET - Internet Service Providers
|
$80.95
|
-2.24
-2.69% |
$84.49
|
1,765,980
113.42% of 50 DAV
50 DAV is 1,557,000
|
$96.39
-16.02%
|
8/19/2014
|
$85.81
|
PP = $91.03
|
|
MB = $95.58
|
Most Recent Note - 9/17/2014 4:04:42 PM
G - Rebounded on the prior session but slumped back below its 50 DMA line today and finished near the session low. Disciplined investors always limit losses by selling any stock that falls more than -7% from their purchase price.
>>> FEATURED STOCK ARTICLE : Perched at High After Triggering Technical Buy Signal - 9/5/2014
View all notes |
Set NEW NOTE alert |
CANSLIM.net Company Profile |
SEC
News |
Chart |
Request a new note
C
A N
S L
I M
|
|
|
|
THESE ARE NOT BUY RECOMMENDATIONS!
Comments contained in the body of this report are technical
opinions only. The material herein has been obtained
from sources believed to be reliable and accurate, however,
its accuracy and completeness cannot be guaranteed.
This site is not an investment advisor, hence it does
not endorse or recommend any securities or other investments.
Any recommendation contained in this report may not
be suitable for all investors and it is not to be deemed
an offer or solicitation on our part with respect to
the purchase or sale of any securities. All trademarks,
service marks and trade names appearing in this report
are the property of their respective owners, and are
likewise used for identification purposes only.
This report is a service available
only to active Paid Premium Members.
You may opt-out of receiving report notifications
at any time. Questions or comments may be submitted
by writing to Premium Membership Services 665 S.E. 10 Street, Suite 201 Deerfield Beach, FL 33441-5634 or by calling 1-800-965-8307
or 954-785-1121.
|
|
|

