***Last / Change / Volume data in this table is the closing quote data***
Symbol/Exchange
Company Name
Industry Group |
PRICE |
CHANGE
(%Change) |
Day High |
Volume
(% DAV)
(% 50 day avg vol) |
52 Wk Hi
% From Hi |
Featured
Date |
Price
Featured |
Pivot Featured |
|
Max Buy |
ABV
-
NYSE
Comp De Bebidas Adr
FOOD and BEVERAGE - Beverages - Brewers
|
$120.08
|
-0.83
-0.69% |
$121.55
|
471,386
76.33% of 50 DAV
50 DAV is 617,600
|
$121.07
-0.82%
|
6/29/2010
|
$104.74
|
PP = $109.33
|
|
MB = $114.80
|
 Most Recent Note - 9/17/2010 4:19:00 PM
G - This Brazil-based beverage firm hit another new all-time high today. Extended from a sound base, its prior highs in the $111-112 area define support above its 50 DMA line.
>>> The latest Featured Stock Update with an annotated graph appeared on 8/18/2010. Click here.
View all notes |
Alert me of new notes |
CANSLIM.net Company Profile |
SEC |
Zacks Reports |
StockTalk |
News |
Chart |
Request a new note
C
A N
S L
I M


|
ARUN
-
NASDAQ
Aruba Networks Inc
COMPUTER HARDWARE - Networking andamp; Communication Dev
|
$20.84
|
-0.08
-0.38% |
$21.29
|
2,629,116
140.09% of 50 DAV
50 DAV is 1,876,700
|
$20.94
-0.48%
|
8/30/2010
|
$18.12
|
PP = $18.51
|
|
MB = $19.44
|
Most Recent Note - 9/16/2010 4:55:10 PM
G - Hit yet another new 52-week high today with average volume behind its gain, and it closed near the session high. Extended from its latest base, its prior highs near $18 define a chart support level to watch.
>>> The latest Featured Stock Update with an annotated graph appeared on 9/2/2010. Click here.
View all notes |
Alert me of new notes |
CANSLIM.net Company Profile |
SEC |
Zacks Reports |
StockTalk |
News |
Chart |
Request a new note
C
A N
S L
I M
|
BIDU
-
NASDAQ
Baidu Inc Ads
INTERNET - Internet Information Providers
|
$85.73
|
-0.36
-0.42% |
$86.70
|
6,452,011
66.39% of 50 DAV
50 DAV is 9,717,800
|
$88.32
-2.93%
|
9/17/2010
|
$85.73
|
PP = $88.42
|
|
MB = $92.84
|
Most Recent Note - 9/17/2010 4:36:17 PM
Y - Volume has been cooling in recent weeks while building a late-stage base. It is perched near all-time highs after a 6-week consolidation, and a new pivot point is cited based on its all-time high plus ten cents.
>>> The latest Featured Stock Update with an annotated graph appeared on 8/13/2010. Click here.
View all notes |
Alert me of new notes |
CANSLIM.net Company Profile |
SEC |
Zacks Reports |
StockTalk |
News |
Chart |
Request a new note
C
A N
S L
I M
|
CACC
-
NASDAQ
Credit Acceptance Corp
FINANCIAL SERVICES - Credit Services
|
$61.47
|
+0.33
0.54% |
$62.14
|
39,309
81.22% of 50 DAV
50 DAV is 48,400
|
$63.45
-3.12%
|
7/29/2010
|
$52.04
|
PP = $54.07
|
|
MB = $56.77
|
Most Recent Note - 9/16/2010 3:29:05 PM
G - Pulling back toward prior highs after a rally from a short (4-week) flat base. The minimum length for a valid flat base is 5 weeks, so its $61.41 high of 8/18/10 was not cited as the basis for a new pivot point.
>>> The latest Featured Stock Update with an annotated graph appeared on 8/2/2010. Click here.
View all notes |
Alert me of new notes |
CANSLIM.net Company Profile |
SEC |
Zacks Reports |
StockTalk |
News |
Chart |
Request a new note
C
A N
S L
I M
|
CMG
-
NYSE
Chipotle Mexican Grill
LEISURE - Restaurants
|
$168.31
|
+1.28
0.77% |
$168.72
|
514,112
72.07% of 50 DAV
50 DAV is 713,400
|
$170.00
-0.99%
|
9/1/2010
|
$158.31
|
PP = $155.52
|
|
MB = $163.30
|
Most Recent Note - 9/16/2010 12:29:05 PM
G - Pulling back today after 4 consecutive gains with below average volume. Extended from prior highs in the $155 area that define chart support.
>>> The latest Featured Stock Update with an annotated graph appeared on 9/1/2010. Click here.
View all notes |
Alert me of new notes |
CANSLIM.net Company Profile |
SEC |
Zacks Reports |
StockTalk |
News |
Chart |
Request a new note
C
A N
S L
I M
|
Symbol/Exchange
Company Name
Industry Group |
PRICE |
CHANGE
(%Change) |
Day High |
Volume
(% DAV)
(% 50 day avg vol) |
52 Wk Hi
% From Hi |
Featured
Date |
Price
Featured |
Pivot Featured |
|
Max Buy |
CRM
-
NYSE
Salesforce.Com Inc
INTERNET - Internet Software and Services
|
$116.74
|
-0.18
-0.15% |
$118.20
|
2,673,404
102.90% of 50 DAV
50 DAV is 2,598,000
|
$122.00
-4.31%
|
6/2/2010
|
$88.44
|
PP = $89.60
|
|
MB = $94.08
|
Most Recent Note - 9/15/2010 5:36:39 PM
G - Hovering near its all-time high, extended from a sound base, not currently buyable under the investment system guidelines.
>>> The latest Featured Stock Update with an annotated graph appeared on 8/16/2010. Click here.
View all notes |
Alert me of new notes |
CANSLIM.net Company Profile |
SEC |
Zacks Reports |
StockTalk |
News |
Chart |
Request a new note
C
A N
S L
I M
|
EGO
-
NYSE
Eldorado Gold Corp
METALS and MINING - Gold
|
$19.49
|
-0.38
-1.91% |
$20.12
|
9,728,779
240.75% of 50 DAV
50 DAV is 4,041,100
|
$20.23
-3.66%
|
8/19/2010
|
$18.25
|
PP = $19.17
|
|
MB = $20.13
|
Most Recent Note - 9/17/2010 4:39:17 PM
Y - Loss today with above average volume is indicative of distributional pressure. Prior highs in the $18-19 area define the initial chart support level to watch above its 50 DMA line.
>>> The latest Featured Stock Update with an annotated graph appeared on 8/19/2010. Click here.
View all notes |
Alert me of new notes |
CANSLIM.net Company Profile |
SEC |
Zacks Reports |
StockTalk |
News |
Chart |
Request a new note
C
A N
S L
I M
|
FFIV
-
NASDAQ
F 5 Networks Inc
INTERNET - Internet Software and Services
|
$100.98
|
+0.46
0.46% |
$101.33
|
1,344,243
79.98% of 50 DAV
50 DAV is 1,680,800
|
$100.92
0.06%
|
6/16/2010
|
$74.50
|
PP = $74.10
|
|
MB = $77.81
|
Most Recent Note - 9/16/2010 4:50:51 PM
G - Gain today with below average volume for another new all-time high. Upward trendline connecting July-August lows defines an initial chart support level well above its 50 DMA line.
>>> The latest Featured Stock Update with an annotated graph appeared on 9/13/2010. Click here.
View all notes |
Alert me of new notes |
CANSLIM.net Company Profile |
SEC |
Zacks Reports |
StockTalk |
News |
Chart |
Request a new note
C
A N
S L
I M
|
FOSL
-
NASDAQ
Fossil Inc
CONSUMER DURABLES - Recreational Goods, Other
|
$51.58
|
-0.30
-0.57% |
$52.08
|
1,173,743
156.35% of 50 DAV
50 DAV is 750,700
|
$52.07
-0.94%
|
8/10/2010
|
$45.54
|
PP = $42.69
|
|
MB = $44.82
|
Most Recent Note - 9/14/2010 3:57:02 PM
G - Gain today with average volume for another new all-time high. Extended from any sound base after a recent streak of gains, its prior high in the $46 area defines support to watch.
>>> The latest Featured Stock Update with an annotated graph appeared on 8/11/2010. Click here.
View all notes |
Alert me of new notes |
CANSLIM.net Company Profile |
SEC |
Zacks Reports |
StockTalk |
News |
Chart |
Request a new note
C
A N
S L
I M
|
GMCR
-
NASDAQ
Green Mtn Coffee Roastrs
FOOD and BEVERAGE - Processed and Packaged Goods
|
$35.43
|
-0.26
-0.73% |
$35.91
|
2,606,477
109.63% of 50 DAV
50 DAV is 2,377,500
|
$35.94
-1.42%
|
8/17/2010
|
$33.62
|
PP = $33.30
|
|
MB = $34.97
|
Most Recent Note - 9/15/2010 11:35:59 AM
G - At its 52-week high after brief trading under its "max buy" level on the prior session and earlier today. Prior highs in the $33 area define support to watch.
>>> The latest Featured Stock Update with an annotated graph appeared on 8/17/2010. Click here.
View all notes |
Alert me of new notes |
CANSLIM.net Company Profile |
SEC |
Zacks Reports |
StockTalk |
News |
Chart |
Request a new note
C
A N
S L
I M
|
Symbol/Exchange
Company Name
Industry Group |
PRICE |
CHANGE
(%Change) |
Day High |
Volume
(% DAV)
(% 50 day avg vol) |
52 Wk Hi
% From Hi |
Featured
Date |
Price
Featured |
Pivot Featured |
|
Max Buy |
HS
-
NYSE
Healthspring Inc
HEALTH SERVICES - Health Care Plans
|
$22.80
|
+0.16
0.71% |
$22.94
|
1,315,451
208.31% of 50 DAV
50 DAV is 631,500
|
$23.47
-2.85%
|
8/27/2010
|
$19.91
|
PP = $19.75
|
|
MB = $20.74
|
Most Recent Note - 9/14/2010 5:22:22 PM
G - Holding its ground near its 52-week high and all-time high. Extended from its prior base, support to watch now is prior chart highs in the $19-20 area.
>>> The latest Featured Stock Update with an annotated graph appeared on 8/27/2010. Click here.
View all notes |
Alert me of new notes |
CANSLIM.net Company Profile |
SEC |
Zacks Reports |
StockTalk |
News |
Chart |
Request a new note
C
A N
S L
I M
|
IGTE
-
NASDAQ
Igate Corp
COMPUTER SOFTWARE and SERVICES - Information Technology Service
|
$17.62
|
+0.24
1.38% |
$17.84
|
833,145
212.37% of 50 DAV
50 DAV is 392,300
|
$18.80
-6.28%
|
9/8/2010
|
$17.29
|
PP = $18.26
|
|
MB = $19.17
|
Most Recent Note - 9/17/2010 2:11:29 PM
Y - Dipped near its 50 DMA earlier and now it has rebounded into positive territory, a sign of prompt support. Its slump into its prior base raised concerns after its recent breakout from a riskier "late stage" base pattern.
>>> The latest Featured Stock Update with an annotated graph appeared on 9/10/2010. Click here.
View all notes |
Alert me of new notes |
CANSLIM.net Company Profile |
SEC |
Zacks Reports |
StockTalk |
News |
Chart |
Request a new note
C
A N
S L
I M
|
JOBS
-
NASDAQ
Fifty One Job Inc Ads
DIVERSIFIED SERVICES - Staffing and; Outsourcing Service
|
$36.01
|
+4.12
12.92% |
$36.19
|
709,739
796.56% of 50 DAV
50 DAV is 89,100
|
$32.38
11.21%
|
9/16/2010
|
$31.59
|
PP = $30.40
|
|
MB = $31.92
|
Most Recent Note - 9/17/2010 1:05:48 PM
G - Considerable gain today with heavy volume for a second consecutive session, quickly getting extended more than +5% above its prior chart high. Closed strong on the prior session and confirmed a new technical buy signal.
>>> The latest Featured Stock Update with an annotated graph appeared on 9/16/2010. Click here.
View all notes |
Alert me of new notes |
CANSLIM.net Company Profile |
SEC |
Zacks Reports |
StockTalk |
News |
Chart |
Request a new note
C
A N
S L
I M
|
MELI
-
NASDAQ
Mercadolibre Inc
INTERNET - Internet Software and; Services
|
$72.48
|
-1.26
-1.71% |
$72.85
|
821,811
95.82% of 50 DAV
50 DAV is 857,700
|
$74.78
-3.08%
|
5/13/2010
|
$54.21
|
PP = $55.85
|
|
MB = $58.64
|
Most Recent Note - 9/17/2010 10:18:51 AM
G - Gapped down today. In recent weeks it wedged to new high ground with light volume behind gains as it got extended from a sound base. Its 50 DMA line defines important chart support.
>>> The latest Featured Stock Update with an annotated graph appeared on 8/26/2010. Click here.
View all notes |
Alert me of new notes |
CANSLIM.net Company Profile |
SEC |
Zacks Reports |
StockTalk |
News |
Chart |
Request a new note
C
A N
S L
I M
|
MRX
-
NYSE
Medicis Pharmaceut Cl A
DRUGS - Biotechnology
|
$29.21
|
-0.20
-0.68% |
$29.61
|
1,194,013
98.01% of 50 DAV
50 DAV is 1,218,300
|
$30.26
-3.47%
|
8/12/2010
|
$26.88
|
PP = $26.71
|
|
MB = $28.05
|
Most Recent Note - 9/16/2010 12:55:28 PM
G - Gapped up today and hit a new 52-week high. Prior highs in the $28 area define the initial chart support level to watch.
>>> The latest Featured Stock Update with an annotated graph appeared on 8/12/2010. Click here.
View all notes |
Alert me of new notes |
CANSLIM.net Company Profile |
SEC |
Zacks Reports |
StockTalk |
News |
Chart |
Request a new note
C
A N
S L
I M
|
Symbol/Exchange
Company Name
Industry Group |
PRICE |
CHANGE
(%Change) |
Day High |
Volume
(% DAV)
(% 50 day avg vol) |
52 Wk Hi
% From Hi |
Featured
Date |
Price
Featured |
Pivot Featured |
|
Max Buy |
MWIV
-
NASDAQ
M W I Veterinary Supply
HEALTH SERVICES - Medical Instruments and; Supplies
|
$55.18
|
+0.45
0.82% |
$55.36
|
66,870
89.64% of 50 DAV
50 DAV is 74,600
|
$57.34
-3.77%
|
7/29/2010
|
$52.05
|
PP = $52.09
|
|
MB = $54.69
|
Most Recent Note - 9/14/2010 3:54:42 PM
G - Today's gain without great volume conviction has it trading above its "max buy" level and the color code is changed to green. Its 50 DMA line defines important chart support.
>>> The latest Featured Stock Update with an annotated graph appeared on 9/7/2010. Click here.
View all notes |
Alert me of new notes |
CANSLIM.net Company Profile |
SEC |
Zacks Reports |
StockTalk |
News |
Chart |
Request a new note
C
A N
S L
I M
|
NEM
-
NYSE
Newmont Mining Corp
METALS and MINING - Gold
|
$63.01
|
-0.17
-0.27% |
$63.63
|
6,148,338
95.00% of 50 DAV
50 DAV is 6,472,000
|
$64.03
-1.59%
|
8/31/2010
|
$61.32
|
PP = $63.48
|
|
MB = $66.65
|
Most Recent Note - 9/14/2010 1:13:37 PM
Y - Gapped up today, rallying with above average volume for a considerable gain above its pivot point. It hit a new 52-week high, and no overhead supply remains to hinder its progress. Leadership in the Mining - Gold/Silver/Gems group (L criteria) is a nice reassurance.
>>> The latest Featured Stock Update with an annotated graph appeared on 9/14/2010. Click here.
View all notes |
Alert me of new notes |
CANSLIM.net Company Profile |
SEC |
Zacks Reports |
StockTalk |
News |
Chart |
Request a new note
C
A N
S L
I M
|
NEOG
-
NASDAQ
Neogen Corp
DRUGS - Diagnostic Substances
|
$31.89
|
+0.87
2.80% |
$32.29
|
139,347
148.56% of 50 DAV
50 DAV is 93,800
|
$32.42
-1.63%
|
9/1/2010
|
$30.79
|
PP = $30.49
|
|
MB = $32.01
|
Most Recent Note - 9/17/2010 1:58:44 PM
Y- Gapped up today and challenged its 52-week high, now trading near its "max buy" level. Due to report earnings news on Thursday, September 23rd. Prior highs in the $30 area define initial support to watch.
>>> The latest Featured Stock Update with an annotated graph appeared on 8/20/2010. Click here.
View all notes |
Alert me of new notes |
CANSLIM.net Company Profile |
SEC |
Zacks Reports |
StockTalk |
News |
Chart |
Request a new note
C
A N
S L
I M
|
NFLX
-
NASDAQ
Netflix Inc
SPECIALTY RETAIL - Music and Video Stores
|
$140.46
|
-0.04
-0.03% |
$142.45
|
3,310,945
69.71% of 50 DAV
50 DAV is 4,749,700
|
$149.95
-6.33%
|
8/10/2010
|
$124.05
|
PP = $124.00
|
|
MB = $130.20
|
Most Recent Note - 9/15/2010 5:08:59 PM
G - Quietly consolidating from its all-time high with volume totals cooling for the past week. No resistance remains to hinder its progress.
>>> The latest Featured Stock Update with an annotated graph appeared on 8/10/2010. Click here.
View all notes |
Alert me of new notes |
CANSLIM.net Company Profile |
SEC |
Zacks Reports |
StockTalk |
News |
Chart |
Request a new note
C
A N
S L
I M
|
NTAP
-
NASDAQ
Netapp Inc
COMPUTER HARDWARE - Data Storage Devices
|
$49.04
|
+0.36
0.74% |
$49.15
|
8,413,184
112.33% of 50 DAV
50 DAV is 7,489,700
|
$49.56
-1.06%
|
9/8/2010
|
$46.98
|
PP = $44.99
|
|
MB = $47.24
|
Most Recent Note - 9/15/2010 1:23:52 PM
G - Hit another new 52-week high today, getting more extended from a sound base. Support to watch is at prior chart highs near its latest pivot point.
>>> The latest Featured Stock Update with an annotated graph appeared on 9/8/2010. Click here.
View all notes |
Alert me of new notes |
CANSLIM.net Company Profile |
SEC |
Zacks Reports |
StockTalk |
News |
Chart |
Request a new note
C
A N
S L
I M
|
Symbol/Exchange
Company Name
Industry Group |
PRICE |
CHANGE
(%Change) |
Day High |
Volume
(% DAV)
(% 50 day avg vol) |
52 Wk Hi
% From Hi |
Featured
Date |
Price
Featured |
Pivot Featured |
|
Max Buy |
PAY
-
NYSE
Verifone Systems Inc
COMPUTER HARDWARE - Transaction Automation Systems
|
$28.50
|
+0.27
0.96% |
$28.73
|
2,522,527
201.16% of 50 DAV
50 DAV is 1,254,000
|
$28.28
0.78%
|
8/25/2010
|
$24.30
|
PP = $23.74
|
|
MB = $24.93
|
Most Recent Note - 9/17/2010 1:27:13 PM
G - Hitting another new 52-week high today, steadily climbing and getting more extended from a sound base.
>>> The latest Featured Stock Update with an annotated graph appeared on 8/30/2010. Click here.
View all notes |
Alert me of new notes |
CANSLIM.net Company Profile |
SEC |
Zacks Reports |
StockTalk |
News |
Chart |
Request a new note
C
A N
S L
I M
|
PRGO
-
NASDAQ
Perrigo Co
DRUGS - Drug Related Products
|
$61.95
|
-1.29
-2.04% |
$64.14
|
1,176,436
111.24% of 50 DAV
50 DAV is 1,057,600
|
$65.38
-5.24%
|
9/15/2010
|
$63.73
|
PP = $64.76
|
|
MB = $68.00
|
Most Recent Note - 9/17/2010 1:53:31 PM
Y - Pulling back further today following a negative reversal on the prior session after reaching a new 52-week high, a sign of distributional pressure. Technically, it did not trigger a proper technical buy signal with its recent action.
>>> The latest Featured Stock Update with an annotated graph appeared on 9/15/2010. Click here.
View all notes |
Alert me of new notes |
CANSLIM.net Company Profile |
SEC |
Zacks Reports |
StockTalk |
News |
Chart |
Request a new note
C
A N
S L
I M
|
ROVI
-
NASDAQ
Rovi Corp
COMPUTER SOFTWARE andamp; SERVICES - Security Software andamp; Services
|
$42.56
|
-0.35
-0.82% |
$43.22
|
1,577,626
132.22% of 50 DAV
50 DAV is 1,193,200
|
$45.80
-7.07%
|
8/31/2010
|
$43.31
|
PP = $45.06
|
|
MB = $47.31
|
Most Recent Note - 9/17/2010 10:16:12 AM
G - Color code is changed to green, while more damaging losses below its prior chart low ($41.00) would raise greater concerns. Violated its 50 DMA line, triggering a technical sell signal. It is up from its intra-day low, and a strong close would be a reassuring sign of prompt support.
>>> The latest Featured Stock Update with an annotated graph appeared on 8/24/2010. Click here.
View all notes |
Alert me of new notes |
CANSLIM.net Company Profile |
SEC |
Zacks Reports |
StockTalk |
News |
Chart |
Request a new note
C
A N
S L
I M
|
SHOO
-
NASDAQ
Steven Madden Limited
CONSUMER NON-DURABLES - Textile - Apparel Footwear
|
$38.84
|
+0.17
0.44% |
$39.20
|
551,096
128.97% of 50 DAV
50 DAV is 427,300
|
$40.98
-5.22%
|
9/15/2010
|
$38.94
|
PP = $40.27
|
|
MB = $42.28
|
Most Recent Note - 9/15/2010 11:42:29 AM
Y - Rallying today within close striking range of its August high and its 52-week high. New pivot point is cited today based on its 7/30/10 high plus ten cents.
>>> The latest Featured Stock Update with an annotated graph appeared on 8/5/2010. Click here.
View all notes |
Alert me of new notes |
CANSLIM.net Company Profile |
SEC |
Zacks Reports |
StockTalk |
News |
Chart |
Request a new note
C
A N
S L
I M
|
SLW
-
NYSE
Silver Wheaton Corp
METALS and; MINING - Silver
|
$25.02
|
-0.36
-1.42% |
$25.56
|
6,569,563
139.41% of 50 DAV
50 DAV is 4,712,500
|
$25.44
-1.65%
|
8/25/2010
|
$21.40
|
PP = $21.99
|
|
MB = $23.09
|
Most Recent Note - 9/16/2010 1:08:58 PM
G - Inching higher today, it has been stubbornly holding its ground after recent gains to new all-time highs. Extended from any sound base, its previous highs in the $21 area define chart support to watch.
>>> The latest Featured Stock Update with an annotated graph appeared on 8/25/2010. Click here.
View all notes |
Alert me of new notes |
CANSLIM.net Company Profile |
SEC |
Zacks Reports |
StockTalk |
News |
Chart |
Request a new note
C
A N
S L
I M
|
Symbol/Exchange
Company Name
Industry Group |
PRICE |
CHANGE
(%Change) |
Day High |
Volume
(% DAV)
(% 50 day avg vol) |
52 Wk Hi
% From Hi |
Featured
Date |
Price
Featured |
Pivot Featured |
|
Max Buy |
UA
-
NYSE
Under Armour Inc Cl A
CONSUMER NON-DURABLES - Textile - Apparel Clothing
|
$44.17
|
+0.10
0.23% |
$44.36
|
1,359,466
188.97% of 50 DAV
50 DAV is 719,400
|
$44.19
-0.05%
|
9/9/2010
|
$39.99
|
PP = $40.10
|
|
MB = $42.11
|
Most Recent Note - 9/16/2010 3:33:26 PM
G - At its 52-week high and on track today for its 12th consecutive gain. Its color code was changed to green after getting extended from its prior chart highs. Its 9/14/10 gain with +242% of its average daily volume clinched a technical buy signal.
>>> The latest Featured Stock Update with an annotated graph appeared on 9/9/2010. Click here.
View all notes |
Alert me of new notes |
CANSLIM.net Company Profile |
SEC |
Zacks Reports |
StockTalk |
News |
Chart |
Request a new note
C
A N
S L
I M
|
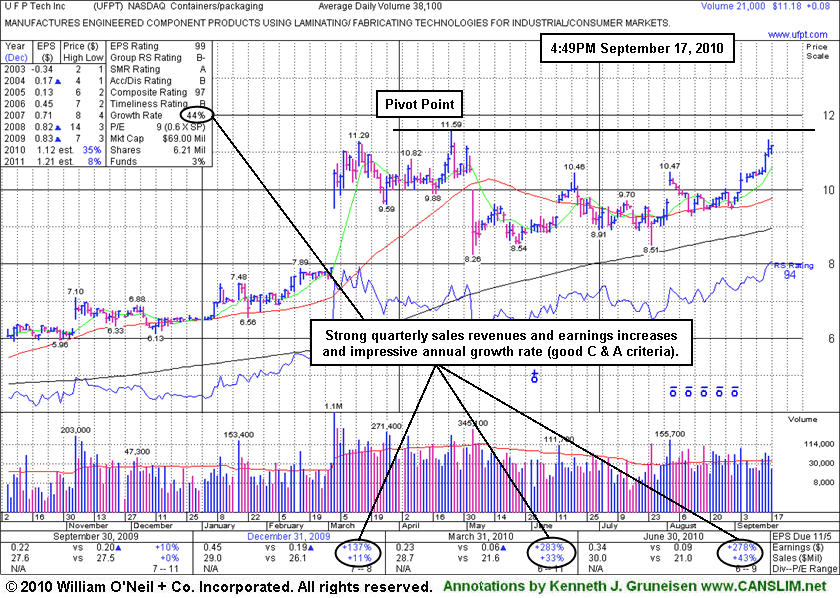
UFPT
-
NASDAQ
U F P Tech Inc
CONSUMER NON-DURABLES - Packaging and Containers
|
$11.23
|
+0.13
1.17% |
$11.23
|
26,606
71.71% of 50 DAV
50 DAV is 37,100
|
$11.59
-3.11%
|
9/16/2010
|
$11.20
|
PP = $11.69
|
|
MB = $12.27
|
Most Recent Note - 9/17/2010 5:01:00 PM
Y - Posted a 5th consecutive gain today and closed 3cents above its 4/26/10 closing price. No resistance remains due to overhead supply. It was featured in yellow in the 9/16/10 mid-day report. Disciplined investors know that a proper technical buy signal requires a breakout on heavy volume. The 3 latest quarterly comparisons showed strong sales revenues and earnings acceleration following a streak of negative or near flat comparisons. It has an impressive annual earnings (A criteria) growth rate. Small supply of only 6.21 million shares (S criteria) outstanding can contribute to great price volatility in the event of institutional buying or selling.
>>> The latest Featured Stock Update with an annotated graph appeared on 9/17/2010. Click here.
View all notes |
Alert me of new notes |
CANSLIM.net Company Profile |
SEC |
Zacks Reports |
StockTalk |
News |
Chart |
Request a new note
C
A N
S L
I M
|
ULTA
-
NASDAQ
Ulta Salon Cosm & Frag
SPECIALTY RETAIL - Specialty Retail, Other
|
$28.15
|
+0.12
0.43% |
$28.44
|
446,230
72.75% of 50 DAV
50 DAV is 613,400
|
$29.25
-3.76%
|
9/3/2010
|
$26.36
|
PP = $25.89
|
|
MB = $27.18
|
Most Recent Note - 9/15/2010 5:10:53 PM
G - Pulled back on lighter volume today after considerable gains for new 52-week highs with above average volume. Its color code was changed to green after getting extended from its latest base.
>>> The latest Featured Stock Update with an annotated graph appeared on 9/3/2010. Click here.
View all notes |
Alert me of new notes |
CANSLIM.net Company Profile |
SEC |
Zacks Reports |
StockTalk |
News |
Chart |
Request a new note
C
A N
S L
I M
|
VIT
-
NYSE
Vanceinfo Tech Inc Ads
COMPUTER SOFTWARE and SERVICES - Business Software and Services
|
$29.42
|
-0.02
-0.07% |
$29.97
|
314,703
57.49% of 50 DAV
50 DAV is 547,400
|
$30.50
-3.54%
|
7/8/2010
|
$25.20
|
PP = $26.58
|
|
MB = $27.91
|
Most Recent Note - 9/16/2010 1:19:39 PM
G - Consolidating in a tight trading range near its all-time high. Its 50 DMA line defines chart support to watch.
>>> The latest Featured Stock Update with an annotated graph appeared on 8/31/2010. Click here.
View all notes |
Alert me of new notes |
CANSLIM.net Company Profile |
SEC |
Zacks Reports |
StockTalk |
News |
Chart |
Request a new note
C
A N
S L
I M
|
WCRX
-
NASDAQ
Warner Chilcott Plc
DRUGS - Drug Manufacturers - Other
|
$22.75
|
+0.58
2.62% |
$22.85
|
3,121,093
133.83% of 50 DAV
50 DAV is 2,332,100
|
$22.34
1.84%
|
8/23/2010
|
$29.54
|
PP = $29.34
|
|
MB = $30.81
|
Most Recent Note - 9/17/2010 4:47:24 PM
G - Gain today with average volume for a new all-time high. Color code is changed to green as it gets extended from its prior base. (Price data will be adjusted downward to account for the recent special $8.50 cash dividend dividend impacting its share price as of 9/09/10 trading, so the "max buy" level $30.81 -$8.50 equals $22.31.
>>> The latest Featured Stock Update with an annotated graph appeared on 8/23/2010. Click here.
View all notes |
Alert me of new notes |
CANSLIM.net Company Profile |
SEC |
Zacks Reports |
StockTalk |
News |
Chart |
Request a new note
C
A N
S L
I M
|
Symbol/Exchange
Company Name
Industry Group |
PRICE |
CHANGE
(%Change) |
Day High |
Volume
(% DAV)
(% 50 day avg vol) |
52 Wk Hi
% From Hi |
Featured
Date |
Price
Featured |
Pivot Featured |
|
Max Buy |