You are not logged in.
This means you
CAN ONLY VIEW reports that were published prior to Monday, April 14, 2025.
You
MUST UPGRADE YOUR MEMBERSHIP if you want to see any current reports.
AFTER MARKET UPDATE - TUESDAY, SEPTEMBER 16TH, 2014
Previous After Market Report Next After Market Report >>>
|
|
|
|
DOW |
+100.83 |
17,131.97 |
+0.59% |
|
Volume |
632,356,000 |
+10% |
|
Volume |
1,737,275,680 |
-4% |
|
NASDAQ |
+33.86 |
4,552.76 |
+0.75% |
|
Advancers |
1,960 |
62% |
|
Advancers |
1,520 |
52% |
|
S&P 500 |
+14.85 |
1,998.98 |
+0.75% |
|
Decliners |
1,100 |
35% |
|
Decliners |
1,292 |
44% |
|
Russell 2000 |
+4.45 |
1,150.97 |
+0.39% |
|
52 Wk Highs |
48 |
|
|
52 Wk Highs |
34 |
|
|
S&P 600 |
+2.57 |
660.52 |
+0.39% |
|
52 Wk Lows |
75 |
|
|
52 Wk Lows |
98 |
|
|
 |
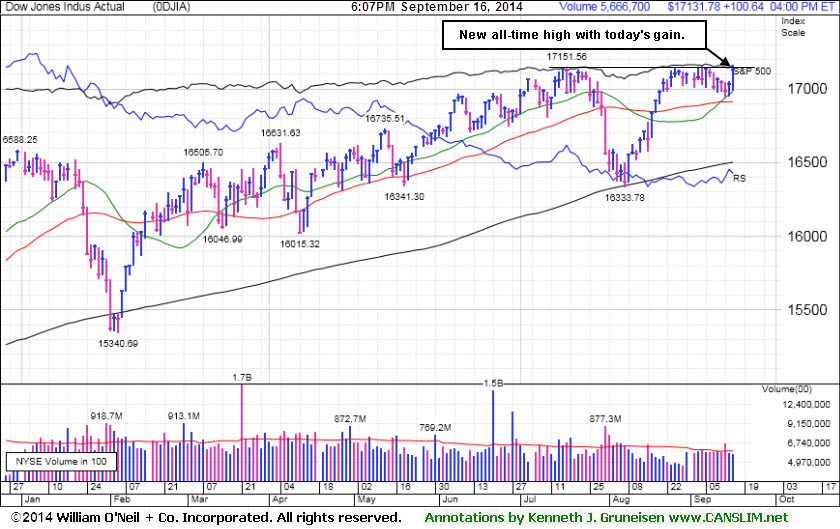
Dow Hit New High as Major Averages Rallied
Kenneth J. Gruneisen - Passed the CAN SLIM® Master's Exam
Stocks staged a rally on Tuesday. The S&P 500 added 14 points to 1,998. The NASDAQ gained 33 points to 4,552. Volume totals were reported mixed, higher than the prior session total on the NYSE and lighter on the Nasdaq exchange. Breadth was positive as advancers led decliners by nearly a 2-1 margin on the NYSE and 5-4 on the NASDAQ exchange. Leadership improved a bit as there were 17 high-ranked companies from the CANSLIM.net Leaders List that made new 52-week highs and appeared on the CANSLIM.net BreakOuts Page, up from the prior session total of 6 stocks. However, new 52-week lows again outnumbered new 52-week highs on the Nasdaq exchange and on the NYSE. There were gains for all 13 high-ranked companies currently included on the Featured Stocks Page. The broader market (M criteria) recently encountered distributional pressure while leadership (stocks hitting new 52-week highs) waned. Remember that disciplined investors buy stocks with superior fundamentals only after they have triggered a proper technical buy signal.
PICTURED: The Dow Jones Industrial Average rose to a fresh all-time high as it increased 100 points to 17,131.
Energy stocks paced the advance as WTI crude jumped to a two-week high. Schlumberger (SLB +1.9%) and ConocoPhillips (COP +1.7%) rose. Healthcare and utilities also helped lift the market. Humana (HUM +3.7%) rallied after announcing a new $2 billion buyback program. PPL Corp (PPL +2.6%) rose. M&A activity also garnered attention. Glimcher Realty Trust (GRT +29.8%) rallied following news that Washington Prime Group (WPG -6.61%) agreed to buy the company for about $2 billion.
Overseas stimulus measures added to the upside as China's central bank reportedly started providing about $81 billion in loans to its five biggest banks. The Fed was also on investors' minds as the two-day FOMC meeting kicked off. The central bank will issue a statement Wednesday afternoon which may reveal indications as to when policy makers may begin raising interest rates.
Treasuries were little changed. The 10-year note was flat to yield 2.59%. The 30-year bond declined 7/32 to yield 3.36%.
The CANSLIM.net Featured Stocks Page shows the most action-worthy candidates and their latest notes and a Headline Link directs members to the latest detailed analysis with data-packed graphs annotated by a Certified expert along with links to additional resources. The Premium Member Homepage includes "dynamic archives" to all prior pay reports published.
|
 Kenneth J. Gruneisen started out as a licensed stockbroker in August 1987, a couple of months prior to the historic stock market crash that took the Dow Jones Industrial Average down -22.6% in a single day. He has published daily fact-based fundamental and technical analysis on high-ranked stocks online for two decades. Through FACTBASEDINVESTING.COM, Kenneth provides educational articles, news, market commentary, and other information regarding proven investment systems that work in good times and bad.
Comments contained in the body of this report are technical opinions only and are not necessarily those of Gruneisen Growth Corp. The material herein has been obtained from sources believed to be reliable and accurate, however, its accuracy and completeness cannot be guaranteed. Our firm, employees, and customers may effect transactions, including transactions contrary to any recommendation herein, or have positions in the securities mentioned herein or options with respect thereto. Any recommendation contained in this report may not be suitable for all investors and it is not to be deemed an offer or solicitation on our part with respect to the purchase or sale of any securities. |
|
 |
Retail, Tech, and Commodity-Linked Groups Gained
Kenneth J. Gruneisen - Passed the CAN SLIM® Master's Exam
Financial shares did not participate in the rally as the Broker/Dealer Index ($XBD -0.04%) and Bank Index ($BKX -0.01%) finished flat on Tuesday. The Retail Index ($RLX +1.01%) was a positive influence on the major averages while the tech sector saw unanimous gains as the Biotechnology Index ($BTK +1.61%) and the Semiconductor Index ($SOX +1.72%) outpaced the Networking Index ($NWX +0.68%). Commodity-linked shares had a positive bias as the Gold & Silver Index ($XAU +0.77%), Oil Services Index ($OSX +0.83%), and the Integrated Oil Index ($XOI +1.07%) ratcheted higher.
Charts courtesy www.stockcharts.com
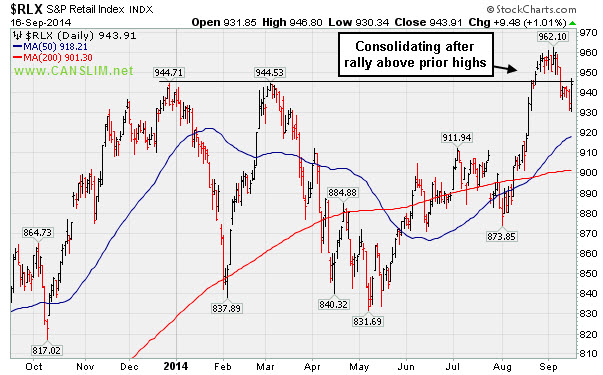
PICTURED: The Retail Index ($RLX +1.01%) is consolidating after recently rallying above prior highs.
| Oil Services |
$OSX |
283.00 |
+2.32 |
+0.83% |
+0.70% |
| Integrated Oil |
$XOI |
1,631.89 |
+17.29 |
+1.07% |
+8.57% |
| Semiconductor |
$SOX |
643.12 |
+10.88 |
+1.72% |
+20.20% |
| Networking |
$NWX |
336.82 |
+2.28 |
+0.68% |
+3.98% |
| Broker/Dealer |
$XBD |
172.70 |
-0.07 |
-0.04% |
+7.56% |
| Retail |
$RLX |
943.91 |
+9.48 |
+1.01% |
+0.44% |
| Gold & Silver |
$XAU |
92.40 |
+0.71 |
+0.77% |
+9.80% |
| Bank |
$BKX |
72.58 |
-0.01 |
-0.01% |
+4.79% |
| Biotech |
$BTK |
3,082.22 |
+48.86 |
+1.61% |
+32.26% |
|
|
|
 |
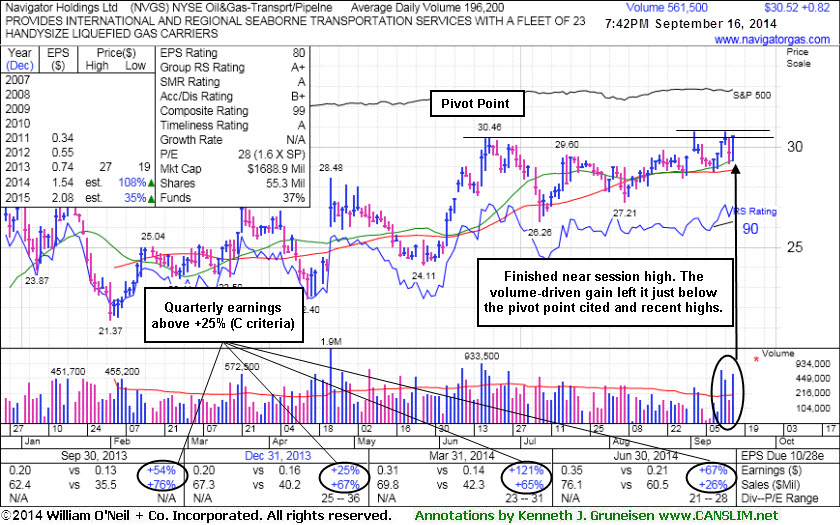
Finished Strong While Challenging Pivot Point and Recent Highs
Kenneth J. Gruneisen - Passed the CAN SLIM® Master's Exam
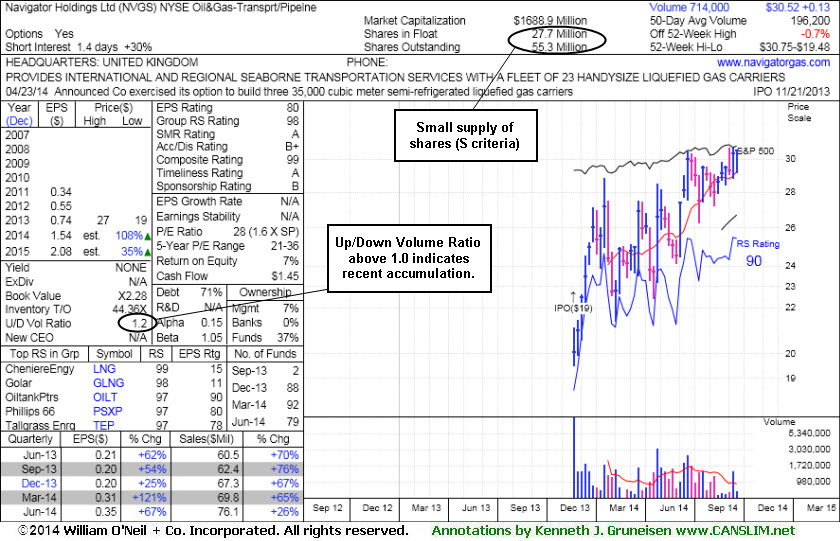
Navigator Holdings Ltd (NVGS +$0.82 or to $30.52) finished near the session high with a volume-driven gain after highlighted in yellow in the earlier mid-day report (read here). It formed an orderly base and found support when consolidating near its 50-day moving average (DMA) line. While it has recently been stalling, subsequent volume-driven gains above the cited pivot point based on its 6/19/14 high plus 10 cents could trigger a convincing technical buy signal. It came very close to that threshold with today's gain, and it is perched near its 52-week high with very little resistance remaining due to overhead supply. A powerful rally into new (N criteria) all-time high territory could help to confirm that meaningful buying demand is lurking from the institutional crowd which could lead to a sustained price advance.
The Oil & Gas - Transport/Pipeline industry group has an A+ Group Relative Strength rating, a reassuring sign concerning the L criteria. Its earnings history has been strong through the Jun '14 quarter with increases above the +25% minimum guideline (C criteria). Its limited annual earnings (A criteria) history is a concern, meanwhile a good number of top-rated funds (I criteria) have chosen to buy shares while it has rallied from its IPO at $19 on 11/21/13.
It has a small supply of only 27.7 million shares (S criteria) in the public float which can contribute to greater price volatility in the event of institutional buying or selling. Its current up/Down Volume ratio of 1.2 is an unbiased indication its shares have been under accumulation over the past 50 days.
|
|
|
Color Codes Explained :
Y - Better candidates highlighted by our
staff of experts.
G - Previously featured
in past reports as yellow but may no longer be buyable under the
guidelines.
***Last / Change / Volume data in this table is the closing quote data***
Symbol/Exchange
Company Name
Industry Group |
PRICE |
CHANGE
(%Change) |
Day High |
Volume
(% DAV)
(% 50 day avg vol) |
52 Wk Hi
% From Hi |
Featured
Date |
Price
Featured |
Pivot Featured |
|
Max Buy |
ACT
-
NYSE
Actavis plc
Medical-Generic Drugs
|
$238.76
|
+3.92
1.67% |
$239.58
|
1,934,329
91.59% of 50 DAV
50 DAV is 2,112,000
|
$239.15
-0.16%
|
6/20/2014
|
$216.53
|
PP = $230.87
|
|
MB = $242.41
|
Most Recent Note - 9/12/2014 11:57:54 AM
Y - Hitting a new 52-week high today with volume running at an above average pace. Gains above a stock's pivot point must be backed by a minimum of +40% above average volume to trigger a technical buy signal.
>>> FEATURED STOCK ARTICLE : Quietly Perched Within Striking Distance of 52-Week High - 8/28/2014
View all notes |
Set NEW NOTE alert |
CANSLIM.net Company Profile |
SEC
News |
Chart |
Request a new note
C
A N
S L
I M


|
BITA
-
NYSE
Bitauto Hldgs Ltd Ads
Internet-Content
|
$81.95
|
+0.35
0.43% |
$82.41
|
2,052,700
121.17% of 50 DAV
50 DAV is 1,694,000
|
$98.28
-16.62%
|
6/26/2014
|
$46.20
|
PP = $47.03
|
|
MB = $49.38
|
Most Recent Note - 9/15/2014 7:37:12 PM
G - Erased early gains and suffered another loss with above average volume. Recently enduring distributional pressure while fundamentals remain strong. Noted repeatedly with caution - "Has the look of a 'climax run' with volume-driven gains getting very extended from its prior base."
>>> FEATURED STOCK ARTICLE : Finished Near Session Low - Noted With Look of "Climax Run" - 8/27/2014
View all notes |
Set NEW NOTE alert |
CANSLIM.net Company Profile |
SEC
News |
Chart |
Request a new note
C
A N
S L
I M
|
EQM
-
NYSE
E Q T Midstream Partners
ENERGY - Oil and Gas Pipelines
|
$89.57
|
+0.94
1.06% |
$89.90
|
347,012
200.58% of 50 DAV
50 DAV is 173,000
|
$102.51
-12.62%
|
12/12/2013
|
$53.17
|
PP = $56.51
|
|
MB = $59.34
|
Most Recent Note - 9/12/2014 6:05:53 PM
G - Violated its 50 DMA line raising concerns with a loss today on higher volume indicative of distributional pressure. Reported earnings +37% on +21% sales revenues for the Jun '14 quarter, an improvement after 2 sub par quarterly earnings comparisons.
>>> FEATURED STOCK ARTICLE : Forming New Base But Fundamental Flaws Remain a Concern - 9/3/2014
View all notes |
Set NEW NOTE alert |
CANSLIM.net Company Profile |
SEC
News |
Chart |
Request a new note
C
A N
S L
I M
|
FB
-
NASDAQ
Facebook Inc Cl A
INTERNET
|
$76.08
|
+1.50
2.01% |
$76.23
|
37,671,795
102.47% of 50 DAV
50 DAV is 36,762,000
|
$78.36
-2.91%
|
9/9/2014
|
$76.67
|
PP = $76.84
|
|
MB = $80.68
|
Most Recent Note - 9/15/2014 3:31:32 PM
Y - Down considerably with heavy volume behind today's loss, action indicative of distributional pressure. Prior notes cautioned members "Recent gains lacked great volume conviction while gains above a stock's pivot point must have at least +40% above averages volume to trigger a proper new (or add-on) technical buy signal. See the latest FSU analysis for more details and annotated graphs. Prior highs in the $72 area define initial support along with its 50 DMA line."
>>> FEATURED STOCK ARTICLE : Wedging Gains Not Indicative of Institutional Conviction - 9/9/2014
View all notes |
Set NEW NOTE alert |
CANSLIM.net Company Profile |
SEC
News |
Chart |
Request a new note
C
A N
S L
I M
|
NVGS
-
NYSE
Navigator Holdings Ltd
Transportation-Ship
|
$30.52
|
+0.82
2.76% |
$30.57
|
561,543
286.50% of 50 DAV
50 DAV is 196,000
|
$30.75
-0.75%
|
9/16/2014
|
$30.33
|
PP = $30.56
|
|
MB = $32.09
|
 Most Recent Note - 9/16/2014 8:16:18 PM
Y - Finished strong after highlighted in yellow in the earlier mid-day report (read here) while perched near its 52-week high with little resistance remaining due to overhead supply. Subsequent volume-driven gains above the cited pivot point and into new high territory could trigger a convincing technical buy signal. See the latest FSU analysis for more details and new annotated graphs.
>>> FEATURED STOCK ARTICLE : Finished Strong While Challenging Pivot Point and Recent Highs - 9/16/2014
View all notes |
Set NEW NOTE alert |
CANSLIM.net Company Profile |
SEC
News |
Chart |
Request a new note
C
A N
S L
I M
|
Symbol/Exchange
Company Name
Industry Group |
PRICE |
CHANGE
(%Change) |
Day High |
Volume
(% DAV)
(% 50 day avg vol) |
52 Wk Hi
% From Hi |
Featured
Date |
Price
Featured |
Pivot Featured |
|
Max Buy |
NXPI
-
NASDAQ
Nxp Semiconductors N V
ELECTRONICS - Semiconductor - Broad Line
|
$70.26
|
+1.70
2.48% |
$70.49
|
2,222,490
68.07% of 50 DAV
50 DAV is 3,265,000
|
$73.09
-3.87%
|
8/29/2014
|
$68.50
|
PP = $67.89
|
|
MB = $71.28
|
Most Recent Note - 9/15/2014 7:32:57 PM
Y - Ended near the session low with today's 2nd consecutive loss on below average volume. Perched -6.2% off its 52-week high. It remains above its pivot point and below its "max buy" level. No overhead supply remains to act as resistance. Prior highs in the $67 area define initial support to watch on pullbacks.
>>> FEATURED STOCK ARTICLE : Gap Up For New High With Volume Triggered Technical Buy Signal - 8/29/2014
View all notes |
Set NEW NOTE alert |
CANSLIM.net Company Profile |
SEC
News |
Chart |
Request a new note
C
A N
S L
I M
|
PANW
-
NYSE
Palo Alto Networks
Computer Sftwr-Security
|
$98.33
|
+0.86
0.88% |
$98.79
|
2,579,518
156.71% of 50 DAV
50 DAV is 1,646,000
|
$102.45
-4.02%
|
7/30/2014
|
$84.21
|
PP = $85.88
|
|
MB = $90.17
|
Most Recent Note - 9/15/2014 12:47:25 PM
G - Perched near its 52-week high following considerable volume-driven gains last week while getting extended from any sound base. No resistance remains due to overhead supply. Prior highs in the $87 area define initial support to watch above its 50 DMA line. Reported earnings +57% on +59% sales revenues for the Jul '14 quarter, continuing its strong earnings history satisfying the C criteria. Its Earnings Per Share (EPS) Rating is right at the 80+ minimum guideline for buy candidates.
>>> FEATURED STOCK ARTICLE : Pulling Back Following New Technical Breakout - 9/4/2014
View all notes |
Set NEW NOTE alert |
CANSLIM.net Company Profile |
SEC
News |
Chart |
Request a new note
C
A N
S L
I M
|
STRT
-
NASDAQ
Strattec Security Corp
AUTOMOTIVE - Auto Parts
|
$84.39
|
+0.44
0.52% |
$84.44
|
9,265
44.12% of 50 DAV
50 DAV is 21,000
|
$89.87
-6.10%
|
8/22/2014
|
$71.47
|
PP = $73.97
|
|
MB = $77.67
|
Most Recent Note - 9/15/2014 7:34:25 PM
G - Perched -6.6% off its 52-week high, consolidating after getting extended from its prior base. Prior highs in the $74-77 area define initial support to watch on pullbacks.
>>> FEATURED STOCK ARTICLE : Extended From Prior Highs and Previously Noted Base - 9/10/2014
View all notes |
Set NEW NOTE alert |
CANSLIM.net Company Profile |
SEC
News |
Chart |
Request a new note
C
A N
S L
I M
|
TARO
-
NYSE
Taro Pharmaceutical Inds
DRUGS - Drug Manufacturers - Other
|
$156.47
|
+5.13
3.39% |
$156.77
|
28,742
33.42% of 50 DAV
50 DAV is 86,000
|
$165.30
-5.34%
|
7/30/2014
|
$144.24
|
PP = $149.99
|
|
MB = $157.49
|
Most Recent Note - 9/15/2014 7:35:16 PM
G - Consolidating near its 50 DMA line and -8.4% off its 52-week high. Recently enduring distributional pressure and noted with caution - "Extended from any sound base. Recently reported earnings for the Jun '14 quarter below the +25% minimum earnings guideline (C criteria) raising fundamental concerns."
>>> FEATURED STOCK ARTICLE : Churning Action Indicative of Distributional Pressure - 9/2/2014
View all notes |
Set NEW NOTE alert |
CANSLIM.net Company Profile |
SEC
News |
Chart |
Request a new note
C
A N
S L
I M
|
TRN
-
NYSE
Trinity Industries Inc
TRANSPORTATION - Railroads
|
$48.12
|
+1.40
3.00% |
$48.24
|
3,070,682
126.99% of 50 DAV
50 DAV is 2,418,000
|
$50.43
-4.58%
|
4/30/2014
|
$37.79
|
PP = $38.03
|
|
MB = $39.93
|
Most Recent Note - 9/12/2014 6:07:07 PM
G - Pulling back since a "negative reversal" at its 52-week high on 9/03/14. It has not formed a sound base. Prior highs near $46-47 define near-term support above its 50 DMA line. See the latest FSU analysis for more details and new annotated graphs.
>>> FEATURED STOCK ARTICLE : Consolidating Above 50-Day Moving Average Line - 9/12/2014
View all notes |
Set NEW NOTE alert |
CANSLIM.net Company Profile |
SEC
News |
Chart |
Request a new note
C
A N
S L
I M
|
Symbol/Exchange
Company Name
Industry Group |
PRICE |
CHANGE
(%Change) |
Day High |
Volume
(% DAV)
(% 50 day avg vol) |
52 Wk Hi
% From Hi |
Featured
Date |
Price
Featured |
Pivot Featured |
|
Max Buy |
UA
-
NYSE
Under Armour Inc Cl A
CONSUMER NON-DURABLES - Textile - Apparel Clothing
|
$67.75
|
+0.56
0.83% |
$68.03
|
2,723,899
114.59% of 50 DAV
50 DAV is 2,377,000
|
$73.42
-7.72%
|
7/10/2014
|
$58.50
|
PP = $60.79
|
|
MB = $63.83
|
Most Recent Note - 9/15/2014 7:25:46 PM
G - Testing support at its 50 DMA line ($66.73) with higher volume behind today's 5th consecutive loss while retreating from its 52-week high. Fundamental concerns were raised by earnings reported +0% on +34% sales revenues for the Jun '14 quarter, below the +25% minimum earnings guideline (C criteria). See the latest FSU analysis for more details and new annotated graphs.
>>> FEATURED STOCK ARTICLE : Higher Volume Behind Loss Testing 50-Day Moving Average - 9/15/2014
View all notes |
Set NEW NOTE alert |
CANSLIM.net Company Profile |
SEC
News |
Chart |
Request a new note
C
A N
S L
I M
|
WLK
-
NYSE
Westlake Chemical Corp
CHEMICALS - Specialty Chemicals
|
$93.73
|
+0.37
0.40% |
$94.29
|
464,218
91.20% of 50 DAV
50 DAV is 509,000
|
$98.44
-4.78%
|
4/29/2014
|
$72.79
|
PP = $69.31
|
|
MB = $72.78
|
Most Recent Note - 9/16/2014 8:17:56 PM
G - Churned higher volume today while consolidating above prior highs in the $92 area defining support above its 50 DMA line. Subsequent violations would raise greater concerns and trigger technical sell signals. Technical strength has continued despite recent fundamental concerns.
>>> FEATURED STOCK ARTICLE : Consolidating Above Near-Term Support Levels - 9/11/2014
View all notes |
Set NEW NOTE alert |
CANSLIM.net Company Profile |
SEC
News |
Chart |
Request a new note
C
A N
S L
I M
|
YY
-
NASDAQ
YY Inc Ads
INTERNET - Internet Service Providers
|
$83.19
|
+2.45
3.03% |
$84.91
|
3,369,546
223.59% of 50 DAV
50 DAV is 1,507,000
|
$96.39
-13.69%
|
8/19/2014
|
$85.81
|
PP = $91.03
|
|
MB = $95.58
|
Most Recent Note - 9/15/2014 3:29:31 PM
G - Slumping below its 50 DMA line and raising concerns with above average volume behind today's 5th consecutive loss. Disciplined investors always limit losses by selling any stock that falls more than -7% from their purchase price.
>>> FEATURED STOCK ARTICLE : Perched at High After Triggering Technical Buy Signal - 9/5/2014
View all notes |
Set NEW NOTE alert |
CANSLIM.net Company Profile |
SEC
News |
Chart |
Request a new note
C
A N
S L
I M
|
|
|
|
THESE ARE NOT BUY RECOMMENDATIONS!
Comments contained in the body of this report are technical
opinions only. The material herein has been obtained
from sources believed to be reliable and accurate, however,
its accuracy and completeness cannot be guaranteed.
This site is not an investment advisor, hence it does
not endorse or recommend any securities or other investments.
Any recommendation contained in this report may not
be suitable for all investors and it is not to be deemed
an offer or solicitation on our part with respect to
the purchase or sale of any securities. All trademarks,
service marks and trade names appearing in this report
are the property of their respective owners, and are
likewise used for identification purposes only.
This report is a service available
only to active Paid Premium Members.
You may opt-out of receiving report notifications
at any time. Questions or comments may be submitted
by writing to Premium Membership Services 665 S.E. 10 Street, Suite 201 Deerfield Beach, FL 33441-5634 or by calling 1-800-965-8307
or 954-785-1121.
|
|
|