***Last / Change / Volume data in this table is the closing quote data***
Symbol/Exchange
Company Name
Industry Group |
PRICE |
CHANGE
(%Change) |
Day High |
Volume
(% DAV)
(% 50 day avg vol) |
52 Wk Hi
% From Hi |
Featured
Date |
Price
Featured |
Pivot Featured |
|
Max Buy |
ABV
-
NYSE
Comp De Bebidas Adr
FOOD and BEVERAGE - Beverages - Brewers
|
$120.91
|
+0.76
0.63% |
$121.07
|
427,922
69.29% of 50 DAV
50 DAV is 617,600
|
$120.31
0.50%
|
6/29/2010
|
$104.74
|
PP = $109.33
|
|
MB = $114.80
|
Most Recent Note - 9/14/2010 2:29:44 PM
G - This Brazil-based beverage firm has rallied to another new all-time high today with its 6th consecutive gain on near average or light volume. Prior highs in the $111-112 area define support above its 50 DMA line.
>>> The latest Featured Stock Update with an annotated graph appeared on 8/18/2010. Click here.
View all notes |
Alert me of new notes |
CANSLIM.net Company Profile |
SEC |
Zacks Reports |
StockTalk |
News |
Chart |
Request a new note
C
A N
S L
I M


|
ARUN
-
NASDAQ
Aruba Networks Inc
COMPUTER HARDWARE - Networking andamp; Communication Dev
|
$20.92
|
+0.45
2.20% |
$20.93
|
2,166,780
115.46% of 50 DAV
50 DAV is 1,876,700
|
$20.69
1.11%
|
8/30/2010
|
$18.12
|
PP = $18.51
|
|
MB = $19.44
|
 Most Recent Note - 9/16/2010 4:55:10 PM
G - Hit yet another new 52-week high today with average volume behind its gain, and it closed near the session high. Extended from its latest base, its prior highs near $18 define a chart support level to watch.
>>> The latest Featured Stock Update with an annotated graph appeared on 9/2/2010. Click here.
View all notes |
Alert me of new notes |
CANSLIM.net Company Profile |
SEC |
Zacks Reports |
StockTalk |
News |
Chart |
Request a new note
C
A N
S L
I M
|
BIDU
-
NASDAQ
Baidu Inc Ads
INTERNET - Internet Information Providers
|
$86.09
|
-0.21
-0.24% |
$86.30
|
4,614,085
47.48% of 50 DAV
50 DAV is 9,717,800
|
$88.32
-2.52%
|
7/14/2010
|
$75.03
|
PP = $78.59
|
|
MB = $82.52
|
Most Recent Note - 9/13/2010 5:20:05 PM
Y - Gapped up today for a gain with near average volume. Its recent rally from its 10-week average may be considered a secondary buy point. However, it may be considered "late-stage" and riskier than fresh technical breakouts.
>>> The latest Featured Stock Update with an annotated graph appeared on 8/13/2010. Click here.
View all notes |
Alert me of new notes |
CANSLIM.net Company Profile |
SEC |
Zacks Reports |
StockTalk |
News |
Chart |
Request a new note
C
A N
S L
I M
|
CACC
-
NASDAQ
Credit Acceptance Corp
FINANCIAL SERVICES - Credit Services
|
$61.14
|
-2.25
-3.55% |
$63.32
|
50,769
104.89% of 50 DAV
50 DAV is 48,400
|
$63.45
-3.64%
|
7/29/2010
|
$52.04
|
PP = $54.07
|
|
MB = $56.77
|
Most Recent Note - 9/16/2010 3:29:05 PM
G - Pulling back toward prior highs after a rally from a short (4-week) flat base. The minimum length for a valid flat base is 5 weeks, so its $61.41 high of 8/18/10 was not cited as the basis for a new pivot point.
>>> The latest Featured Stock Update with an annotated graph appeared on 8/2/2010. Click here.
View all notes |
Alert me of new notes |
CANSLIM.net Company Profile |
SEC |
Zacks Reports |
StockTalk |
News |
Chart |
Request a new note
C
A N
S L
I M
|
CMG
-
NYSE
Chipotle Mexican Grill
LEISURE - Restaurants
|
$167.03
|
-2.63
-1.55% |
$169.61
|
828,232
116.10% of 50 DAV
50 DAV is 713,400
|
$170.00
-1.75%
|
9/1/2010
|
$158.31
|
PP = $155.52
|
|
MB = $163.30
|
Most Recent Note - 9/16/2010 12:29:05 PM
G - Pulling back today after 4 consecutive gains with below average volume. Extended from prior highs in the $155 area that define chart support.
>>> The latest Featured Stock Update with an annotated graph appeared on 9/1/2010. Click here.
View all notes |
Alert me of new notes |
CANSLIM.net Company Profile |
SEC |
Zacks Reports |
StockTalk |
News |
Chart |
Request a new note
C
A N
S L
I M
|
Symbol/Exchange
Company Name
Industry Group |
PRICE |
CHANGE
(%Change) |
Day High |
Volume
(% DAV)
(% 50 day avg vol) |
52 Wk Hi
% From Hi |
Featured
Date |
Price
Featured |
Pivot Featured |
|
Max Buy |
CRM
-
NYSE
Salesforce.Com Inc
INTERNET - Internet Software and Services
|
$116.92
|
+0.11
0.09% |
$117.70
|
2,050,984
78.94% of 50 DAV
50 DAV is 2,598,000
|
$122.00
-4.16%
|
6/2/2010
|
$88.44
|
PP = $89.60
|
|
MB = $94.08
|
Most Recent Note - 9/15/2010 5:36:39 PM
G - Hovering near its all-time high, extended from a sound base, not currently buyable under the investment system guidelines.
>>> The latest Featured Stock Update with an annotated graph appeared on 8/16/2010. Click here.
View all notes |
Alert me of new notes |
CANSLIM.net Company Profile |
SEC |
Zacks Reports |
StockTalk |
News |
Chart |
Request a new note
C
A N
S L
I M
|
EGO
-
NYSE
Eldorado Gold Corp
METALS and MINING - Gold
|
$19.87
|
+0.03
0.15% |
$20.09
|
5,096,327
126.11% of 50 DAV
50 DAV is 4,041,100
|
$20.23
-1.78%
|
8/19/2010
|
$18.25
|
PP = $19.17
|
|
MB = $20.13
|
Most Recent Note - 9/16/2010 12:31:52 PM
Y - Hovering near its 52-week high, just below its "max buy" level. Prior highs in the $18-19 area define the initial chart support level to watch above its 50 DMA line.
>>> The latest Featured Stock Update with an annotated graph appeared on 8/19/2010. Click here.
View all notes |
Alert me of new notes |
CANSLIM.net Company Profile |
SEC |
Zacks Reports |
StockTalk |
News |
Chart |
Request a new note
C
A N
S L
I M
|
FFIV
-
NASDAQ
F 5 Networks Inc
INTERNET - Internet Software and Services
|
$100.52
|
+1.38
1.39% |
$100.92
|
1,453,549
86.48% of 50 DAV
50 DAV is 1,680,800
|
$100.17
0.35%
|
6/16/2010
|
$74.50
|
PP = $74.10
|
|
MB = $77.81
|
Most Recent Note - 9/16/2010 4:50:51 PM
G - Gain today with below average volume for another new all-time high. Upward trendline connecting July-August lows defines an initial chart support level well above its 50 DMA line.
>>> The latest Featured Stock Update with an annotated graph appeared on 9/13/2010. Click here.
View all notes |
Alert me of new notes |
CANSLIM.net Company Profile |
SEC |
Zacks Reports |
StockTalk |
News |
Chart |
Request a new note
C
A N
S L
I M
|
FOSL
-
NASDAQ
Fossil Inc
CONSUMER DURABLES - Recreational Goods, Other
|
$51.88
|
+0.05
0.10% |
$52.07
|
509,916
67.93% of 50 DAV
50 DAV is 750,700
|
$51.99
-0.21%
|
8/10/2010
|
$45.54
|
PP = $42.69
|
|
MB = $44.82
|
Most Recent Note - 9/14/2010 3:57:02 PM
G - Gain today with average volume for another new all-time high. Extended from any sound base after a recent streak of gains, its prior high in the $46 area defines support to watch.
>>> The latest Featured Stock Update with an annotated graph appeared on 8/11/2010. Click here.
View all notes |
Alert me of new notes |
CANSLIM.net Company Profile |
SEC |
Zacks Reports |
StockTalk |
News |
Chart |
Request a new note
C
A N
S L
I M
|
GMCR
-
NASDAQ
Green Mtn Coffee Roastrs
FOOD and BEVERAGE - Processed and Packaged Goods
|
$35.69
|
+0.12
0.34% |
$35.89
|
1,741,423
73.25% of 50 DAV
50 DAV is 2,377,500
|
$35.94
-0.70%
|
8/17/2010
|
$33.62
|
PP = $33.30
|
|
MB = $34.97
|
Most Recent Note - 9/15/2010 11:35:59 AM
G - At its 52-week high after brief trading under its "max buy" level on the prior session and earlier today. Prior highs in the $33 area define support to watch.
>>> The latest Featured Stock Update with an annotated graph appeared on 8/17/2010. Click here.
View all notes |
Alert me of new notes |
CANSLIM.net Company Profile |
SEC |
Zacks Reports |
StockTalk |
News |
Chart |
Request a new note
C
A N
S L
I M
|
Symbol/Exchange
Company Name
Industry Group |
PRICE |
CHANGE
(%Change) |
Day High |
Volume
(% DAV)
(% 50 day avg vol) |
52 Wk Hi
% From Hi |
Featured
Date |
Price
Featured |
Pivot Featured |
|
Max Buy |
HS
-
NYSE
Healthspring Inc
HEALTH SERVICES - Health Care Plans
|
$22.64
|
-0.16
-0.70% |
$22.83
|
462,341
73.21% of 50 DAV
50 DAV is 631,500
|
$23.47
-3.54%
|
8/27/2010
|
$19.91
|
PP = $19.75
|
|
MB = $20.74
|
Most Recent Note - 9/14/2010 5:22:22 PM
G - Holding its ground near its 52-week high and all-time high. Extended from its prior base, support to watch now is prior chart highs in the $19-20 area.
>>> The latest Featured Stock Update with an annotated graph appeared on 8/27/2010. Click here.
View all notes |
Alert me of new notes |
CANSLIM.net Company Profile |
SEC |
Zacks Reports |
StockTalk |
News |
Chart |
Request a new note
C
A N
S L
I M
|
IGTE
-
NASDAQ
Igate Corp
COMPUTER SOFTWARE and SERVICES - Information Technology Service
|
$17.38
|
-0.77
-4.24% |
$18.15
|
431,982
110.12% of 50 DAV
50 DAV is 392,300
|
$18.80
-7.55%
|
9/8/2010
|
$17.29
|
PP = $18.26
|
|
MB = $19.17
|
Most Recent Note - 9/16/2010 3:26:31 PM
Y - Today's 3rd consecutive loss has it slumping under its old chart high, raising concerns. Technically, its gain above its pivot point and strong close on 9/13/10 with +90% above average volume triggered a buy signal.
>>> The latest Featured Stock Update with an annotated graph appeared on 9/10/2010. Click here.
View all notes |
Alert me of new notes |
CANSLIM.net Company Profile |
SEC |
Zacks Reports |
StockTalk |
News |
Chart |
Request a new note
C
A N
S L
I M
|
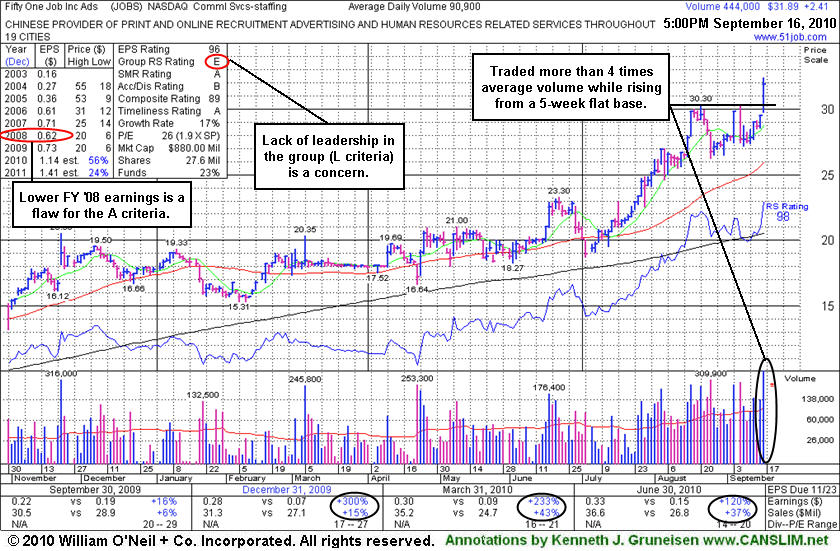
JOBS
-
NASDAQ
Fifty One Job Inc Ads
DIVERSIFIED SERVICES - Staffing and; Outsourcing Service
|
$31.89
|
+2.41
8.18% |
$32.38
|
444,601
498.99% of 50 DAV
50 DAV is 89,100
|
$30.30
5.25%
|
9/16/2010
|
$31.59
|
PP = $30.40
|
|
MB = $31.92
|
Most Recent Note - 9/16/2010 12:52:38 PM
Y - Considerable gain today has it rising from a short flat base to a new 52-week high and it traded within a penny of its 2006 high. Color code is changed to yellow. A strong close today could confirm a new technical buy signal, however it may be considered a riskier "late-stage" breakout after having impressively rallied from March '09 lows near $6.00. Noted in the recent mid-day reports - "This Chinese Commercial Services -Staffing firm's 3 latest quarterly comparisons showed good sales growth and earnings improvement better than the +25% guideline, but its annual earnings history (A criteria) has been below guidelines of the fact-based investment system."
>>> The latest Featured Stock Update with an annotated graph appeared on 9/16/2010. Click here.
View all notes |
Alert me of new notes |
CANSLIM.net Company Profile |
SEC |
Zacks Reports |
StockTalk |
News |
Chart |
Request a new note
C
A N
S L
I M
|
MELI
-
NASDAQ
Mercadolibre Inc
INTERNET - Internet Software and; Services
|
$73.74
|
-0.61
-0.82% |
$74.62
|
388,233
45.26% of 50 DAV
50 DAV is 857,700
|
$74.78
-1.39%
|
5/13/2010
|
$54.21
|
PP = $55.85
|
|
MB = $58.64
|
Most Recent Note - 9/13/2010 5:08:44 PM
G - Gain today on average volume for another new high, getting more extended from a sound base. Prior highs in the $62 area and its 50 DMA line define chart support.
>>> The latest Featured Stock Update with an annotated graph appeared on 8/26/2010. Click here.
View all notes |
Alert me of new notes |
CANSLIM.net Company Profile |
SEC |
Zacks Reports |
StockTalk |
News |
Chart |
Request a new note
C
A N
S L
I M
|
MRX
-
NYSE
Medicis Pharmaceut Cl A
DRUGS - Biotechnology
|
$29.41
|
+0.26
0.89% |
$30.26
|
1,817,365
149.17% of 50 DAV
50 DAV is 1,218,300
|
$30.00
-1.97%
|
8/12/2010
|
$26.88
|
PP = $26.71
|
|
MB = $28.05
|
Most Recent Note - 9/16/2010 12:55:28 PM
G - Gapped up today and hit a new 52-week high. Prior highs in the $28 area define the initial chart support level to watch.
>>> The latest Featured Stock Update with an annotated graph appeared on 8/12/2010. Click here.
View all notes |
Alert me of new notes |
CANSLIM.net Company Profile |
SEC |
Zacks Reports |
StockTalk |
News |
Chart |
Request a new note
C
A N
S L
I M
|
Symbol/Exchange
Company Name
Industry Group |
PRICE |
CHANGE
(%Change) |
Day High |
Volume
(% DAV)
(% 50 day avg vol) |
52 Wk Hi
% From Hi |
Featured
Date |
Price
Featured |
Pivot Featured |
|
Max Buy |
MWIV
-
NASDAQ
M W I Veterinary Supply
HEALTH SERVICES - Medical Instruments and; Supplies
|
$54.73
|
-0.42
-0.76% |
$55.19
|
17,853
23.93% of 50 DAV
50 DAV is 74,600
|
$57.34
-4.55%
|
7/29/2010
|
$52.05
|
PP = $52.09
|
|
MB = $54.69
|
Most Recent Note - 9/14/2010 3:54:42 PM
G - Today's gain without great volume conviction has it trading above its "max buy" level and the color code is changed to green. Its 50 DMA line defines important chart support.
>>> The latest Featured Stock Update with an annotated graph appeared on 9/7/2010. Click here.
View all notes |
Alert me of new notes |
CANSLIM.net Company Profile |
SEC |
Zacks Reports |
StockTalk |
News |
Chart |
Request a new note
C
A N
S L
I M
|
NEM
-
NYSE
Newmont Mining Corp
METALS and MINING - Gold
|
$63.18
|
+0.28
0.45% |
$63.85
|
6,272,991
96.93% of 50 DAV
50 DAV is 6,472,000
|
$64.03
-1.33%
|
8/31/2010
|
$61.32
|
PP = $63.48
|
|
MB = $66.65
|
Most Recent Note - 9/14/2010 1:13:37 PM
Y - Gapped up today, rallying with above average volume for a considerable gain above its pivot point. It hit a new 52-week high, and no overhead supply remains to hinder its progress. Leadership in the Mining - Gold/Silver/Gems group (L criteria) is a nice reassurance.
>>> The latest Featured Stock Update with an annotated graph appeared on 9/14/2010. Click here.
View all notes |
Alert me of new notes |
CANSLIM.net Company Profile |
SEC |
Zacks Reports |
StockTalk |
News |
Chart |
Request a new note
C
A N
S L
I M
|
NEOG
-
NASDAQ
Neogen Corp
DRUGS - Diagnostic Substances
|
$31.02
|
-0.36
-1.15% |
$31.54
|
143,299
152.77% of 50 DAV
50 DAV is 93,800
|
$32.42
-4.32%
|
9/1/2010
|
$30.79
|
PP = $30.49
|
|
MB = $32.01
|
Most Recent Note - 9/16/2010 4:53:27 PM
Y- Loss today with higher volume is indicative of mild distributional pressure. Prior highs in the $30 area define initial support to watch.
>>> The latest Featured Stock Update with an annotated graph appeared on 8/20/2010. Click here.
View all notes |
Alert me of new notes |
CANSLIM.net Company Profile |
SEC |
Zacks Reports |
StockTalk |
News |
Chart |
Request a new note
C
A N
S L
I M
|
NFLX
-
NASDAQ
Netflix Inc
SPECIALTY RETAIL - Music and Video Stores
|
$140.50
|
-2.62
-1.83% |
$143.50
|
4,075,540
85.81% of 50 DAV
50 DAV is 4,749,700
|
$149.95
-6.30%
|
8/10/2010
|
$124.05
|
PP = $124.00
|
|
MB = $130.20
|
Most Recent Note - 9/15/2010 5:08:59 PM
G - Quietly consolidating from its all-time high with volume totals cooling for the past week. No resistance remains to hinder its progress.
>>> The latest Featured Stock Update with an annotated graph appeared on 8/10/2010. Click here.
View all notes |
Alert me of new notes |
CANSLIM.net Company Profile |
SEC |
Zacks Reports |
StockTalk |
News |
Chart |
Request a new note
C
A N
S L
I M
|
NTAP
-
NASDAQ
Netapp Inc
COMPUTER HARDWARE - Data Storage Devices
|
$48.68
|
-0.62
-1.26% |
$49.46
|
7,909,799
105.61% of 50 DAV
50 DAV is 7,489,700
|
$49.56
-1.78%
|
9/8/2010
|
$46.98
|
PP = $44.99
|
|
MB = $47.24
|
Most Recent Note - 9/15/2010 1:23:52 PM
G - Hit another new 52-week high today, getting more extended from a sound base. Support to watch is at prior chart highs near its latest pivot point.
>>> The latest Featured Stock Update with an annotated graph appeared on 9/8/2010. Click here.
View all notes |
Alert me of new notes |
CANSLIM.net Company Profile |
SEC |
Zacks Reports |
StockTalk |
News |
Chart |
Request a new note
C
A N
S L
I M
|
Symbol/Exchange
Company Name
Industry Group |
PRICE |
CHANGE
(%Change) |
Day High |
Volume
(% DAV)
(% 50 day avg vol) |
52 Wk Hi
% From Hi |
Featured
Date |
Price
Featured |
Pivot Featured |
|
Max Buy |
PAY
-
NYSE
Verifone Systems Inc
COMPUTER HARDWARE - Transaction Automation Systems
|
$28.23
|
+0.62
2.25% |
$28.28
|
1,489,459
118.78% of 50 DAV
50 DAV is 1,254,000
|
$28.00
0.82%
|
8/25/2010
|
$24.30
|
PP = $23.74
|
|
MB = $24.93
|
Most Recent Note - 9/16/2010 4:49:09 PM
G - Gain today with above average volume for a new 52-week high, getting more extended from a sound base.
>>> The latest Featured Stock Update with an annotated graph appeared on 8/30/2010. Click here.
View all notes |
Alert me of new notes |
CANSLIM.net Company Profile |
SEC |
Zacks Reports |
StockTalk |
News |
Chart |
Request a new note
C
A N
S L
I M
|
PRGO
-
NASDAQ
Perrigo Co
DRUGS - Drug Related Products
|
$63.24
|
-1.19
-1.85% |
$65.38
|
1,667,015
157.62% of 50 DAV
50 DAV is 1,057,600
|
$64.66
-2.20%
|
9/15/2010
|
$63.73
|
PP = $64.76
|
|
MB = $68.00
|
Most Recent Note - 9/16/2010 1:04:58 PM
Y - Gapped up today and hit a new 52-week high, then quickly reversed into the red, a sign it may be encountering distributional pressure. After an orderly 5-month base, its color code was changed to yellow, while confirming gains with above average volume and a close above the pivot point cited would trigger a technical buy signal. No overhead supply remains to act as resistance. The high-ranked Medical - Generic Drugs firm's sales revenues showed a +22% increase (acceleration) in the latest quarter. It has shown very strong quarterly earnings increases and has a good annual earnings (A criteria) history.
>>> The latest Featured Stock Update with an annotated graph appeared on 9/15/2010. Click here.
View all notes |
Alert me of new notes |
CANSLIM.net Company Profile |
SEC |
Zacks Reports |
StockTalk |
News |
Chart |
Request a new note
C
A N
S L
I M
|
ROVI
-
NASDAQ
Rovi Corp
COMPUTER SOFTWARE andamp; SERVICES - Security Software andamp; Services
|
$42.91
|
-1.16
-2.63% |
$43.99
|
1,797,862
150.68% of 50 DAV
50 DAV is 1,193,200
|
$45.80
-6.31%
|
8/31/2010
|
$43.31
|
PP = $45.06
|
|
MB = $47.31
|
Most Recent Note - 9/16/2010 3:32:04 PM
Y - It has pulled back to its 50 DMA line today with a third consecutive loss backed by above average volume. It has been slumping since its negative reversal on 9/14/10 after touching a new 52-week high.
>>> The latest Featured Stock Update with an annotated graph appeared on 8/24/2010. Click here.
View all notes |
Alert me of new notes |
CANSLIM.net Company Profile |
SEC |
Zacks Reports |
StockTalk |
News |
Chart |
Request a new note
C
A N
S L
I M
|
SHOO
-
NASDAQ
Steven Madden Limited
CONSUMER NON-DURABLES - Textile - Apparel Footwear
|
$38.67
|
+0.06
0.16% |
$38.98
|
236,414
55.33% of 50 DAV
50 DAV is 427,300
|
$40.98
-5.64%
|
9/15/2010
|
$38.94
|
PP = $40.27
|
|
MB = $42.28
|
Most Recent Note - 9/15/2010 11:42:29 AM
Y - Rallying today within close striking range of its August high and its 52-week high. New pivot point is cited today based on its 7/30/10 high plus ten cents.
>>> The latest Featured Stock Update with an annotated graph appeared on 8/5/2010. Click here.
View all notes |
Alert me of new notes |
CANSLIM.net Company Profile |
SEC |
Zacks Reports |
StockTalk |
News |
Chart |
Request a new note
C
A N
S L
I M
|
SLW
-
NYSE
Silver Wheaton Corp
METALS and; MINING - Silver
|
$25.38
|
+0.56
2.26% |
$25.43
|
5,881,302
124.80% of 50 DAV
50 DAV is 4,712,500
|
$25.35
0.12%
|
8/25/2010
|
$21.40
|
PP = $21.99
|
|
MB = $23.09
|
Most Recent Note - 9/16/2010 1:08:58 PM
G - Inching higher today, it has been stubbornly holding its ground after recent gains to new all-time highs. Extended from any sound base, its previous highs in the $21 area define chart support to watch.
>>> The latest Featured Stock Update with an annotated graph appeared on 8/25/2010. Click here.
View all notes |
Alert me of new notes |
CANSLIM.net Company Profile |
SEC |
Zacks Reports |
StockTalk |
News |
Chart |
Request a new note
C
A N
S L
I M
|
Symbol/Exchange
Company Name
Industry Group |
PRICE |
CHANGE
(%Change) |
Day High |
Volume
(% DAV)
(% 50 day avg vol) |
52 Wk Hi
% From Hi |
Featured
Date |
Price
Featured |
Pivot Featured |
|
Max Buy |
UA
-
NYSE
Under Armour Inc Cl A
CONSUMER NON-DURABLES - Textile - Apparel Clothing
|
$44.07
|
+1.51
3.55% |
$44.19
|
913,670
127.00% of 50 DAV
50 DAV is 719,400
|
$44.14
-0.16%
|
9/9/2010
|
$39.99
|
PP = $40.10
|
|
MB = $42.11
|
Most Recent Note - 9/16/2010 3:33:26 PM
G - At its 52-week high and on track today for its 12th consecutive gain. Its color code was changed to green after getting extended from its prior chart highs. Its 9/14/10 gain with +242% of its average daily volume clinched a technical buy signal.
>>> The latest Featured Stock Update with an annotated graph appeared on 9/9/2010. Click here.
View all notes |
Alert me of new notes |
CANSLIM.net Company Profile |
SEC |
Zacks Reports |
StockTalk |
News |
Chart |
Request a new note
C
A N
S L
I M
|
UFPT
-
NASDAQ
U F P Tech Inc
CONSUMER NON-DURABLES - Packaging and Containers
|
$11.10
|
+0.17
1.56% |
$11.33
|
51,156
137.89% of 50 DAV
50 DAV is 37,100
|
$11.59
-4.23%
|
9/16/2010
|
$11.20
|
PP = $11.69
|
|
MB = $12.27
|
Most Recent Note - 9/16/2010 1:18:29 PM
Y - Rallying toward its 52-week high today, and no resistance remains due to overhead supply. Color code is changed to yellow, however disciplined investors know that a technical buy signal requires a subsequent breakout on heavy volume. The 3 latest quarterly comparisons showed strong sales revenues and earnings acceleration following a streak of negative or near flat comparisons. It has an impressive annual earnings (A criteria) growth rate. Small supply of only 6.21 million shares (S criteria) outstanding can contribute to great price volatility in the event of institutional buying or selling.
There are no Featured Stock Updates™ available for this stock at this time. You may request one by clicking the Request a New Note link below
View all notes |
Alert me of new notes |
CANSLIM.net Company Profile |
SEC |
Zacks Reports |
StockTalk |
News |
Chart |
Request a new note
C
A N
S L
I M
|
ULTA
-
NASDAQ
Ulta Salon Cosm & Frag
SPECIALTY RETAIL - Specialty Retail, Other
|
$28.03
|
+0.02
0.07% |
$28.13
|
250,673
40.87% of 50 DAV
50 DAV is 613,400
|
$29.25
-4.17%
|
9/3/2010
|
$26.36
|
PP = $25.89
|
|
MB = $27.18
|
Most Recent Note - 9/15/2010 5:10:53 PM
G - Pulled back on lighter volume today after considerable gains for new 52-week highs with above average volume. Its color code was changed to green after getting extended from its latest base.
>>> The latest Featured Stock Update with an annotated graph appeared on 9/3/2010. Click here.
View all notes |
Alert me of new notes |
CANSLIM.net Company Profile |
SEC |
Zacks Reports |
StockTalk |
News |
Chart |
Request a new note
C
A N
S L
I M
|
VIT
-
NYSE
Vanceinfo Tech Inc Ads
COMPUTER SOFTWARE and SERVICES - Business Software and Services
|
$29.44
|
+0.23
0.79% |
$29.98
|
1,147,540
209.63% of 50 DAV
50 DAV is 547,400
|
$30.50
-3.48%
|
7/8/2010
|
$25.20
|
PP = $26.58
|
|
MB = $27.91
|
Most Recent Note - 9/16/2010 1:19:39 PM
G - Consolidating in a tight trading range near its all-time high. Its 50 DMA line defines chart support to watch.
>>> The latest Featured Stock Update with an annotated graph appeared on 8/31/2010. Click here.
View all notes |
Alert me of new notes |
CANSLIM.net Company Profile |
SEC |
Zacks Reports |
StockTalk |
News |
Chart |
Request a new note
C
A N
S L
I M
|
WCRX
-
NASDAQ
Warner Chilcott Plc
DRUGS - Drug Manufacturers - Other
|
$22.17
|
-0.11
-0.49% |
$22.32
|
1,235,464
52.98% of 50 DAV
50 DAV is 2,332,100
|
$22.34
-0.76%
|
8/23/2010
|
$29.54
|
PP = $29.34
|
|
MB = $30.81
|
Most Recent Note - 9/15/2010 5:31:47 PM
Y - Volume was light today as it rallied to a new all-time high. (Price data will be adjusted downward to account for the recent special $8.50 cash dividend dividend impacting its share price as of 9/09/10 trading, so the "max buy" level $30.81 -$8.50 equals $22.31, pennies from today's close.
>>> The latest Featured Stock Update with an annotated graph appeared on 8/23/2010. Click here.
View all notes |
Alert me of new notes |
CANSLIM.net Company Profile |
SEC |
Zacks Reports |
StockTalk |
News |
Chart |
Request a new note
C
A N
S L
I M
|
Symbol/Exchange
Company Name
Industry Group |
PRICE |
CHANGE
(%Change) |
Day High |
Volume
(% DAV)
(% 50 day avg vol) |
52 Wk Hi
% From Hi |
Featured
Date |
Price
Featured |
Pivot Featured |
|
Max Buy |