You are not logged in.
This means you
CAN ONLY VIEW reports that were published prior to Monday, April 14, 2025.
You
MUST UPGRADE YOUR MEMBERSHIP if you want to see any current reports.
AFTER MARKET UPDATE - TUESDAY, SEPTEMBER 15TH, 2009
Previous After Market Report Next After Market Report >>>
|
|
|
|
DOW |
+56.61 |
9,683.41 |
+0.59% |
|
Volume |
1,496,800,420 |
+24% |
|
Volume |
2,400,293,700 |
+9% |
|
NASDAQ |
+10.86 |
2,102.64 |
+0.52% |
|
Advancers |
2,139 |
69% |
|
Advancers |
1,590 |
56% |
|
S&P 500 |
+3.29 |
1,052.63 |
+0.31% |
|
Decliners |
893 |
29% |
|
Decliners |
1,110 |
39% |
|
Russell 2000 |
+4.81 |
604.84 |
+0.80% |
|
52 Wk Highs |
229 |
|
|
52 Wk Highs |
110 |
|
|
S&P 600 |
+2.70 |
317.25 |
+0.86% |
|
52 Wk Lows |
2 |
|
|
52 Wk Lows |
5 |
|
|
 |
Major Averages Rise With Higher Volume and Positive Breadth
Adam Sarhan, Contributing Writer,
The major averages edged higher after a stronger than expected retail sales report and positive comments from Fed Chairman Ben Bernanke. Volume totals on the exchanges were reported heavier than Monday's session, which showed that institutional investors were accumulating stocks. Advancers led decliners by over a 2-to-1 ratio on the NYSE and by almost a 3-to-2 ratio on the Nasdaq exchange. There were 28 high-ranked companies from the CANSLIM.net Leaders List that made a new 52-week high and appeared on the CANSLIM.net BreakOuts Page, more than double the 13 issues that appeared on the prior session. New 52-week highs still outnumbered new 52-week lows on both exchanges while new lows were in the single digits yet again.
Retail sales experienced their largest gain in three years and rose +2.7% in August. This blew away the July's reading of a -0.2% drop and the Street's forecast for a +1.9% rise. Excluding automobile sales, which were inflated due to the government's "Cash for Clunkers" program, retail sales rose +1.1%, which also topped forecasts. A separate report which measures manufacturing in the New York area was released and also topped estimates. These are the latest in a series of stronger than expected economic data which suggests the brunt of the recession has passed. Elsewhere, Ben Bernanke said it is "very likely" that the recession is over.
Stocks advanced for the seventh time in eight days on the flurry of stronger than expected economic data. Also billionaire investor Warren Buffett endorsed the notion of buying stocks when he announced that Berkshire Hathaway (BRKA +1.27%) is buying equities at these levels. Mr. Buffett told a conference in California that Berkshire Hathaway is “buying stocks right as we speak” and he’s getting a “lot for my money” in equities.
Tuesday marked the one-year anniversary of Lehman Brothers Holdings Inc.’s bankruptcy filing accelerated the credit crunch, helped drag the global economy into its worst recession since World War II and sent the S&P 500 to a 12-year low in March 2009. Thankfully, the major averages have rallied sharply since then and the worst of the recession appears to be behind us, if not completely over. The market is a forward looking mechanism and the fact that it has rallied sharply off the March lows (and each pullback has been very mild) suggests brighter days lie ahead. PICTURED: The Dow Jones Industrial Average rallied on higher volume as it closed above recent resistance.
|
|
|
 |
Gold & Silver Index Reaches New 2009 High Close
Kenneth J. Gruneisen - Passed the CAN SLIM® Master's Exam
The Gold & Silver Index ($XAU +2.43%) was one of the session's biggest gainers, and the Oil Services Index ($OSX +1.55%) and Integrated Oil Index ($XOI +0.64%) also rose. While the Bank Index ($BKX +1.44%) traded up, the influential Broker/Dealer Index ($XBD -0.52%) and Retail Index ($RLX -0.14%) ended with small losses. The Networking Index ($NWX +1.32%) led the tech sector higher, followed by the Semiconductor Index ($SOX +0.86%) and Internet Index ($IIX +0.73%). The Healthcare Index ($HMO -2.57%) was a standout laggard, and the Biotechnology Index ($BTK -0.59%) ended with a modest loss, yet most of Tuesday's action was obviously to the plus side.
Charts courtesy www.stockcharts.com
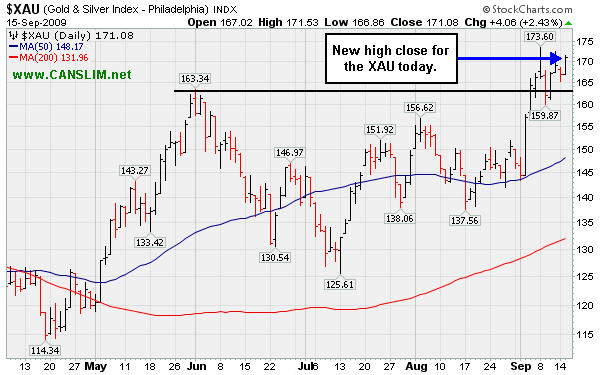
PICTURED: The Gold & Silver Index ($XAU +2.43%) rallied for a new 2009 high close on Tuesday.
| Oil Services |
$OSX |
190.30 |
+2.90 |
+1.55% |
+56.77% |
| Healthcare |
$HMO |
1,254.27 |
-33.02 |
-2.57% |
+30.63% |
| Integrated Oil |
$XOI |
1,030.40 |
+6.52 |
+0.64% |
+5.18% |
| Semiconductor |
$SOX |
325.48 |
+2.78 |
+0.86% |
+53.41% |
| Networking |
$NWX |
231.04 |
+3.00 |
+1.32% |
+60.57% |
| Internet |
$IIX |
214.32 |
+1.55 |
+0.73% |
+60.22% |
| Broker/Dealer |
$XBD |
116.46 |
-0.61 |
-0.52% |
+50.33% |
| Retail |
$RLX |
373.63 |
-0.53 |
-0.14% |
+33.79% |
| Gold & Silver |
$XAU |
171.08 |
+4.06 |
+2.43% |
+38.13% |
| Bank |
$BKX |
46.45 |
+0.66 |
+1.44% |
+4.81% |
| Biotech |
$BTK |
944.81 |
-5.60 |
-0.59% |
+45.99% |
|
|
|
 |
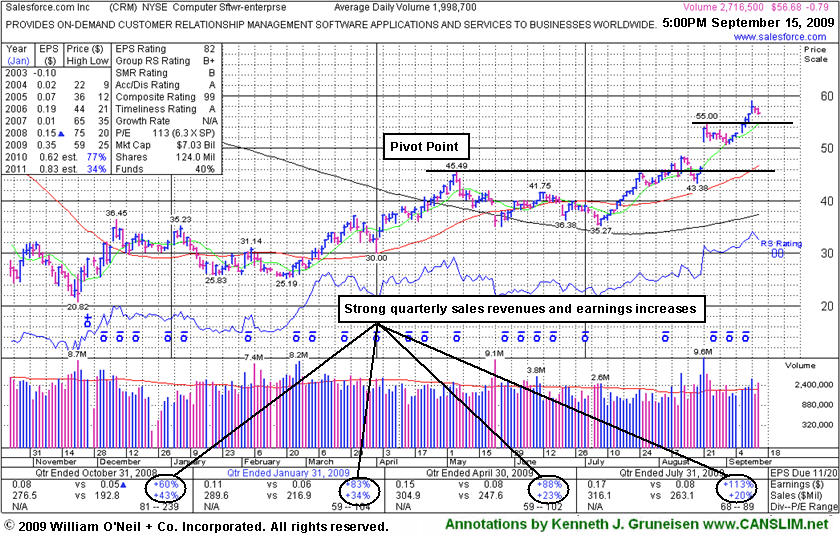
Extended Stock Encountered Mild Distributional Pressure
Kenneth J. Gruneisen - Passed the CAN SLIM® Master's Exam
Salesforce.com, Inc.'s (CRM -$0.79 or -1.03% to $56.68) loss today on higher volume was a sign of distribution. Prior highs near $55 are an initial support level to watch on pullbacks, while it is now extended from a sound base. It recently rose from a "3-weeks tight" type pattern, and it stubbornly held its ground since its "breakaway gap" for a considerable gain on 8/21/09 with more than 5 times average volume. The stock's exceptional action was discussed further in the "Ken's Mailbag" Q&A with a member in the 8/21/09 After Market Update (read here).
A Stock Bulletin was published with detailed analysis and an annotated graph on 8/16/09 (read here). Stock Bulletins are not part of a routine daily or monthly report that we publish for CANSLIM.net's paying members, they are occasionally prepared as the market action dictates. The most action-worthy new ideas show up more often highlighted in yellow in the CANSLIM.net Mid-Day BreakOuts Report, or in the monthly issue of CANSLIM.net News. Market conditions in many recent months have been such that far fewer ideas than we would like have been worthy of the full blown coverage typically provided on stocks in the monthly newsletter, let alone special bulletins. The last bulletin published prior to CRM was more than a year ago - 6/04/2008 Almost Family (AFAM).
|
|
|
Color Codes Explained :
Y - Better candidates highlighted by our
staff of experts.
G - Previously featured
in past reports as yellow but may no longer be buyable under the
guidelines.
***Last / Change / Volume quote data in this table corresponds with the timestamp on the note***
Symbol/Exchange
Company Name
Industry Group |
Last |
Chg. |
Vol
% DAV |
Date Featured |
Price Featured |
Latest Pivot Point
Featured |
Status |
| Latest Max Buy Price |
ARO
- NYSE
Aeropostale Inc
RETAIL - Apparel Stores
|
$42.69
|
+0.00
|
1,734,302
58% DAV
2,972,200
|
8/21/2009
(Date
Featured) |
$39.21
(Price
Featured) |
PP = $38.84 |
G |
| MB = $40.78 |
Most Recent Note - 9/15/2009 4:26:27 PM
G - This high-ranked leader in the Retail - Clothing/shoe group is quietly hovering at all-time highs today with nobody rushing to the exits thus far. Support to watch is at prior highs in the $38 area. It was featured in yellow in the 8/21/09 Mid-Day BreakOuts Report (read here).
>>> The latest Featured Stock Update with an annotated graph appeared on 9/2/2009. click here.
|
|
C
A
S
I |
News |
Chart |
SEC
View all notes Alert
me of new notes
Company
Profile
|
ARST
-
|
$21.97
|
+0.07
|
856,241
117% DAV
732,200
|
9/1/2009
(Date
Featured) |
$19.91
(Price
Featured) |
PP = $20.90 |
G |
| MB = $21.95 |
Most Recent Note - 9/15/2009 4:28:30 PM
G - Stubbornly holding its gains since its considerable gain on 9/04/09 with nearly 3 times average volume triggered a technical buy signal. Prior chart highs in the $20 area are important support to watch on pullbacks. Featured in yellow in the 9/01/09 Mid-Day BreakOuts Report with an annotated daily graph (read here) and it was also featured with more detailed analysis in the September 2009 CANSLIM.net News with an annotated weekly graph (read here).
>>> The latest Featured Stock Update with an annotated graph appeared on 9/4/2009. click here.
|
|
C
A
S
I |
News |
Chart |
SEC
View all notes Alert
me of new notes
Company
Profile
|
BIDU
- NASDAQ
Baidu Inc Ads
INTERNET - Internet Information Providers
|
$397.53
|
+18.03
|
3,636,041
206% DAV
1,768,400
|
9/8/2009
(Date
Featured) |
$351.80
(Price
Featured) |
PP = $368.59 |
G |
| MB = $387.02 |
Most Recent Note - 9/15/2009 4:31:40 PM
G - Considerable gain on more than 2 times average volume helped it rise beyond its "max buy" level today and its color code was changed to green. It has quickly gotten extended from a sound base. BIDU was featured in yellow in the 9/08/09 Mid-Day BreakOuts Report (read here).
>>> The latest Featured Stock Update with an annotated graph appeared on 9/8/2009. click here.
|
|
C
A
S
I |
News |
Chart |
SEC
View all notes Alert
me of new notes
Company
Profile
|
CRM
- NYSE
Salesforce.com Inc
INTERNET - Internet Software & Services
|
$56.73
|
-0.74
|
2,931,871
151% DAV
1,945,600
|
8/16/2009
(Date
Featured) |
$47.12
(Price
Featured) |
PP = $45.59 |
G |
| MB = $47.87 |
Most Recent Note - 9/15/2009 4:38:29 PM
G - Loss today on higher volume was a sign of distribution. Prior highs near $55 are an intial support level to watch on pullbacks, while it is now extended from a sound base. It recently rose from a "3-weeks tight" type pattern following its "breakaway gap" on 8/21/09 with more than 5 times average volume. Detailed analysis and an annotated graph were included when recently featured in the 8/16/09 Stock Bulletin (read here).
>>> The latest Featured Stock Update with an annotated graph appeared on 9/15/2009. click here.
|
|
C
A
S
I |
News |
Chart |
SEC
View all notes Alert
me of new notes
Company
Profile
|
EBIX
- NASDAQ
Ebix Inc
COMPUTER SOFTWARE & SERVICES - Business Software & Services
|
$49.91
|
-1.12
|
139,227
131% DAV
106,600
|
8/28/2009
(Date
Featured) |
$45.86
(Price
Featured) |
PP = $45.35 |
G |
| MB = $47.62 |
Most Recent Note - 9/15/2009 4:41:02 PM
G - Today was its 3rd straight loss, and it is too extended from an ideal buy point within the investment system guidelines. Last week included another whipsaw-like shakeout that briefly tested support, like in mid-August. It has a small supply of only 6.62 million shares in the float. EBIX rallied as much as +19.76% since featured in yellow in the 8/28/09 Mid-Day BreakOuts Report (read here).
>>> The latest Featured Stock Update with an annotated graph appeared on 9/11/2009. click here.
|
|
C
A
S
I |
News |
Chart |
SEC
View all notes Alert
me of new notes
Company
Profile
|
GMCR
- NASDAQ
Green Mtn Coffee Roastrs
FOOD & BEVERAGE - Processed & Packaged Goods
|
$64.87
|
-0.45
|
700,976
47% DAV
1,495,100
|
7/17/2009
(Date
Featured) |
$60.15
(Price
Featured) |
PP = $63.79 |
G |
| MB = $66.98 |
Most Recent Note - 9/15/2009 4:44:50 PM
G - Small loss today following 6 consecutive gains that helped it rally back above its 50 DMA line. It has not formed a new sound base since it completed an additional share offering on 8/07/09, and overhead supply up to $72 may act as resistance. GMCR traded up more than +168% since appearing with an annotated graph under the headline "It May Soon Be Time To Go Green" when featured in the January 2009 CANSLIM.net News (read here).
>>> The latest Featured Stock Update with an annotated graph appeared on 9/10/2009. click here.
|
|
C
A
S
I |
News |
Chart |
SEC
View all notes Alert
me of new notes
Company
Profile
|
NTES
- NASDAQ
Netease Inc Adr
INTERNET - Internet Information Providers
|
$42.15
|
-0.42
|
2,793,566
131% DAV
2,138,700
|
7/17/2009
(Date
Featured) |
$39.29
(Price
Featured) |
PP = $38.74 |
G |
| MB = $40.68 |
Most Recent Note - 9/15/2009 4:48:03 PM
G - Down today on higher volume for a 4th straight loss, testing support at its 50 DMA line. The next support is as prior chart highs in the $38 area. Deterioration below those levels would raise more serious concerns and trigger additional sell signals.
>>> The latest Featured Stock Update with an annotated graph appeared on 9/14/2009. click here.
|
|
C
A
S
I |
News |
Chart |
SEC
View all notes Alert
me of new notes
Company
Profile
|
NVEC
- NASDAQ
N V E Corp
ELECTRONICS - Semiconductor - Specialized
|
$62.83
|
+1.14
|
44,454
53% DAV
83,100
|
8/26/2009
(Date
Featured) |
$55.32
(Price
Featured) |
PP = $57.60 |
G |
| MB = $60.48 |
Most Recent Note - 9/15/2009 4:49:43 PM
G - Small gain on light volume today for a new high close. This high-ranked leader from the Electronics industry group quickly got extended from its latest sound base. Keep in mind its small supply (the S criteria) of shares outstanding which can contribute to greater than usual volatility. Be mindful of its still rather minuscule sales revenues. These concerns heighten the need for great discipline in trading (buying AND selling).
>>> The latest Featured Stock Update with an annotated graph appeared on 9/1/2009. click here.
|
|
C
A
S
I |
News |
Chart |
SEC
View all notes Alert
me of new notes
Company
Profile
|
PEGA
- NASDAQ
Pegasystems Inc
COMPUTER SOFTWARE & SERVICES - Business Software & Services
|
$32.49
|
-0.29
|
312,081
85% DAV
368,700
|
9/9/2009
(Date
Featured) |
$31.14
(Price
Featured) |
PP = $33.35 |
Y |
| MB = $35.02 |
Most Recent Note - 9/15/2009 4:56:54 PM
Y - Consolidating only -2% from its all-time high, this high-ranked Computer Software - Financial firm's previously cited upward trendline connecting its July-August lows may be considered an initial technical support level above its 50 DMA line and prior chart highs. Be sure to always limit losses by selling any time a stock falls more than -7% from your buy point after making initial buys or add-on buys.
>>> The latest Featured Stock Update with an annotated graph appeared on 9/9/2009. click here.
|
|
C
A
S
I |
News |
Chart |
SEC
View all notes Alert
me of new notes
Company
Profile
|
|
|
|
THESE ARE NOT BUY RECOMMENDATIONS!
Comments contained in the body of this report are technical
opinions only. The material herein has been obtained
from sources believed to be reliable and accurate, however,
its accuracy and completeness cannot be guaranteed.
This site is not an investment advisor, hence it does
not endorse or recommend any securities or other investments.
Any recommendation contained in this report may not
be suitable for all investors and it is not to be deemed
an offer or solicitation on our part with respect to
the purchase or sale of any securities. All trademarks,
service marks and trade names appearing in this report
are the property of their respective owners, and are
likewise used for identification purposes only.
This report is a service available
only to active Paid Premium Members.
You may opt-out of receiving report notifications
at any time. Questions or comments may be submitted
by writing to Premium Membership Services 665 S.E. 10 Street, Suite 201 Deerfield Beach, FL 33441-5634 or by calling 1-800-965-8307
or 954-785-1121.
|
|
|


