***Last / Change / Volume data in this table is the closing quote data***
Symbol/Exchange
Company Name
Industry Group |
PRICE |
CHANGE
(%Change) |
Day High |
Volume
(% DAV)
(% 50 day avg vol) |
52 Wk Hi
% From Hi |
Featured
Date |
Price
Featured |
Pivot Featured |
|
Max Buy |
ALXN
-
NASDAQ
Alexion Pharmaceuticals
DRUGS - Drug Manufacturers - Other
|
$110.47
|
+0.01
0.01% |
$111.77
|
1,113,044
91.21% of 50 DAV
50 DAV is 1,220,300
|
$111.06
-0.53%
|
8/23/2012
|
$103.70
|
PP = $110.06
|
|
MB = $115.56
|
Most Recent Note - 9/10/2012 4:41:29 PM
Y - Volume totals have been below average while recently consolidating within close striking distance of its 52-week high. Subsequent volume-driven gains above its pivot point may trigger a new (or add-on) technical buy signal.
>>> The latest Featured Stock Update with an annotated graph appeared on 8/23/2012. Click here.
View all notes |
Alert me of new notes |
CANSLIM.net Company Profile |
SEC |
Zacks Reports |
StockTalk |
News |
Chart |
Request a new note
C
A N
S L
I M


|
ASPS
-
NASDAQ
Altisource Ptf Sltns Sa
REAL ESTATE - Property Management/Developmen
|
$89.76
|
-1.30
-1.43% |
$91.62
|
129,730
99.18% of 50 DAV
50 DAV is 130,800
|
$92.29
-2.74%
|
6/5/2012
|
$60.01
|
PP = $63.00
|
|
MB = $66.15
|
Most Recent Note - 9/11/2012 6:05:23 PM
G - Perched -5.1% from its all-time high consolidating in a tight range. Recent lows define near-term support above its 50 DMA line. See the latest FSU analysis for more details and a new annotated graph.
>>> The latest Featured Stock Update with an annotated graph appeared on 9/11/2012. Click here.
View all notes |
Alert me of new notes |
CANSLIM.net Company Profile |
SEC |
Zacks Reports |
StockTalk |
News |
Chart |
Request a new note
C
A N
S L
I M
|
CFNL
-
NASDAQ
Cardinal Financial Corp
BANKING - Regional - Southeast Banks
|
$14.09
|
+0.03
0.21% |
$14.33
|
116,363
195.90% of 50 DAV
50 DAV is 59,400
|
$14.18
-0.63%
|
8/17/2012
|
$12.84
|
PP = $13.31
|
|
MB = $13.98
|
 Most Recent Note - 9/14/2012 4:41:06 PM
G - Today's 4th consecutive gain was backed by above average volume and it hit another new 52-week high. Prior highs and its 50 DMA line define support to watch on pullbacks.
>>> The latest Featured Stock Update with an annotated graph appeared on 8/21/2012. Click here.
View all notes |
Alert me of new notes |
CANSLIM.net Company Profile |
SEC |
Zacks Reports |
StockTalk |
News |
Chart |
Request a new note
C
A N
S L
I M
|
CMCSA
-
NASDAQ
Comcast Corp Cl A
MEDIA - CATV Systems
|
$35.30
|
+0.05
0.14% |
$35.45
|
12,633,092
101.79% of 50 DAV
50 DAV is 12,410,900
|
$35.32
-0.04%
|
6/11/2012
|
$29.94
|
PP = $30.98
|
|
MB = $32.53
|
Most Recent Note - 9/13/2012 5:10:09 PM
G - Hit a new 52-week high today, wedging out of an orderly flat base without great volume conviction behind its gain. No new pivot point is being cited because fundamental concerns were raised by sub par sales and earnings growth in the Jun '12 quarter.
>>> The latest Featured Stock Update with an annotated graph appeared on 8/15/2012. Click here.
View all notes |
Alert me of new notes |
CANSLIM.net Company Profile |
SEC |
Zacks Reports |
StockTalk |
News |
Chart |
Request a new note
C
A N
S L
I M
|
DVA
-
NYSE
Davita Inc
HEALTH SERVICES - Specialized Health Services
|
$98.45
|
-1.14
-1.14% |
$100.21
|
934,773
142.08% of 50 DAV
50 DAV is 657,900
|
$103.97
-5.31%
|
9/5/2012
|
$102.92
|
PP = $100.62
|
|
MB = $105.65
|
Most Recent Note - 9/14/2012 4:38:26 PM
Y - Enduring mild distributional pressure while consolidating above its 50 DMA line. A subsequent gain for a new high close above its pivot point backed by +40% above average volume is the bare minimum volume needed to trigger a technical buy signal.
>>> The latest Featured Stock Update with an annotated graph appeared on 9/5/2012. Click here.
View all notes |
Alert me of new notes |
CANSLIM.net Company Profile |
SEC |
Zacks Reports |
StockTalk |
News |
Chart |
Request a new note
C
A N
S L
I M
|
Symbol/Exchange
Company Name
Industry Group |
PRICE |
CHANGE
(%Change) |
Day High |
Volume
(% DAV)
(% 50 day avg vol) |
52 Wk Hi
% From Hi |
Featured
Date |
Price
Featured |
Pivot Featured |
|
Max Buy |
ECPG
-
NASDAQ
Encore Capital Group Inc
FINANCIAL SERVICES - Credit Services
|
$30.04
|
+0.33
1.11% |
$30.61
|
199,405
169.13% of 50 DAV
50 DAV is 117,900
|
$30.47
-1.41%
|
8/3/2012
|
$29.91
|
PP = $30.45
|
|
MB = $31.97
|
Most Recent Note - 9/14/2012 4:29:59 PM
Y - Touched a new 52-week high with today's 4th consecutive gain backed by +50% above average volume, however it finished the session below its pivot point and prior high closes. Additional volume-driven gains to new highs would be a reassuring sign of accumulation hinting that it is capable of sustaining a meaningful rally. Completed a Secondary Offering on 8/08/12.
>>> The latest Featured Stock Update with an annotated graph appeared on 9/12/2012. Click here.
View all notes |
Alert me of new notes |
CANSLIM.net Company Profile |
SEC |
Zacks Reports |
StockTalk |
News |
Chart |
Request a new note
C
A N
S L
I M
|
EXPE
-
NASDAQ
Expedia Inc
INTERNET - Internet Information Providers
|
$55.88
|
+0.31
0.55% |
$57.00
|
2,431,433
72.62% of 50 DAV
50 DAV is 3,348,200
|
$59.50
-6.08%
|
4/27/2012
|
$41.80
|
PP = $35.57
|
|
MB = $37.35
|
Most Recent Note - 9/13/2012 5:14:02 PM
G - Posted its 7th small gain today in the span of 8 sessions. Consolidating above prior highs and its 50 DMA line defining important near-term chart support in the $50 area.
>>> The latest Featured Stock Update with an annotated graph appeared on 8/14/2012. Click here.
View all notes |
Alert me of new notes |
CANSLIM.net Company Profile |
SEC |
Zacks Reports |
StockTalk |
News |
Chart |
Request a new note
C
A N
S L
I M
|
GPX
-
NYSE
G P Strategies Corp
DIVERSIFIED SERVICES - Education and Training Services
|
$19.98
|
+0.18
0.91% |
$20.09
|
57,591
81.81% of 50 DAV
50 DAV is 70,400
|
$20.67
-3.34%
|
6/29/2012
|
$18.01
|
PP = $18.15
|
|
MB = $19.06
|
Most Recent Note - 9/13/2012 7:07:01 PM
G - Consolidating in a tight trading range perched -4.2% off its 52-week high today, slightly extended from its prior base. Prior highs and its 50 DMA line define chart support in the $18 area. See latest FSU analysis for more details and a new annotated graph.
>>> The latest Featured Stock Update with an annotated graph appeared on 9/13/2012. Click here.
View all notes |
Alert me of new notes |
CANSLIM.net Company Profile |
SEC |
Zacks Reports |
StockTalk |
News |
Chart |
Request a new note
C
A N
S L
I M
|
HMSY
-
NASDAQ
H M S Holdings Corp
COMPUTER SOFTWARE and SERVICES - Healthcare Information Service
|
$32.52
|
-0.16
-0.49% |
$32.97
|
941,862
114.35% of 50 DAV
50 DAV is 823,700
|
$37.19
-12.56%
|
7/27/2012
|
$33.91
|
PP = $34.83
|
|
MB = $36.57
|
Most Recent Note - 9/10/2012 3:37:24 PM
G - Slumping just under its 50 DMA line with today's 4th consecutive loss and its color code is changed to green. A rally above last week's highs is needed to help its technical stance and outlook. Volume-driven gains into new high territory would be a reassuring sign disciplined investors may wait for as an indication of fresh institutional accumulation.
>>> The latest Featured Stock Update with an annotated graph appeared on 8/22/2012. Click here.
View all notes |
Alert me of new notes |
CANSLIM.net Company Profile |
SEC |
Zacks Reports |
StockTalk |
News |
Chart |
Request a new note
C
A N
S L
I M
|
KH
-
NYSE
China Kanghui Hldgs Ads
HEALTH SERVICES - Medical Appliances and Equipment
|
$25.02
|
-0.12
-0.48% |
$25.60
|
34,771
126.90% of 50 DAV
50 DAV is 27,400
|
$27.47
-8.92%
|
8/30/2012
|
$24.19
|
PP = $22.90
|
|
MB = $24.05
|
Most Recent Note - 9/11/2012 1:44:53 PM
G - Above average volume is behind its 5th consecutive loss since a "negative reversal" on 9/05/12 at its all-time high. Prior highs in the $23 area define support to watch on pullbacks.
>>> The latest Featured Stock Update with an annotated graph appeared on 8/30/2012. Click here.
View all notes |
Alert me of new notes |
CANSLIM.net Company Profile |
SEC |
Zacks Reports |
StockTalk |
News |
Chart |
Request a new note
C
A N
S L
I M
|
Symbol/Exchange
Company Name
Industry Group |
PRICE |
CHANGE
(%Change) |
Day High |
Volume
(% DAV)
(% 50 day avg vol) |
52 Wk Hi
% From Hi |
Featured
Date |
Price
Featured |
Pivot Featured |
|
Max Buy |
LKQ
-
NASDAQ
L K Q Corp
WHOLESALE - Auto Parts
|
$39.10
|
+0.17
0.44% |
$39.66
|
582,684
92.74% of 50 DAV
50 DAV is 628,300
|
$40.03
-2.32%
|
8/9/2012
|
$37.93
|
PP = $37.44
|
|
MB = $39.31
|
Most Recent Note - 9/12/2012 4:45:20 PM
G - Color code is changed to green after quietly rising above its "max buy" level. Prior highs in the $37 area define initial support to watch above its 50 DMA line.
>>> The latest Featured Stock Update with an annotated graph appeared on 8/10/2012. Click here.
View all notes |
Alert me of new notes |
CANSLIM.net Company Profile |
SEC |
Zacks Reports |
StockTalk |
News |
Chart |
Request a new note
C
A N
S L
I M
|
LNKD
-
NYSE
Linkedin Corp Class A
INTERNET - Internet Information Providers
|
$123.23
|
+3.76
3.15% |
$125.50
|
3,184,974
126.38% of 50 DAV
50 DAV is 2,520,100
|
$122.85
0.31%
|
9/5/2012
|
$113.25
|
PP = $113.10
|
|
MB = $118.76
|
Most Recent Note - 9/14/2012 4:08:27 PM
G - Hit new 52-week and all-time highs today with a gain backed by above average volume. Prior highs near $113 define initial support to watch on pullbacks.
>>> The latest Featured Stock Update with an annotated graph appeared on 9/6/2012. Click here.
View all notes |
Alert me of new notes |
CANSLIM.net Company Profile |
SEC |
Zacks Reports |
StockTalk |
News |
Chart |
Request a new note
C
A N
S L
I M
|
MIDD
-
NASDAQ
Middleby Corp
MANUFACTURING - Diversified Machinery
|
$116.66
|
+0.44
0.38% |
$116.76
|
123,152
118.87% of 50 DAV
50 DAV is 103,600
|
$122.57
-4.82%
|
8/9/2012
|
$118.60
|
PP = $104.92
|
|
MB = $110.17
|
Most Recent Note - 9/12/2012 4:49:00 PM
G - Volume was light today while holding its ground near its 52-week high. Extended from its prior base, its 50 DMA line and prior highs define important chart support to watch.
>>> The latest Featured Stock Update with an annotated graph appeared on 8/13/2012. Click here.
View all notes |
Alert me of new notes |
CANSLIM.net Company Profile |
SEC |
Zacks Reports |
StockTalk |
News |
Chart |
Request a new note
C
A N
S L
I M
|
N
-
NYSE
Netsuite Inc
DIVERSIFIED SERVICES - Business/Management Services
|
$62.86
|
+0.58
0.93% |
$63.23
|
678,716
102.77% of 50 DAV
50 DAV is 660,400
|
$62.87
-0.02%
|
8/20/2012
|
$55.88
|
PP = $59.32
|
|
MB = $62.29
|
Most Recent Note - 9/13/2012 12:35:06 PM
Y - Hitting another new 52-week high today. On the prior session it rallied above its pivot point with +85% above average volume triggering a new (or add-on) technical buy signal. Its 50 DMA line defines important near-term support.
>>> The latest Featured Stock Update with an annotated graph appeared on 8/20/2012. Click here.
View all notes |
Alert me of new notes |
CANSLIM.net Company Profile |
SEC |
Zacks Reports |
StockTalk |
News |
Chart |
Request a new note
C
A N
S L
I M
|
NSM
-
NYSE
Nationstar Mtg Hldgs Inc
FINANCIAL SERVICES - Credit Services
|
$28.23
|
-0.55
-1.91% |
$29.17
|
935,201
117.74% of 50 DAV
50 DAV is 794,300
|
$30.07
-6.12%
|
8/29/2012
|
$27.96
|
PP = $28.85
|
|
MB = $30.29
|
Most Recent Note - 9/13/2012 5:17:14 PM
Y - Best-ever close today by just 2 cents with its gain on average volume. Volume-driven gains above the pivot point cited may clinch a new (or add-on) technical buy signal.
>>> The latest Featured Stock Update with an annotated graph appeared on 9/7/2012. Click here.
View all notes |
Alert me of new notes |
CANSLIM.net Company Profile |
SEC |
Zacks Reports |
StockTalk |
News |
Chart |
Request a new note
C
A N
S L
I M
|
Symbol/Exchange
Company Name
Industry Group |
PRICE |
CHANGE
(%Change) |
Day High |
Volume
(% DAV)
(% 50 day avg vol) |
52 Wk Hi
% From Hi |
Featured
Date |
Price
Featured |
Pivot Featured |
|
Max Buy |
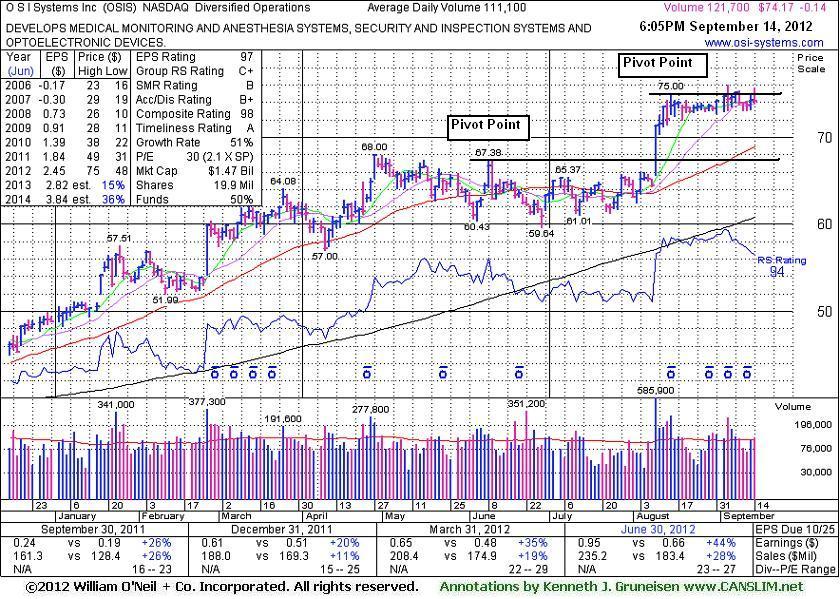
OSIS
-
NASDAQ
O S I Systems Inc
ELECTRONICS - Semiconductor Equipment and Mate
|
$74.17
|
-0.14
-0.19% |
$75.73
|
141,630
127.48% of 50 DAV
50 DAV is 111,100
|
$75.99
-2.40%
|
9/5/2012
|
$74.39
|
PP = $75.10
|
|
MB = $78.86
|
Most Recent Note - 9/14/2012 6:26:03 PM
Y - Encountered mild distributional pressure recently. Subsequent volume-driven gains for a close above its pivot point may clinch a new (or add-on) technical buy signal. Prior highs in the $67-68 area define initial support to watch on pullbacks. See the latest FSU analysis for more details and a new annotated graph.
>>> The latest Featured Stock Update with an annotated graph appeared on 9/14/2012. Click here.
View all notes |
Alert me of new notes |
CANSLIM.net Company Profile |
SEC |
Zacks Reports |
StockTalk |
News |
Chart |
Request a new note
C
A N
S L
I M
|
RNF
-
NYSE
Rentech Nitrogen Ptnr Lp
CHEMICALS - Agricultural Chemicals
|
$37.00
|
+1.36
3.82% |
$37.44
|
417,712
96.89% of 50 DAV
50 DAV is 431,100
|
$35.74
3.53%
|
7/27/2012
|
$29.58
|
PP = $30.60
|
|
MB = $32.13
|
Most Recent Note - 9/14/2012 4:05:47 PM
G - Hit another new 52-week high today with its 6th consecutive gain. Extended from its prior base with near-term support at its 50 DMA line.
>>> The latest Featured Stock Update with an annotated graph appeared on 8/31/2012. Click here.
View all notes |
Alert me of new notes |
CANSLIM.net Company Profile |
SEC |
Zacks Reports |
StockTalk |
News |
Chart |
Request a new note
C
A N
S L
I M
|
SWI
-
NYSE
Solarwinds Inc
COMPUTER SOFTWARE and SERVICES - Application Software
|
$59.70
|
+1.23
2.10% |
$60.95
|
938,373
81.76% of 50 DAV
50 DAV is 1,147,700
|
$60.25
-0.91%
|
7/25/2012
|
$47.82
|
PP = $47.89
|
|
MB = $50.28
|
Most Recent Note - 9/12/2012 4:55:05 PM
G - Volume totals have been cooling while holding its ground near its all-time high. Its 50 DMA line defines important chart support to watch on pullbacks.
>>> The latest Featured Stock Update with an annotated graph appeared on 8/29/2012. Click here.
View all notes |
Alert me of new notes |
CANSLIM.net Company Profile |
SEC |
Zacks Reports |
StockTalk |
News |
Chart |
Request a new note
C
A N
S L
I M
|
TDG
-
NYSE
Transdigm Group Inc
AEROSPACE/DEFENSE - Aerospace/Defense Products and; Services
|
$145.61
|
+2.51
1.75% |
$146.21
|
324,533
89.90% of 50 DAV
50 DAV is 361,000
|
$144.21
0.97%
|
8/16/2012
|
$132.23
|
PP = $136.44
|
|
MB = $143.26
|
Most Recent Note - 9/12/2012 4:56:19 PM
G - Hovering near its all-time high recently with volume totals cooling. Prior high near $136 defines near-term chart support to watch on pullbacks.
>>> The latest Featured Stock Update with an annotated graph appeared on 8/17/2012. Click here.
View all notes |
Alert me of new notes |
CANSLIM.net Company Profile |
SEC |
Zacks Reports |
StockTalk |
News |
Chart |
Request a new note
C
A N
S L
I M
|
ULTA
-
NASDAQ
Ulta Salon Cosm & Frag
SPECIALTY RETAIL - Specialty Retail, Other
|
$100.87
|
+0.71
0.71% |
$102.40
|
994,773
125.56% of 50 DAV
50 DAV is 792,300
|
$103.52
-2.56%
|
9/4/2012
|
$93.17
|
PP = $98.52
|
|
MB = $103.45
|
Most Recent Note - 9/12/2012 4:59:03 PM
Y - Quietly consolidating near its 52-week high, above its pivot point since the considerable 9/07/12 gap up gain triggered a technical buy signal. Reported earnings +42% on +22% sales revenues for the quarter ended July 31, 2012 versus the year ago period.
>>> The latest Featured Stock Update with an annotated graph appeared on 9/4/2012. Click here.
View all notes |
Alert me of new notes |
CANSLIM.net Company Profile |
SEC |
Zacks Reports |
StockTalk |
News |
Chart |
Request a new note
C
A N
S L
I M
|
Symbol/Exchange
Company Name
Industry Group |
PRICE |
CHANGE
(%Change) |
Day High |
Volume
(% DAV)
(% 50 day avg vol) |
52 Wk Hi
% From Hi |
Featured
Date |
Price
Featured |
Pivot Featured |
|
Max Buy |
ULTI
-
NASDAQ
Ultimate Software Group
INTERNET - Internet Software and Services
|
$100.41
|
+2.33
2.38% |
$100.49
|
230,086
142.20% of 50 DAV
50 DAV is 161,800
|
$106.40
-5.63%
|
8/27/2012
|
$98.36
|
PP = $99.19
|
|
MB = $104.15
|
Most Recent Note - 9/14/2012 4:33:18 PM
Y - Today's gain broke a streak of 5 consecutive losses while retreating from its all-time high. Prior chart highs define initial support to watch above its 50 DMA line.
>>> The latest Featured Stock Update with an annotated graph appeared on 8/27/2012. Click here.
View all notes |
Alert me of new notes |
CANSLIM.net Company Profile |
SEC |
Zacks Reports |
StockTalk |
News |
Chart |
Request a new note
C
A N
S L
I M
|
VSI
-
NYSE
Vitamin Shoppe Inc
SPECIALTY RETAIL - Specialty Retail, Other
|
$58.05
|
+0.15
0.26% |
$58.66
|
221,227
58.73% of 50 DAV
50 DAV is 376,700
|
$61.83
-6.11%
|
6/29/2012
|
$54.93
|
PP = $55.03
|
|
MB = $57.78
|
Most Recent Note - 9/14/2012 4:35:23 PM
G - Quiet gain today on lighter volume halted a streak of 4 consecutive losses. Prior lows near $52 define important chart support below its 50 DMA line.
>>> The latest Featured Stock Update with an annotated graph appeared on 9/10/2012. Click here.
View all notes |
Alert me of new notes |
CANSLIM.net Company Profile |
SEC |
Zacks Reports |
StockTalk |
News |
Chart |
Request a new note
C
A N
S L
I M
|
WPI
-
NYSE
Watson Pharmaceuticals
DRUGS - Drugs - Generic
|
$81.86
|
-1.04
-1.25% |
$83.20
|
1,108,897
93.73% of 50 DAV
50 DAV is 1,183,100
|
$84.02
-2.57%
|
8/24/2012
|
$82.90
|
PP = $81.10
|
|
MB = $85.16
|
Most Recent Note - 9/13/2012 4:59:18 PM
Y - Posted a small gain today with near average volume. Still holding its ground in a tight range near its 52-week high since triggering a technical buy signal on 8/24/12 when highlighted in the mid-day report with a gap up gain backed by above average volume. Prior highs in the $81 area define initial support to watch on pullbacks.
>>> The latest Featured Stock Update with an annotated graph appeared on 8/28/2012. Click here.
View all notes |
Alert me of new notes |
CANSLIM.net Company Profile |
SEC |
Zacks Reports |
StockTalk |
News |
Chart |
Request a new note
C
A N
S L
I M
|