***Last / Change / Volume data in this table is the closing quote data***
Symbol/Exchange
Company Name
Industry Group |
PRICE |
CHANGE
(%Change) |
Day High |
Volume
(% DAV)
(% 50 day avg vol) |
52 Wk Hi
% From Hi |
Featured
Date |
Price
Featured |
Pivot Featured |
|
Max Buy |
ABV
-
NYSE
Comp De Bebidas Adr
FOOD and BEVERAGE - Beverages - Brewers
|
$118.95
|
+3.00
2.59% |
$119.52
|
618,470
97.94% of 50 DAV
50 DAV is 631,500
|
$116.76
1.88%
|
6/29/2010
|
$104.74
|
PP = $109.33
|
|
MB = $114.80
|
 Most Recent Note - 9/14/2010 2:29:44 PM
G - This Brazil-based beverage firm has rallied to another new all-time high today with its 6th consecutive gain on near average or light volume. Prior highs in the $111-112 area define support above its 50 DMA line.
>>> The latest Featured Stock Update with an annotated graph appeared on 8/18/2010. Click here.
View all notes |
Alert me of new notes |
CANSLIM.net Company Profile |
SEC |
Zacks Reports |
StockTalk |
News |
Chart |
Request a new note
C
A N
S L
I M


|
ARUN
-
NASDAQ
Aruba Networks Inc
COMPUTER HARDWARE - Networking andamp; Communication Dev
|
$20.00
|
-0.27
-1.33% |
$20.48
|
2,364,540
129.75% of 50 DAV
50 DAV is 1,822,400
|
$20.44
-2.15%
|
8/30/2010
|
$18.12
|
PP = $18.51
|
|
MB = $19.44
|
Most Recent Note - 9/13/2010 12:38:55 PM
G - Hitting yet another new 52-week high after gapping up today, getting more extended from its latest base. Prior highs near $18 define chart support to watch.
>>> The latest Featured Stock Update with an annotated graph appeared on 9/2/2010. Click here.
View all notes |
Alert me of new notes |
CANSLIM.net Company Profile |
SEC |
Zacks Reports |
StockTalk |
News |
Chart |
Request a new note
C
A N
S L
I M
|
BIDU
-
NASDAQ
Baidu Inc Ads
INTERNET - Internet Information Providers
|
$86.33
|
+0.07
0.08% |
$87.40
|
6,563,132
67.19% of 50 DAV
50 DAV is 9,768,100
|
$88.32
-2.25%
|
7/14/2010
|
$75.03
|
PP = $78.59
|
|
MB = $82.52
|
Most Recent Note - 9/13/2010 5:20:05 PM
Y - Gapped up today for a gain with near average volume. Its recent rally from its 10-week average may be considered a secondary buy point. However, it may be considered "late-stage" and riskier than fresh technical breakouts.
>>> The latest Featured Stock Update with an annotated graph appeared on 8/13/2010. Click here.
View all notes |
Alert me of new notes |
CANSLIM.net Company Profile |
SEC |
Zacks Reports |
StockTalk |
News |
Chart |
Request a new note
C
A N
S L
I M
|
CACC
-
NASDAQ
Credit Acceptance Corp
FINANCIAL SERVICES - Credit Services
|
$60.49
|
+0.76
1.27% |
$60.91
|
87,691
180.43% of 50 DAV
50 DAV is 48,600
|
$61.41
-1.50%
|
7/29/2010
|
$52.04
|
PP = $54.07
|
|
MB = $56.77
|
Most Recent Note - 9/14/2010 12:36:22 PM
G - Gain today with above average volume has lifted it within -1.3% of its 52-week high. Volume has cooled in recent weeks while building a short flat base in a tight trading range. Its 50 DMA line and recent chart low coincide near $56, defining an important chart support level.
>>> The latest Featured Stock Update with an annotated graph appeared on 8/2/2010. Click here.
View all notes |
Alert me of new notes |
CANSLIM.net Company Profile |
SEC |
Zacks Reports |
StockTalk |
News |
Chart |
Request a new note
C
A N
S L
I M
|
CMG
-
NYSE
Chipotle Mexican Grill
LEISURE - Restaurants
|
$168.52
|
+0.15
0.09% |
$170.00
|
785,167
110.82% of 50 DAV
50 DAV is 708,500
|
$169.18
-0.39%
|
9/1/2010
|
$158.31
|
PP = $155.52
|
|
MB = $163.30
|
Most Recent Note - 9/10/2010 3:58:04 PM
G - Gain today with below average volume, closing above its "max buy" level, and its color code is changed to green again. Technically, it broke out on 9/01/10, rallying to multi-year highs with a considerable gain backed 2 times average volume.
>>> The latest Featured Stock Update with an annotated graph appeared on 9/1/2010. Click here.
View all notes |
Alert me of new notes |
CANSLIM.net Company Profile |
SEC |
Zacks Reports |
StockTalk |
News |
Chart |
Request a new note
C
A N
S L
I M
|
Symbol/Exchange
Company Name
Industry Group |
PRICE |
CHANGE
(%Change) |
Day High |
Volume
(% DAV)
(% 50 day avg vol) |
52 Wk Hi
% From Hi |
Featured
Date |
Price
Featured |
Pivot Featured |
|
Max Buy |
CRM
-
NYSE
Salesforce.Com Inc
INTERNET - Internet Software and Services
|
$117.78
|
-0.81
-0.68% |
$118.88
|
2,967,498
114.03% of 50 DAV
50 DAV is 2,602,300
|
$122.00
-3.46%
|
6/2/2010
|
$88.44
|
PP = $89.60
|
|
MB = $94.08
|
Most Recent Note - 9/9/2010 6:21:09 PM
G - Pulling back today after early gains for a new all-time high. It is extended from a sound base, not currently buyable under the investment system guidelines.
>>> The latest Featured Stock Update with an annotated graph appeared on 8/16/2010. Click here.
View all notes |
Alert me of new notes |
CANSLIM.net Company Profile |
SEC |
Zacks Reports |
StockTalk |
News |
Chart |
Request a new note
C
A N
S L
I M
|
EGO
-
NYSE
Eldorado Gold Corp
METALS and MINING - Gold
|
$19.85
|
+0.84
4.42% |
$20.15
|
7,187,481
175.53% of 50 DAV
50 DAV is 4,094,800
|
$20.06
-1.05%
|
8/19/2010
|
$18.25
|
PP = $19.17
|
|
MB = $20.13
|
Most Recent Note - 9/14/2010 12:51:16 PM
Y - Gapped up today, posting a solid gain with above average volume amid widespread strength and leadership in the group. Approaching its "max buy" level and 52-week high.
>>> The latest Featured Stock Update with an annotated graph appeared on 8/19/2010. Click here.
View all notes |
Alert me of new notes |
CANSLIM.net Company Profile |
SEC |
Zacks Reports |
StockTalk |
News |
Chart |
Request a new note
C
A N
S L
I M
|
FFIV
-
NASDAQ
F 5 Networks Inc
INTERNET - Internet Software and Services
|
$98.66
|
-0.21
-0.21% |
$100.17
|
1,798,365
108.34% of 50 DAV
50 DAV is 1,659,900
|
$99.72
-1.06%
|
6/16/2010
|
$74.50
|
PP = $74.10
|
|
MB = $77.81
|
Most Recent Note - 9/13/2010 3:47:38 PM
G - Considerable gain after gapping up today, hitting a new all-time high. Upward trendline connecting July-August lows defines an initial chart support level well above its 50 DMA line.
>>> The latest Featured Stock Update with an annotated graph appeared on 9/13/2010. Click here.
View all notes |
Alert me of new notes |
CANSLIM.net Company Profile |
SEC |
Zacks Reports |
StockTalk |
News |
Chart |
Request a new note
C
A N
S L
I M
|
FOSL
-
NASDAQ
Fossil Inc
CONSUMER DURABLES - Recreational Goods, Other
|
$51.49
|
+0.49
0.96% |
$51.94
|
788,643
102.31% of 50 DAV
50 DAV is 770,800
|
$51.34
0.29%
|
8/10/2010
|
$45.54
|
PP = $42.69
|
|
MB = $44.82
|
Most Recent Note - 9/14/2010 3:57:02 PM
G - Gain today with average volume for another new all-time high. Extended from any sound base after a recent streak of gains, its prior high in the $46 area defines support to watch.
>>> The latest Featured Stock Update with an annotated graph appeared on 8/11/2010. Click here.
View all notes |
Alert me of new notes |
CANSLIM.net Company Profile |
SEC |
Zacks Reports |
StockTalk |
News |
Chart |
Request a new note
C
A N
S L
I M
|
GMCR
-
NASDAQ
Green Mtn Coffee Roastrs
FOOD and BEVERAGE - Processed and Packaged Goods
|
$34.59
|
-0.65
-1.84% |
$35.15
|
2,107,107
90.85% of 50 DAV
50 DAV is 2,319,300
|
$35.94
-3.76%
|
8/17/2010
|
$33.62
|
PP = $33.30
|
|
MB = $34.97
|
Most Recent Note - 9/13/2010 12:53:35 PM
G - Gapped up again today and hit yet another new all-time high. Trading beyond its "max buy" level, its color code is changed to green.
>>> The latest Featured Stock Update with an annotated graph appeared on 8/17/2010. Click here.
View all notes |
Alert me of new notes |
CANSLIM.net Company Profile |
SEC |
Zacks Reports |
StockTalk |
News |
Chart |
Request a new note
C
A N
S L
I M
|
Symbol/Exchange
Company Name
Industry Group |
PRICE |
CHANGE
(%Change) |
Day High |
Volume
(% DAV)
(% 50 day avg vol) |
52 Wk Hi
% From Hi |
Featured
Date |
Price
Featured |
Pivot Featured |
|
Max Buy |
HS
-
NYSE
Healthspring Inc
HEALTH SERVICES - Health Care Plans
|
$22.87
|
+0.07
0.31% |
$23.22
|
910,333
146.71% of 50 DAV
50 DAV is 620,500
|
$23.47
-2.56%
|
8/27/2010
|
$19.91
|
PP = $19.75
|
|
MB = $20.74
|
Most Recent Note - 9/14/2010 5:22:22 PM
G - Holding its ground near its 52-week high and all-time high. Extended from its prior base, support to watch now is prior chart highs in the $19-20 area.
>>> The latest Featured Stock Update with an annotated graph appeared on 8/27/2010. Click here.
View all notes |
Alert me of new notes |
CANSLIM.net Company Profile |
SEC |
Zacks Reports |
StockTalk |
News |
Chart |
Request a new note
C
A N
S L
I M
|
IGTE
-
NASDAQ
Igate Corp
COMPUTER SOFTWARE and SERVICES - Information Technology Service
|
$18.49
|
-0.06
-0.32% |
$18.80
|
468,004
125.13% of 50 DAV
50 DAV is 374,000
|
$18.67
-0.96%
|
9/8/2010
|
$17.29
|
PP = $18.26
|
|
MB = $19.17
|
Most Recent Note - 9/14/2010 5:27:02 PM
Y - Held its ground today. Technically, its gain above its pivot point and strong close on 9/13/10 with +90% above average volume triggered a buy signal.
>>> The latest Featured Stock Update with an annotated graph appeared on 9/10/2010. Click here.
View all notes |
Alert me of new notes |
CANSLIM.net Company Profile |
SEC |
Zacks Reports |
StockTalk |
News |
Chart |
Request a new note
C
A N
S L
I M
|
MELI
-
NASDAQ
Mercadolibre Inc
INTERNET - Internet Software and; Services
|
$73.77
|
-0.81
-1.09% |
$74.45
|
633,787
73.63% of 50 DAV
50 DAV is 860,800
|
$74.78
-1.35%
|
5/13/2010
|
$54.21
|
PP = $55.85
|
|
MB = $58.64
|
Most Recent Note - 9/13/2010 5:08:44 PM
G - Gain today on average volume for another new high, getting more extended from a sound base. Prior highs in the $62 area and its 50 DMA line define chart support.
>>> The latest Featured Stock Update with an annotated graph appeared on 8/26/2010. Click here.
View all notes |
Alert me of new notes |
CANSLIM.net Company Profile |
SEC |
Zacks Reports |
StockTalk |
News |
Chart |
Request a new note
C
A N
S L
I M
|
MRX
-
NYSE
Medicis Pharmaceut Cl A
DRUGS - Biotechnology
|
$29.08
|
+0.47
1.64% |
$29.48
|
1,629,859
133.44% of 50 DAV
50 DAV is 1,221,400
|
$30.00
-3.07%
|
8/12/2010
|
$26.88
|
PP = $26.71
|
|
MB = $28.05
|
Most Recent Note - 9/14/2010 2:57:40 PM
G - Rising near its 52-week high with today's gain. Recently consolidating above prior highs in the $28 area that define an initial chart support level to watch.
>>> The latest Featured Stock Update with an annotated graph appeared on 8/12/2010. Click here.
View all notes |
Alert me of new notes |
CANSLIM.net Company Profile |
SEC |
Zacks Reports |
StockTalk |
News |
Chart |
Request a new note
C
A N
S L
I M
|
MWIV
-
NASDAQ
M W I Veterinary Supply
HEALTH SERVICES - Medical Instruments and; Supplies
|
$55.97
|
+1.96
3.63% |
$56.72
|
68,040
92.32% of 50 DAV
50 DAV is 73,700
|
$55.93
0.07%
|
7/29/2010
|
$52.05
|
PP = $52.09
|
|
MB = $54.69
|
Most Recent Note - 9/14/2010 3:54:42 PM
G - Today's gain without great volume conviction has it trading above its "max buy" level and the color code is changed to green. Its 50 DMA line defines important chart support.
>>> The latest Featured Stock Update with an annotated graph appeared on 9/7/2010. Click here.
View all notes |
Alert me of new notes |
CANSLIM.net Company Profile |
SEC |
Zacks Reports |
StockTalk |
News |
Chart |
Request a new note
C
A N
S L
I M
|
Symbol/Exchange
Company Name
Industry Group |
PRICE |
CHANGE
(%Change) |
Day High |
Volume
(% DAV)
(% 50 day avg vol) |
52 Wk Hi
% From Hi |
Featured
Date |
Price
Featured |
Pivot Featured |
|
Max Buy |
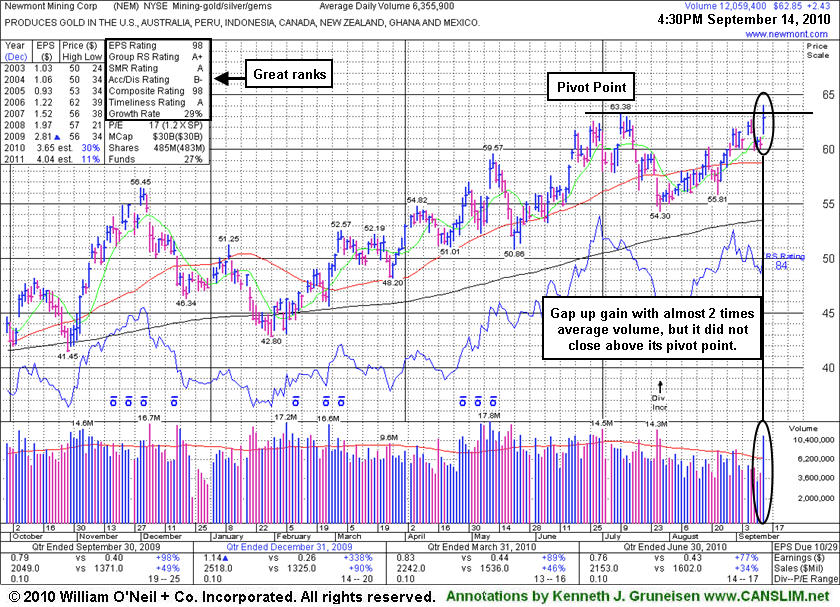
NEM
-
NYSE
Newmont Mining Corp
METALS and MINING - Gold
|
$62.85
|
+2.43
4.02% |
$64.03
|
12,072,385
183.98% of 50 DAV
50 DAV is 6,561,700
|
$63.38
-0.84%
|
8/31/2010
|
$61.32
|
PP = $63.48
|
|
MB = $66.65
|
Most Recent Note - 9/14/2010 1:13:37 PM
Y - Gapped up today, rallying with above average volume for a considerable gain above its pivot point. It hit a new 52-week high, and no overhead supply remains to hinder its progress. Leadership in the Mining - Gold/Silver/Gems group (L criteria) is a nice reassurance.
>>> The latest Featured Stock Update with an annotated graph appeared on 9/14/2010. Click here.
View all notes |
Alert me of new notes |
CANSLIM.net Company Profile |
SEC |
Zacks Reports |
StockTalk |
News |
Chart |
Request a new note
C
A N
S L
I M
|
NEOG
-
NASDAQ
Neogen Corp
DRUGS - Diagnostic Substances
|
$31.72
|
-0.15
-0.47% |
$32.21
|
49,037
51.62% of 50 DAV
50 DAV is 95,000
|
$32.42
-2.16%
|
9/1/2010
|
$30.79
|
PP = $30.49
|
|
MB = $32.01
|
Most Recent Note - 9/13/2010 5:13:17 PM
Y- Gain today with light volume for its second best close ever. Technically, its 9/01/10 gain above the new pivot point cited triggered a buy signal after an orderly 5-week base-on-base pattern.
>>> The latest Featured Stock Update with an annotated graph appeared on 8/20/2010. Click here.
View all notes |
Alert me of new notes |
CANSLIM.net Company Profile |
SEC |
Zacks Reports |
StockTalk |
News |
Chart |
Request a new note
C
A N
S L
I M
|
NFLX
-
NASDAQ
Netflix Inc
SPECIALTY RETAIL - Music and Video Stores
|
$146.65
|
-1.29
-0.87% |
$148.85
|
2,915,619
61.75% of 50 DAV
50 DAV is 4,721,600
|
$149.95
-2.20%
|
8/10/2010
|
$124.05
|
PP = $124.00
|
|
MB = $130.20
|
Most Recent Note - 9/14/2010 4:16:00 PM
G - Hovering at its all-time high with volume totals cooling for the past week. No resistance remains to hinder its progress.
>>> The latest Featured Stock Update with an annotated graph appeared on 8/10/2010. Click here.
View all notes |
Alert me of new notes |
CANSLIM.net Company Profile |
SEC |
Zacks Reports |
StockTalk |
News |
Chart |
Request a new note
C
A N
S L
I M
|
NTAP
-
NASDAQ
Netapp Inc
COMPUTER HARDWARE - Data Storage Devices
|
$48.12
|
+0.02
0.04% |
$49.06
|
10,998,299
149.28% of 50 DAV
50 DAV is 7,367,800
|
$48.22
-0.21%
|
9/8/2010
|
$46.98
|
PP = $44.99
|
|
MB = $47.24
|
Most Recent Note - 9/14/2010 5:20:39 PM
G - Hit another new 52-week high today but closed in the lower half of its intra-day range. Support to watch is at prior chart highs near its latest pivot point.
>>> The latest Featured Stock Update with an annotated graph appeared on 9/8/2010. Click here.
View all notes |
Alert me of new notes |
CANSLIM.net Company Profile |
SEC |
Zacks Reports |
StockTalk |
News |
Chart |
Request a new note
C
A N
S L
I M
|
PAY
-
NYSE
Verifone Systems Inc
COMPUTER HARDWARE - Transaction Automation Systems
|
$27.71
|
+0.46
1.69% |
$28.00
|
1,466,859
117.88% of 50 DAV
50 DAV is 1,244,400
|
$27.52
0.69%
|
8/25/2010
|
$24.30
|
PP = $23.74
|
|
MB = $24.93
|
Most Recent Note - 9/13/2010 5:15:21 PM
G - Gapped up today a posted a gain with above average volume for a new 52-week high, getting more extended from a sound base.
>>> The latest Featured Stock Update with an annotated graph appeared on 8/30/2010. Click here.
View all notes |
Alert me of new notes |
CANSLIM.net Company Profile |
SEC |
Zacks Reports |
StockTalk |
News |
Chart |
Request a new note
C
A N
S L
I M
|
Symbol/Exchange
Company Name
Industry Group |
PRICE |
CHANGE
(%Change) |
Day High |
Volume
(% DAV)
(% 50 day avg vol) |
52 Wk Hi
% From Hi |
Featured
Date |
Price
Featured |
Pivot Featured |
|
Max Buy |
ROVI
-
NASDAQ
Rovi Corp
COMPUTER SOFTWARE andamp; SERVICES - Security Software andamp; Services
|
$44.25
|
-0.54
-1.21% |
$45.77
|
2,155,133
188.72% of 50 DAV
50 DAV is 1,142,000
|
$45.47
-2.68%
|
8/31/2010
|
$43.31
|
PP = $45.06
|
|
MB = $47.31
|
Most Recent Note - 9/14/2010 1:15:51 PM
Y - Technically, it has not broken out from the recently noted base-on-base type pattern. It touched another new 52-week high today. Its 50 DMA line defines near-term support.
>>> The latest Featured Stock Update with an annotated graph appeared on 8/24/2010. Click here.
View all notes |
Alert me of new notes |
CANSLIM.net Company Profile |
SEC |
Zacks Reports |
StockTalk |
News |
Chart |
Request a new note
C
A N
S L
I M
|
SHOO
-
NASDAQ
Steven Madden Limited
CONSUMER NON-DURABLES - Textile - Apparel Footwear
|
$38.02
|
-0.26
-0.68% |
$38.25
|
434,899
103.03% of 50 DAV
50 DAV is 422,100
|
$40.98
-7.22%
|
8/5/2010
|
$39.55
|
PP = $41.08
|
|
MB = $43.13
|
Most Recent Note - 9/13/2010 10:53:40 AM
Y - Gapped up today. Volume totals have cooled while recently consolidating. Gains above the pivot point previously cited are still needed to confirm a proper technical buy signal.
>>> The latest Featured Stock Update with an annotated graph appeared on 8/5/2010. Click here.
View all notes |
Alert me of new notes |
CANSLIM.net Company Profile |
SEC |
Zacks Reports |
StockTalk |
News |
Chart |
Request a new note
C
A N
S L
I M
|
SLW
-
NYSE
Silver Wheaton Corp
METALS and; MINING - Silver
|
$24.74
|
+0.95
3.99% |
$25.34
|
9,795,928
208.59% of 50 DAV
50 DAV is 4,696,200
|
$24.72
0.08%
|
8/25/2010
|
$21.40
|
PP = $21.99
|
|
MB = $23.09
|
Most Recent Note - 9/14/2010 1:19:37 PM
G - Gapped up today, posting a considerable gain with above average volume for a new all-time high. Rallying amid strong gains in the group, but getting even more extended from a sound base. The previous highs in the $21 area are now a support level to watch.
>>> The latest Featured Stock Update with an annotated graph appeared on 8/25/2010. Click here.
View all notes |
Alert me of new notes |
CANSLIM.net Company Profile |
SEC |
Zacks Reports |
StockTalk |
News |
Chart |
Request a new note
C
A N
S L
I M
|
UA
-
NYSE
Under Armour Inc Cl A
CONSUMER NON-DURABLES - Textile - Apparel Clothing
|
$42.21
|
+1.30
3.18% |
$42.58
|
1,672,919
242.84% of 50 DAV
50 DAV is 688,900
|
$41.00
2.95%
|
9/9/2010
|
$39.99
|
PP = $40.10
|
|
MB = $42.11
|
Most Recent Note - 9/14/2010 11:05:02 AM
Y - Today it hit another new 52-week high with its 10th consecutive gain since finding recent support near its 50 DMA line.
>>> The latest Featured Stock Update with an annotated graph appeared on 9/9/2010. Click here.
View all notes |
Alert me of new notes |
CANSLIM.net Company Profile |
SEC |
Zacks Reports |
StockTalk |
News |
Chart |
Request a new note
C
A N
S L
I M
|
ULTA
-
NASDAQ
Ulta Salon Cosm & Frag
SPECIALTY RETAIL - Specialty Retail, Other
|
$28.59
|
+0.94
3.40% |
$29.25
|
1,039,288
169.21% of 50 DAV
50 DAV is 614,200
|
$27.70
3.21%
|
9/3/2010
|
$26.36
|
PP = $25.89
|
|
MB = $27.18
|
Most Recent Note - 9/14/2010 1:23:52 PM
G - Considerable gain today, hitting another new 52-week high. Its color code was changed to green after getting extended from its latest base.
>>> The latest Featured Stock Update with an annotated graph appeared on 9/3/2010. Click here.
View all notes |
Alert me of new notes |
CANSLIM.net Company Profile |
SEC |
Zacks Reports |
StockTalk |
News |
Chart |
Request a new note
C
A N
S L
I M
|
Symbol/Exchange
Company Name
Industry Group |
PRICE |
CHANGE
(%Change) |
Day High |
Volume
(% DAV)
(% 50 day avg vol) |
52 Wk Hi
% From Hi |
Featured
Date |
Price
Featured |
Pivot Featured |
|
Max Buy |
VIT
-
NYSE
Vanceinfo Tech Inc Ads
COMPUTER SOFTWARE and SERVICES - Business Software and Services
|
$29.13
|
+0.15
0.52% |
$29.71
|
535,808
98.88% of 50 DAV
50 DAV is 541,900
|
$30.50
-4.49%
|
7/8/2010
|
$25.20
|
PP = $26.58
|
|
MB = $27.91
|
Most Recent Note - 9/13/2010 5:24:17 PM
G - Pulling back with higher volume today and closed near the session low, enduring mild distributional pressure.
>>> The latest Featured Stock Update with an annotated graph appeared on 8/31/2010. Click here.
View all notes |
Alert me of new notes |
CANSLIM.net Company Profile |
SEC |
Zacks Reports |
StockTalk |
News |
Chart |
Request a new note
C
A N
S L
I M
|
WCRX
-
NASDAQ
Warner Chilcott Plc
DRUGS - Drug Manufacturers - Other
|
$21.94
|
-0.05
-0.23% |
$22.09
|
1,377,858
58.48% of 50 DAV
50 DAV is 2,356,100
|
$30.57
-28.23%
|
8/23/2010
|
$29.54
|
PP = $29.34
|
|
MB = $30.81
|
Most Recent Note - 9/9/2010 6:53:33 PM
Y - Volume was heavy today as it rallied to a new all-time high. Price data will be adjusted to account for a "quirky" dividend effective as of today's trading. WCRX was featured in yellow in the mid-day report on 8/23/10 rising from a cup shaped base.
>>> The latest Featured Stock Update with an annotated graph appeared on 8/23/2010. Click here.
View all notes |
Alert me of new notes |
CANSLIM.net Company Profile |
SEC |
Zacks Reports |
StockTalk |
News |
Chart |
Request a new note
C
A N
S L
I M
|