You are not logged in.
This means you
CAN ONLY VIEW reports that were published prior to Monday, March 10, 2025.
You
MUST UPGRADE YOUR MEMBERSHIP if you want to see any current reports.
AFTER MARKET UPDATE - MONDAY, SEPTEMBER 14TH, 2009
Previous After Market Report Next After Market Report >>>
|
|
|
|
DOW |
+21.39 |
9,626.80 |
+0.22% |
|
Volume |
1,211,899,200 |
-6% |
|
Volume |
2,192,655,520 |
-6% |
|
NASDAQ |
+10.88 |
2,091.78 |
+0.52% |
|
Advancers |
2,003 |
65% |
|
Advancers |
1,653 |
58% |
|
S&P 500 |
+6.61 |
1,049.34 |
+0.63% |
|
Decliners |
965 |
31% |
|
Decliners |
1,069 |
38% |
|
Russell 2000 |
+6.44 |
600.03 |
+1.08% |
|
52 Wk Highs |
145 |
|
|
52 Wk Highs |
57 |
|
|
S&P 600 |
+2.59 |
314.55 |
+0.83% |
|
52 Wk Lows |
1 |
|
|
52 Wk Lows |
3 |
|
|
 |
Indices Overcome Early Losses to Post Gains on Lighter Volume
Adam Sarhan, Contributing Writer,
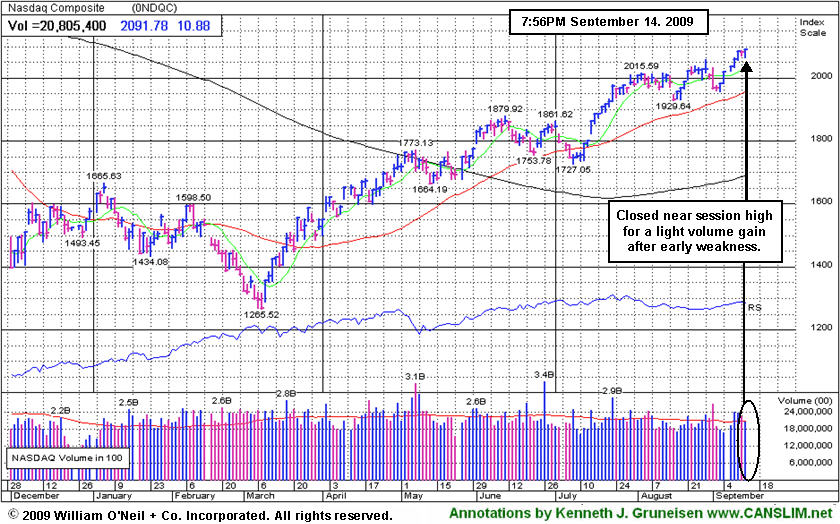
The major averages fluctuated between positive and negative territory, but the relatively quiet day on Wall Street ended on a high note for all of the major averages. Volume was reported lighter than Friday's session, which showed that institutional investors were not especially decisive behind their buying efforts as stocks rose. Advancers led decliners by a 2-to-1 ratio on the NYSE and by a 3-to-2 ratio on the Nasdaq exchange. There were only 13 high-ranked companies from the CANSLIM.net Leaders List that made a new 52-week high and appeared on the CANSLIM.net BreakOuts Page, half the total of 26 issues that appeared on the prior session. New 52-week highs still outnumbered new 52-week lows on both exchanges while new lows were in the single digits yet again.
Monday marked the anniversary of Lehman Brothers' infamous bankruptcy which triggered last year's violent stock market sell off and claimed scores of large financial institutions. The multi-billion dollar questions is: Was it a good idea to let Lehman fail? There is no doubt that this will be a question that will be debated for decades as investors continue to argue various points. President Obama spoke on Wall Street and reviewed everything that happened since the financial crisis began and outlined his plans for a massive financial overhaul. In the past, Obama has called on Congress to pass a major restructuring for how financial institutions are regulated. Many believe that the major problem that led to the credit crisis and was a massive deregulation of the financial system under the Bush administration. However, we believe that the primary reason why so many banks failed has been due to their reckless approach to risk.
There are countless studies which show that one of the most important components to being a successful investor the proper adherence to a strong money management system. That is why one of the most important components of this powerful investment system is to always limit your losses, no excuses. If there is any one factor that will destroy a portfolio it is to let your losses grow. The key factors that will lead to positive results in the market are limiting your losses and letting your winners run. The way that this rule is put in practice is by knowing when to sell. Investors are best served when they buy based on the combination of strong fundamentals and technicals, and then sell based on the technicals. Fundamentals often tend to lag a stock's technical condition, and deteriorating fundamentals later come to light later to help explain weak technical chart action after the fact.
PICTURED: The Nasdaq Composite ended at a new 2009 high close, overcoming early weakness to post a gain on lighter volume.
|
|
|
 |
Biotech and Other Indices Rise to 2009 Best Closes
Kenneth J. Gruneisen - Passed the CAN SLIM® Master's Exam
The Broker/Dealer Index ($XBD +2.11%) rallied to new 2009 highs as it and the Bank Index ($BKX +0.81%) were among Monday's influential gaining groups. A modest gain from the Retail Index ($RLX +0.48%) also helped the market's positive bias. Last Friday's IGW section showed charts of the influential XBD and RLX, each perched at 2009 highs (read here).
The Biotechnology Index ($BTK +2.43%) was a standout gainer on Monday, meanwhile the Healthcare Index ($HMO +0.39%) just edged higher. Energy shares rose, lifting the Oil Services Index ($OSX +1.04%) to a better gain than the modest improvement shown by the Integrated Oil Index ($XOI +0.30%). The Gold & Silver Index ($XAU -1.22%) lost ground, making it a laggard on the session. The Networking Index ($NWX -0.40%) also posted a small loss, lagging behind the modest gains from the Internet Index ($IIX +0.27%) and the Semiconductor Index ($SOX +0.45%).
Charts courtesy www.stockcharts.com
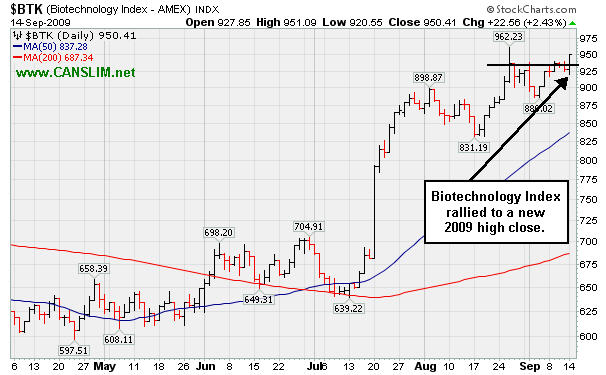
PICTURED: The Biotechnology Index ($BTK +2.43%) rallied to a new 2009 high close.
| Oil Services |
$OSX |
187.40 |
+1.93 |
+1.04% |
+54.38% |
| Healthcare |
$HMO |
1,287.29 |
+4.98 |
+0.39% |
+34.07% |
| Integrated Oil |
$XOI |
1,023.91 |
+3.08 |
+0.30% |
+4.51% |
| Semiconductor |
$SOX |
322.70 |
+1.46 |
+0.45% |
+52.10% |
| Networking |
$NWX |
228.04 |
-0.91 |
-0.40% |
+58.48% |
| Internet |
$IIX |
212.77 |
+0.57 |
+0.27% |
+59.06% |
| Broker/Dealer |
$XBD |
117.07 |
+2.42 |
+2.11% |
+51.12% |
| Retail |
$RLX |
374.16 |
+1.79 |
+0.48% |
+33.98% |
| Gold & Silver |
$XAU |
167.02 |
-2.06 |
-1.22% |
+34.86% |
| Bank |
$BKX |
45.79 |
+0.37 |
+0.81% |
+3.32% |
| Biotech |
$BTK |
950.39 |
+22.54 |
+2.43% |
+46.85% |
|
|
|
 |
Volume Totals Drying Up While Consolidating Above Support
Kenneth J. Gruneisen - Passed the CAN SLIM® Master's Exam
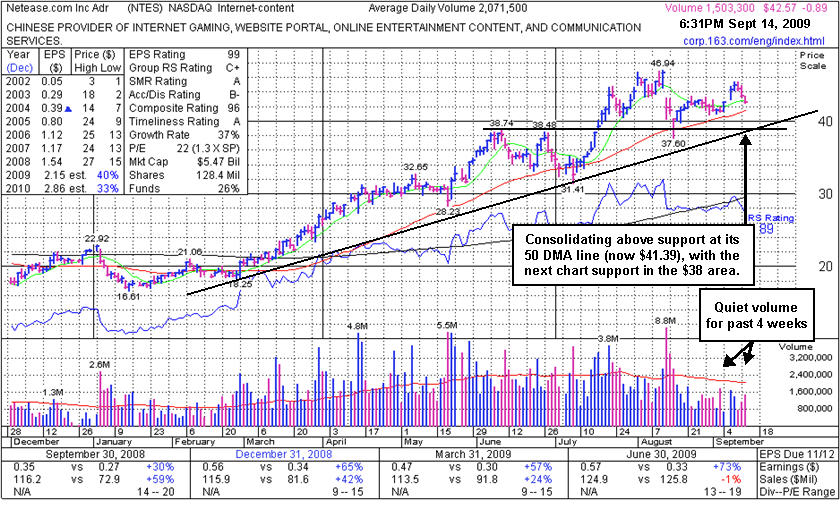
Netease.com Inc (NTES -$0.89 or -2.09% to $42.57) has seen volume totals drying up while recently consolidating in a healthy fashion above support at its 50-day moving average (DMA) line. However, gains with heavy volume really have not shown up since mid-July, revealing a lack of buying demand from the institutional crowd. Meanwhile the light volume totals of late may also be seen as a somewhat encouraging sign that distributional pressure has subsided since shortly after it was shown in this section on 8/13/09 (when 8.7 million shares traded) under the headline "Gap Down Loss on Heavy Volume Triggers Sell Signal" (read here). The market's negative reaction was due to the fact that sales revenues for the quarter ended June 30, 2009 were reported at -1% versus the year ago period, which was a continuation of its steady sequential deceleration in sales revenues increases from +79%, +59%, +42% in the Jun, Sep, Dec '08 comparisons and +24% in Mar '09.
Gaps are often a dead giveaway that large institutional investors (the I criteria) are rushing in one direction, and it was described as "an especially ominous sign, after a considerable run up, when a stock experiences its biggest point loss on the highest volume ever." However, NTES has made an admirable stand above important chart support since the prior review in this FSU section. Below its 50 DMA line, the nearby chart support at prior highs and a longer-term upward trendline help to define an important support level in the $38 area where any violation would raise more serious concerns and trigger more worrisome technical sell signals. The high-ranked Internet - Content firm traded up as much as +74.8% following its appearance in the April 2009 issue of the monthly newsletter, CANSLIM.net News (read here).
|
|
|
Color Codes Explained :
Y - Better candidates highlighted by our
staff of experts.
G - Previously featured
in past reports as yellow but may no longer be buyable under the
guidelines.
***Last / Change / Volume quote data in this table corresponds with the timestamp on the note***
Symbol/Exchange
Company Name
Industry Group |
Last |
Chg. |
Vol
% DAV |
Date Featured |
Price Featured |
Latest Pivot Point
Featured |
Status |
| Latest Max Buy Price |
ARO
- NYSE
Aeropostale Inc
RETAIL - Apparel Stores
|
$42.69
|
+0.63
|
1,167,796
39% DAV
2,972,200
|
8/21/2009
(Date
Featured) |
$39.21
(Price
Featured) |
PP = $38.84 |
G |
| MB = $40.78 |
Most Recent Note - 9/14/2009 5:52:49 PM
G - Gain today with very light volume lifted this high-ranked leader in the Retail - Clothing/shoe group to a new high close. It found support at prior highs in the $38 area on a healthy pullback after first triggering a technical buy signal when featured in yellow in the 8/21/09 Mid-Day BreakOuts Report (read here).
>>> The latest Featured Stock Update with an annotated graph appeared on 9/2/2009. click here.
|
|
C
A
S
I |
News |
Chart |
SEC
View all notes Alert
me of new notes
Company
Profile
|
ARST
-
|
$21.90
|
-0.30
|
587,441
80% DAV
732,200
|
9/1/2009
(Date
Featured) |
$19.91
(Price
Featured) |
PP = $20.90 |
G |
| MB = $21.95 |
Most Recent Note - 9/14/2009 5:54:58 PM
G - Today was a 4th consecutive loss on light volume while hovering near all-time highs, stubbornly holding its gains, with volume drying up since its considerable gain on 9/04/09 with nearly 3 times average volume triggered a technical buy signal. Featured in yellow in the 9/01/09 Mid-Day BreakOuts Report with an annotated daily graph (read here) and it was also featured with more detailed analysis in the September 2009 CANSLIM.net News with an annotated weekly graph (read here).
>>> The latest Featured Stock Update with an annotated graph appeared on 9/4/2009. click here.
|
|
C
A
S
I |
News |
Chart |
SEC
View all notes Alert
me of new notes
Company
Profile
|
BIDU
- NASDAQ
Baidu Inc Ads
INTERNET - Internet Information Providers
|
$379.50
|
+9.55
|
1,768,057
100% DAV
1,768,400
|
9/8/2009
(Date
Featured) |
$351.80
(Price
Featured) |
PP = $368.59 |
Y |
| MB = $387.02 |
Most Recent Note - 9/14/2009 5:59:18 PM
Y - Edged to a new high close further above its pivot point today, yet volume has been under the minimum (+50% above average volume) threshold needed to trigger a convincing and proper technical buy signal under the investment system guidelines. BIDU was featured again in yellow in the 9/08/09 Mid-Day BreakOuts Report (read here). This high-ranked leader has a solid quarterly and annual earnings history, but a clear sequential deceleration in its increases is a concern. Based on weak technical action it was dropped from the Featured Stocks list on 1/11/08, when it was trading at $329, and it has rebounded very impressively from its January 2009 lows near $100.
>>> The latest Featured Stock Update with an annotated graph appeared on 9/8/2009. click here.
|
|
C
A
S
I |
News |
Chart |
SEC
View all notes Alert
me of new notes
Company
Profile
|
CRM
- NYSE
Salesforce.com Inc
INTERNET - Internet Software & Services
|
$57.47
|
-0.45
|
1,546,392
79% DAV
1,945,600
|
8/16/2009
(Date
Featured) |
$47.12
(Price
Featured) |
PP = $45.59 |
G |
| MB = $47.87 |
Most Recent Note - 9/14/2009 6:18:57 PM
G - Paused today with a small loss on light volume after 7 consecutive gains on ever-increasing volume to new 2009 highs. Prior highs near $55 are an intial support level to watch on pullbacks, while it is now extended from a sound base. It recently rose from a "3-weeks tight" type pattern following its "breakaway gap" on 8/21/09 with more than 5 times average volume. Detailed analysis and an annotated graph were included when recently featured in the 8/16/09 Stock Bulletin (read here).
>>> The latest Featured Stock Update with an annotated graph appeared on 8/31/2009. click here.
|
|
C
A
S
I |
News |
Chart |
SEC
View all notes Alert
me of new notes
Company
Profile
|
EBIX
- NASDAQ
Ebix Inc
COMPUTER SOFTWARE & SERVICES - Business Software & Services
|
$51.03
|
-1.47
|
96,067
90% DAV
106,600
|
8/28/2009
(Date
Featured) |
$45.86
(Price
Featured) |
PP = $45.35 |
G |
| MB = $47.62 |
Most Recent Note - 9/14/2009 6:24:59 PM
G - Loss today on light volume. It is too extended from an ideal buy point within the investment system guidelines, and last week included another whipsaw-like shakeout that briefly tested support, like in mid-August. It has a small supply of only 6.62 million shares in the float. EBIX rallied as much as +19.76% since featured in yellow in the 8/28/09 Mid-Day BreakOuts Report (read here).
>>> The latest Featured Stock Update with an annotated graph appeared on 9/11/2009. click here.
|
|
C
A
S
I |
News |
Chart |
SEC
View all notes Alert
me of new notes
Company
Profile
|
GMCR
- NASDAQ
Green Mtn Coffee Roastrs
FOOD & BEVERAGE - Processed & Packaged Goods
|
$65.32
|
+2.86
|
1,525,116
102% DAV
1,495,100
|
7/17/2009
(Date
Featured) |
$60.15
(Price
Featured) |
PP = $63.79 |
G |
| MB = $66.98 |
Most Recent Note - 9/14/2009 6:29:56 PM
G - Rose well above its 50 DMA line with a 6th consecutive gain today on average volume. It has not formed a new sound base since it completed an additional share offering on 8/07/09, and it is rallying into overhead supply up to $72 which may act as resistance. GMCR traded up more than +168% since appearing with an annotated graph under the headline "It May Soon Be Time To Go Green" when featured in the January 2009 CANSLIM.net News (read here).
>>> The latest Featured Stock Update with an annotated graph appeared on 9/10/2009. click here.
|
|
C
A
S
I |
News |
Chart |
SEC
View all notes Alert
me of new notes
Company
Profile
|
NTES
- NASDAQ
Netease Inc Adr
INTERNET - Internet Information Providers
|
$42.57
|
-0.89
|
1,503,517
70% DAV
2,138,700
|
7/17/2009
(Date
Featured) |
$39.29
(Price
Featured) |
PP = $38.74 |
G |
| MB = $40.68 |
Most Recent Note - 9/14/2009 6:39:44 PM
G - Consolidating with light volume for the past 4 weeks above support at its 50 DMA line (now $41.39) and above prior chart highs in the $38 area. Deterioration below those levels would raise more serious concerns and trigger additional sell signals.
>>> The latest Featured Stock Update with an annotated graph appeared on 9/14/2009. click here.
|
|
C
A
S
I |
News |
Chart |
SEC
View all notes Alert
me of new notes
Company
Profile
|
NVEC
- NASDAQ
N V E Corp
ELECTRONICS - Semiconductor - Specialized
|
$61.69
|
+0.65
|
103,734
125% DAV
83,100
|
8/26/2009
(Date
Featured) |
$55.32
(Price
Featured) |
PP = $57.60 |
G |
| MB = $60.48 |
Most Recent Note - 9/14/2009 6:41:30 PM
G - Holding its ground at its 52-week high, this high-ranked leader from the Electronics industry group quickly got extended from its latest sound base with its big gain on 10/10/09. Keep in mind its small supply (the S criteria) of shares outstanding which can contribute to greater than usual volatility. Be mindful of its still rather minuscule sales revenues. These concerns heighten the need for great discipline in trading (buying AND selling).
>>> The latest Featured Stock Update with an annotated graph appeared on 9/1/2009. click here.
|
|
C
A
S
I |
News |
Chart |
SEC
View all notes Alert
me of new notes
Company
Profile
|
PEGA
- NASDAQ
Pegasystems Inc
COMPUTER SOFTWARE & SERVICES - Business Software & Services
|
$32.78
|
+1.83
|
507,692
138% DAV
368,700
|
9/9/2009
(Date
Featured) |
$31.14
(Price
Featured) |
PP = $33.35 |
Y |
| MB = $35.02 |
Most Recent Note - 9/14/2009 6:47:43 PM
Y - Considerable gain today with +38% above average volume for its second best close ever. Volume had generally been drying up since late August while this high-ranked Computer Software - Financial firm has been consolidating. The previously cited upward trendline connecting its July-August lows may be considered an initial technical support level above its 50 DMA line and prior chart highs. Disciplined investors will watch for a proper new technical buy signal before making initial buys or add-on buys after this 4th stage base.
>>> The latest Featured Stock Update with an annotated graph appeared on 9/9/2009. click here.
|
|
C
A
S
I |
News |
Chart |
SEC
View all notes Alert
me of new notes
Company
Profile
|
|
|
|
THESE ARE NOT BUY RECOMMENDATIONS!
Comments contained in the body of this report are technical
opinions only. The material herein has been obtained
from sources believed to be reliable and accurate, however,
its accuracy and completeness cannot be guaranteed.
This site is not an investment advisor, hence it does
not endorse or recommend any securities or other investments.
Any recommendation contained in this report may not
be suitable for all investors and it is not to be deemed
an offer or solicitation on our part with respect to
the purchase or sale of any securities. All trademarks,
service marks and trade names appearing in this report
are the property of their respective owners, and are
likewise used for identification purposes only.
This report is a service available
only to active Paid Premium Members.
You may opt-out of receiving report notifications
at any time. Questions or comments may be submitted
by writing to Premium Membership Services 665 S.E. 10 Street, Suite 201 Deerfield Beach, FL 33441-5634 or by calling 1-800-965-8307
or 954-785-1121.
|
|
|


