***Last / Change / Volume data in this table is the closing quote data***
Symbol/Exchange
Company Name
Industry Group |
PRICE |
CHANGE
(%Change) |
Day High |
Volume
(% DAV)
(% 50 day avg vol) |
52 Wk Hi
% From Hi |
Featured
Date |
Price
Featured |
Pivot Featured |
|
Max Buy |
ALXN
-
NASDAQ
Alexion Pharmaceuticals
DRUGS - Drug Manufacturers - Other
|
$110.46
|
+1.40
1.28% |
$110.79
|
779,709
63.96% of 50 DAV
50 DAV is 1,219,000
|
$111.06
-0.54%
|
8/23/2012
|
$103.70
|
PP = $110.06
|
|
MB = $115.56
|
Most Recent Note - 9/10/2012 4:41:29 PM
Y - Volume totals have been below average while recently consolidating within close striking distance of its 52-week high. Subsequent volume-driven gains above its pivot point may trigger a new (or add-on) technical buy signal.
>>> The latest Featured Stock Update with an annotated graph appeared on 8/23/2012. Click here.
View all notes |
Alert me of new notes |
CANSLIM.net Company Profile |
SEC |
Zacks Reports |
StockTalk |
News |
Chart |
Request a new note
C
A N
S L
I M


|
ASPS
-
NASDAQ
Altisource Ptf Sltns Sa
REAL ESTATE - Property Management/Developmen
|
$91.06
|
+1.61
1.80% |
$91.40
|
175,586
136.75% of 50 DAV
50 DAV is 128,400
|
$92.29
-1.33%
|
6/5/2012
|
$60.01
|
PP = $63.00
|
|
MB = $66.15
|
Most Recent Note - 9/11/2012 6:05:23 PM
G - Perched -5.1% from its all-time high consolidating in a tight range. Recent lows define near-term support above its 50 DMA line. See the latest FSU analysis for more details and a new annotated graph.
>>> The latest Featured Stock Update with an annotated graph appeared on 9/11/2012. Click here.
View all notes |
Alert me of new notes |
CANSLIM.net Company Profile |
SEC |
Zacks Reports |
StockTalk |
News |
Chart |
Request a new note
C
A N
S L
I M
|
CFNL
-
NASDAQ
Cardinal Financial Corp
BANKING - Regional - Southeast Banks
|
$14.06
|
+0.28
2.03% |
$14.18
|
83,217
141.53% of 50 DAV
50 DAV is 58,800
|
$13.99
0.50%
|
8/17/2012
|
$12.84
|
PP = $13.31
|
|
MB = $13.98
|
 Most Recent Note - 9/13/2012 5:05:53 PM
G - Today's gain with +41% above average volume for a new 52-week high met the bare minimum required to confirm a proper technical buy signal. It finished above the "max buy" level and its color code is changed to green. Prior highs and its 50 DMA line define support to watch on pullbacks.
>>> The latest Featured Stock Update with an annotated graph appeared on 8/21/2012. Click here.
View all notes |
Alert me of new notes |
CANSLIM.net Company Profile |
SEC |
Zacks Reports |
StockTalk |
News |
Chart |
Request a new note
C
A N
S L
I M
|
CMCSA
-
NASDAQ
Comcast Corp Cl A
MEDIA - CATV Systems
|
$35.25
|
+0.66
1.91% |
$35.32
|
11,864,049
96.19% of 50 DAV
50 DAV is 12,334,200
|
$35.16
0.26%
|
6/11/2012
|
$29.94
|
PP = $30.98
|
|
MB = $32.53
|
Most Recent Note - 9/13/2012 5:10:09 PM
G - Hit a new 52-week high today, wedging out of an orderly flat base without great volume conviction behind its gain. No new pivot point is being cited because fundamental concerns were raised by sub par sales and earnings growth in the Jun '12 quarter.
>>> The latest Featured Stock Update with an annotated graph appeared on 8/15/2012. Click here.
View all notes |
Alert me of new notes |
CANSLIM.net Company Profile |
SEC |
Zacks Reports |
StockTalk |
News |
Chart |
Request a new note
C
A N
S L
I M
|
DVA
-
NYSE
Davita Inc
HEALTH SERVICES - Specialized Health Services
|
$99.59
|
+1.12
1.14% |
$100.04
|
622,871
94.79% of 50 DAV
50 DAV is 657,100
|
$103.97
-4.21%
|
9/5/2012
|
$102.92
|
PP = $100.62
|
|
MB = $105.65
|
Most Recent Note - 9/12/2012 5:03:40 PM
Y - Today's gain helped it make a stand near its 50 DMA line and the color code is changed to yellow. A subsequent gain above its pivot point backed by +40% above average volume is the bare minimum volume needed to trigger a technical buy signal. Featured in the 9/05/12 mid-day report (read here) while hitting a new high with a considerable volume-driven gain.
>>> The latest Featured Stock Update with an annotated graph appeared on 9/5/2012. Click here.
View all notes |
Alert me of new notes |
CANSLIM.net Company Profile |
SEC |
Zacks Reports |
StockTalk |
News |
Chart |
Request a new note
C
A N
S L
I M
|
Symbol/Exchange
Company Name
Industry Group |
PRICE |
CHANGE
(%Change) |
Day High |
Volume
(% DAV)
(% 50 day avg vol) |
52 Wk Hi
% From Hi |
Featured
Date |
Price
Featured |
Pivot Featured |
|
Max Buy |
ECPG
-
NASDAQ
Encore Capital Group Inc
FINANCIAL SERVICES - Credit Services
|
$29.71
|
+0.38
1.30% |
$29.72
|
195,385
168.00% of 50 DAV
50 DAV is 116,300
|
$30.47
-2.49%
|
8/3/2012
|
$29.91
|
PP = $30.45
|
|
MB = $31.97
|
Most Recent Note - 9/13/2012 5:13:28 PM
Y - Rallied with above average volume today and finished -2.5% off its 52-week high. Volume-driven gains to new highs would be a reassuring sign of accumulation hinting that it is capable of sustaining a meaningful rally. Completed a Secondary Offering on 8/08/12.
>>> The latest Featured Stock Update with an annotated graph appeared on 9/12/2012. Click here.
View all notes |
Alert me of new notes |
CANSLIM.net Company Profile |
SEC |
Zacks Reports |
StockTalk |
News |
Chart |
Request a new note
C
A N
S L
I M
|
EXPE
-
NASDAQ
Expedia Inc
INTERNET - Internet Information Providers
|
$55.57
|
+1.35
2.49% |
$55.82
|
2,754,354
82.79% of 50 DAV
50 DAV is 3,326,900
|
$59.50
-6.60%
|
4/27/2012
|
$41.80
|
PP = $35.57
|
|
MB = $37.35
|
Most Recent Note - 9/13/2012 5:14:02 PM
G - Posted its 7th small gain today in the span of 8 sessions. Consolidating above prior highs and its 50 DMA line defining important near-term chart support in the $50 area.
>>> The latest Featured Stock Update with an annotated graph appeared on 8/14/2012. Click here.
View all notes |
Alert me of new notes |
CANSLIM.net Company Profile |
SEC |
Zacks Reports |
StockTalk |
News |
Chart |
Request a new note
C
A N
S L
I M
|
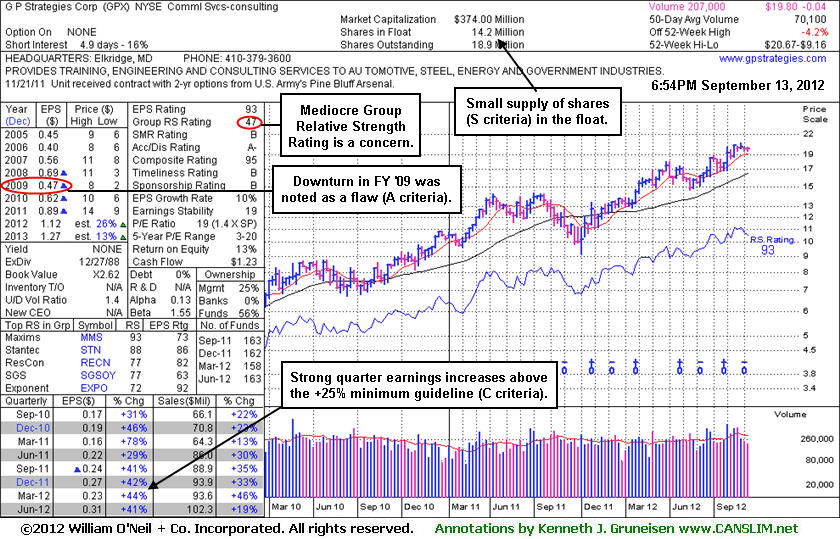
GPX
-
NYSE
G P Strategies Corp
DIVERSIFIED SERVICES - Education and Training Services
|
$19.80
|
-0.04
-0.20% |
$20.08
|
63,699
90.87% of 50 DAV
50 DAV is 70,100
|
$20.67
-4.21%
|
6/29/2012
|
$18.01
|
PP = $18.15
|
|
MB = $19.06
|
Most Recent Note - 9/13/2012 7:07:01 PM
G - Consolidating in a tight trading range perched -4.2% off its 52-week high today, slightly extended from its prior base. Prior highs and its 50 DMA line define chart support in the $18 area. See latest FSU analysis for more details and a new annotated graph.
>>> The latest Featured Stock Update with an annotated graph appeared on 8/7/2012. Click here.
View all notes |
Alert me of new notes |
CANSLIM.net Company Profile |
SEC |
Zacks Reports |
StockTalk |
News |
Chart |
Request a new note
C
A N
S L
I M
|
HMSY
-
NASDAQ
H M S Holdings Corp
COMPUTER SOFTWARE and SERVICES - Healthcare Information Service
|
$32.68
|
-0.32
-0.97% |
$33.10
|
871,750
106.56% of 50 DAV
50 DAV is 818,100
|
$37.19
-12.13%
|
7/27/2012
|
$33.91
|
PP = $34.83
|
|
MB = $36.57
|
Most Recent Note - 9/10/2012 3:37:24 PM
G - Slumping just under its 50 DMA line with today's 4th consecutive loss and its color code is changed to green. A rally above last week's highs is needed to help its technical stance and outlook. Volume-driven gains into new high territory would be a reassuring sign disciplined investors may wait for as an indication of fresh institutional accumulation.
>>> The latest Featured Stock Update with an annotated graph appeared on 8/22/2012. Click here.
View all notes |
Alert me of new notes |
CANSLIM.net Company Profile |
SEC |
Zacks Reports |
StockTalk |
News |
Chart |
Request a new note
C
A N
S L
I M
|
KH
-
NYSE
China Kanghui Hldgs Ads
HEALTH SERVICES - Medical Appliances and Equipment
|
$25.14
|
+0.09
0.36% |
$25.58
|
30,544
113.97% of 50 DAV
50 DAV is 26,800
|
$27.47
-8.48%
|
8/30/2012
|
$24.19
|
PP = $22.90
|
|
MB = $24.05
|
Most Recent Note - 9/11/2012 1:44:53 PM
G - Above average volume is behind its 5th consecutive loss since a "negative reversal" on 9/05/12 at its all-time high. Prior highs in the $23 area define support to watch on pullbacks.
>>> The latest Featured Stock Update with an annotated graph appeared on 8/30/2012. Click here.
View all notes |
Alert me of new notes |
CANSLIM.net Company Profile |
SEC |
Zacks Reports |
StockTalk |
News |
Chart |
Request a new note
C
A N
S L
I M
|
Symbol/Exchange
Company Name
Industry Group |
PRICE |
CHANGE
(%Change) |
Day High |
Volume
(% DAV)
(% 50 day avg vol) |
52 Wk Hi
% From Hi |
Featured
Date |
Price
Featured |
Pivot Featured |
|
Max Buy |
LKQ
-
NASDAQ
L K Q Corp
WHOLESALE - Auto Parts
|
$38.93
|
-0.43
-1.09% |
$39.36
|
748,491
120.43% of 50 DAV
50 DAV is 621,500
|
$40.03
-2.75%
|
8/9/2012
|
$37.93
|
PP = $37.44
|
|
MB = $39.31
|
Most Recent Note - 9/12/2012 4:45:20 PM
G - Color code is changed to green after quietly rising above its "max buy" level. Prior highs in the $37 area define initial support to watch above its 50 DMA line.
>>> The latest Featured Stock Update with an annotated graph appeared on 8/10/2012. Click here.
View all notes |
Alert me of new notes |
CANSLIM.net Company Profile |
SEC |
Zacks Reports |
StockTalk |
News |
Chart |
Request a new note
C
A N
S L
I M
|
LNKD
-
NYSE
Linkedin Corp Class A
INTERNET - Internet Information Providers
|
$119.47
|
-0.08
-0.07% |
$121.00
|
1,795,073
71.73% of 50 DAV
50 DAV is 2,502,400
|
$122.85
-2.75%
|
9/5/2012
|
$113.25
|
PP = $113.10
|
|
MB = $118.76
|
Most Recent Note - 9/12/2012 4:48:01 PM
G - Holding its ground stubbornly with volume totals cooling while hovering at its 52-week high, indicating that few are headed for the exits. Prior highs near $113 define initial support to watch on pullbacks.
>>> The latest Featured Stock Update with an annotated graph appeared on 9/6/2012. Click here.
View all notes |
Alert me of new notes |
CANSLIM.net Company Profile |
SEC |
Zacks Reports |
StockTalk |
News |
Chart |
Request a new note
C
A N
S L
I M
|
MIDD
-
NASDAQ
Middleby Corp
MANUFACTURING - Diversified Machinery
|
$116.22
|
-1.70
-1.44% |
$118.26
|
141,562
139.20% of 50 DAV
50 DAV is 101,700
|
$122.57
-5.18%
|
8/9/2012
|
$118.60
|
PP = $104.92
|
|
MB = $110.17
|
Most Recent Note - 9/12/2012 4:49:00 PM
G - Volume was light today while holding its ground near its 52-week high. Extended from its prior base, its 50 DMA line and prior highs define important chart support to watch.
>>> The latest Featured Stock Update with an annotated graph appeared on 8/13/2012. Click here.
View all notes |
Alert me of new notes |
CANSLIM.net Company Profile |
SEC |
Zacks Reports |
StockTalk |
News |
Chart |
Request a new note
C
A N
S L
I M
|
N
-
NYSE
Netsuite Inc
DIVERSIFIED SERVICES - Business/Management Services
|
$62.28
|
+2.04
3.39% |
$62.87
|
1,030,953
159.37% of 50 DAV
50 DAV is 646,900
|
$60.68
2.64%
|
8/20/2012
|
$55.88
|
PP = $59.32
|
|
MB = $62.29
|
Most Recent Note - 9/13/2012 12:35:06 PM
Y - Hitting another new 52-week high today. On the prior session it rallied above its pivot point with +85% above average volume triggering a new (or add-on) technical buy signal. Its 50 DMA line defines important near-term support.
>>> The latest Featured Stock Update with an annotated graph appeared on 8/20/2012. Click here.
View all notes |
Alert me of new notes |
CANSLIM.net Company Profile |
SEC |
Zacks Reports |
StockTalk |
News |
Chart |
Request a new note
C
A N
S L
I M
|
NSM
-
NYSE
Nationstar Mtg Hldgs Inc
FINANCIAL SERVICES - Credit Services
|
$28.78
|
+0.83
2.97% |
$29.50
|
820,666
103.59% of 50 DAV
50 DAV is 792,200
|
$30.07
-4.29%
|
8/29/2012
|
$27.96
|
PP = $28.85
|
|
MB = $30.29
|
Most Recent Note - 9/13/2012 5:17:14 PM
Y - Best-ever close today by just 2 cents with its gain on average volume. Volume-driven gains above the pivot point cited may clinch a new (or add-on) technical buy signal.
>>> The latest Featured Stock Update with an annotated graph appeared on 9/7/2012. Click here.
View all notes |
Alert me of new notes |
CANSLIM.net Company Profile |
SEC |
Zacks Reports |
StockTalk |
News |
Chart |
Request a new note
C
A N
S L
I M
|
Symbol/Exchange
Company Name
Industry Group |
PRICE |
CHANGE
(%Change) |
Day High |
Volume
(% DAV)
(% 50 day avg vol) |
52 Wk Hi
% From Hi |
Featured
Date |
Price
Featured |
Pivot Featured |
|
Max Buy |
OSIS
-
NASDAQ
O S I Systems Inc
ELECTRONICS - Semiconductor Equipment and Mate
|
$74.31
|
+0.67
0.91% |
$74.90
|
108,693
98.45% of 50 DAV
50 DAV is 110,400
|
$75.99
-2.21%
|
9/5/2012
|
$74.39
|
PP = $75.10
|
|
MB = $78.86
|
Most Recent Note - 9/10/2012 3:41:29 PM
Y - Encountered distributional pressure last week after a new pivot point was cited based on its 8/15/12 high plus 10 cents. Subsequent volume-driven gains for a close above its pivot point may clinch a new (or add-on) technical buy signal. Prior highs in the $67-68 area define initial support to watch on pullbacks.
>>> The latest Featured Stock Update with an annotated graph appeared on 8/9/2012. Click here.
View all notes |
Alert me of new notes |
CANSLIM.net Company Profile |
SEC |
Zacks Reports |
StockTalk |
News |
Chart |
Request a new note
C
A N
S L
I M
|
RNF
-
NYSE
Rentech Nitrogen Ptnr Lp
CHEMICALS - Agricultural Chemicals
|
$35.64
|
+0.14
0.39% |
$35.74
|
288,032
66.69% of 50 DAV
50 DAV is 431,900
|
$35.50
0.39%
|
7/27/2012
|
$29.58
|
PP = $30.60
|
|
MB = $32.13
|
Most Recent Note - 9/12/2012 4:54:00 PM
G - Hit a new 52-week high today with its 4th consecutive gain backed by below average volume. Extended from its prior base with near-term support at prior highs in the $30-31 area and its 50 DMA line.
>>> The latest Featured Stock Update with an annotated graph appeared on 8/31/2012. Click here.
View all notes |
Alert me of new notes |
CANSLIM.net Company Profile |
SEC |
Zacks Reports |
StockTalk |
News |
Chart |
Request a new note
C
A N
S L
I M
|
SWI
-
NYSE
Solarwinds Inc
COMPUTER SOFTWARE and SERVICES - Application Software
|
$58.47
|
-0.05
-0.09% |
$59.26
|
648,527
56.61% of 50 DAV
50 DAV is 1,145,700
|
$60.25
-2.95%
|
7/25/2012
|
$47.82
|
PP = $47.89
|
|
MB = $50.28
|
Most Recent Note - 9/12/2012 4:55:05 PM
G - Volume totals have been cooling while holding its ground near its all-time high. Its 50 DMA line defines important chart support to watch on pullbacks.
>>> The latest Featured Stock Update with an annotated graph appeared on 8/29/2012. Click here.
View all notes |
Alert me of new notes |
CANSLIM.net Company Profile |
SEC |
Zacks Reports |
StockTalk |
News |
Chart |
Request a new note
C
A N
S L
I M
|
TDG
-
NYSE
Transdigm Group Inc
AEROSPACE/DEFENSE - Aerospace/Defense Products and; Services
|
$143.10
|
+0.15
0.10% |
$143.84
|
225,714
62.59% of 50 DAV
50 DAV is 360,600
|
$144.21
-0.77%
|
8/16/2012
|
$132.23
|
PP = $136.44
|
|
MB = $143.26
|
Most Recent Note - 9/12/2012 4:56:19 PM
G - Hovering near its all-time high recently with volume totals cooling. Prior high near $136 defines near-term chart support to watch on pullbacks.
>>> The latest Featured Stock Update with an annotated graph appeared on 8/17/2012. Click here.
View all notes |
Alert me of new notes |
CANSLIM.net Company Profile |
SEC |
Zacks Reports |
StockTalk |
News |
Chart |
Request a new note
C
A N
S L
I M
|
ULTA
-
NASDAQ
Ulta Salon Cosm & Frag
SPECIALTY RETAIL - Specialty Retail, Other
|
$100.16
|
+1.26
1.27% |
$100.40
|
950,174
121.32% of 50 DAV
50 DAV is 783,200
|
$103.52
-3.25%
|
9/4/2012
|
$93.17
|
PP = $98.52
|
|
MB = $103.45
|
Most Recent Note - 9/12/2012 4:59:03 PM
Y - Quietly consolidating near its 52-week high, above its pivot point since the considerable 9/07/12 gap up gain triggered a technical buy signal. Reported earnings +42% on +22% sales revenues for the quarter ended July 31, 2012 versus the year ago period.
>>> The latest Featured Stock Update with an annotated graph appeared on 9/4/2012. Click here.
View all notes |
Alert me of new notes |
CANSLIM.net Company Profile |
SEC |
Zacks Reports |
StockTalk |
News |
Chart |
Request a new note
C
A N
S L
I M
|
Symbol/Exchange
Company Name
Industry Group |
PRICE |
CHANGE
(%Change) |
Day High |
Volume
(% DAV)
(% 50 day avg vol) |
52 Wk Hi
% From Hi |
Featured
Date |
Price
Featured |
Pivot Featured |
|
Max Buy |
ULTI
-
NASDAQ
Ultimate Software Group
INTERNET - Internet Software and Services
|
$98.08
|
-0.83
-0.84% |
$99.39
|
291,731
185.34% of 50 DAV
50 DAV is 157,400
|
$106.40
-7.82%
|
8/27/2012
|
$98.36
|
PP = $99.19
|
|
MB = $104.15
|
Most Recent Note - 9/11/2012 6:09:02 PM
Y - Pulled back today for a 3rd consecutive loss on lighter volume while retreating from its all-time high. Finished near its prior chart highs defining initial support to watch above its 50 DMA line.
>>> The latest Featured Stock Update with an annotated graph appeared on 8/27/2012. Click here.
View all notes |
Alert me of new notes |
CANSLIM.net Company Profile |
SEC |
Zacks Reports |
StockTalk |
News |
Chart |
Request a new note
C
A N
S L
I M
|
VSI
-
NYSE
Vitamin Shoppe Inc
SPECIALTY RETAIL - Specialty Retail, Other
|
$57.90
|
-0.42
-0.72% |
$58.60
|
256,318
68.33% of 50 DAV
50 DAV is 375,100
|
$61.83
-6.35%
|
6/29/2012
|
$54.93
|
PP = $55.03
|
|
MB = $57.78
|
Most Recent Note - 9/10/2012 1:00:57 PM
G - Paused today following a streak of 4 consecutive gains. Rebounded and rallied above its 50 DMA line last week, helping its technical stance. Prior lows near $52 define near-term support where any further deterioration would raise more serious concerns.
>>> The latest Featured Stock Update with an annotated graph appeared on 9/10/2012. Click here.
View all notes |
Alert me of new notes |
CANSLIM.net Company Profile |
SEC |
Zacks Reports |
StockTalk |
News |
Chart |
Request a new note
C
A N
S L
I M
|
WPI
-
NYSE
Watson Pharmaceuticals
DRUGS - Drugs - Generic
|
$82.90
|
+0.90
1.10% |
$83.27
|
1,241,837
105.79% of 50 DAV
50 DAV is 1,173,900
|
$84.02
-1.33%
|
8/24/2012
|
$82.90
|
PP = $81.10
|
|
MB = $85.16
|
Most Recent Note - 9/13/2012 4:59:18 PM
Y - Posted a small gain today with near average volume. Still holding its ground in a tight range near its 52-week high since triggering a technical buy signal on 8/24/12 when highlighted in the mid-day report with a gap up gain backed by above average volume. Prior highs in the $81 area define initial support to watch on pullbacks.
>>> The latest Featured Stock Update with an annotated graph appeared on 8/28/2012. Click here.
View all notes |
Alert me of new notes |
CANSLIM.net Company Profile |
SEC |
Zacks Reports |
StockTalk |
News |
Chart |
Request a new note
C
A N
S L
I M
|