You are not logged in.
This means you
CAN ONLY VIEW reports that were published prior to Monday, April 14, 2025.
You
MUST UPGRADE YOUR MEMBERSHIP if you want to see any current reports.
AFTER MARKET UPDATE - WEDNESDAY, SEPTEMBER 11TH, 2013
Previous After Market Report Next After Market Report >>>
|
|
|
|
DOW |
+135.54 |
15,326.60 |
+0.89% |
|
Volume |
656,908,080 |
-15% |
|
Volume |
1,633,866,940 |
-7% |
|
NASDAQ |
-4.01 |
3,725.01 |
-0.11% |
|
Advancers |
1,655 |
53% |
|
Advancers |
1,206 |
46% |
|
S&P 500 |
+5.14 |
1,689.13 |
+0.31% |
|
Decliners |
1,345 |
43% |
|
Decliners |
1,295 |
50% |
|
Russell 2000 |
-0.38 |
1,055.34 |
-0.04% |
|
52 Wk Highs |
175 |
|
|
52 Wk Highs |
171 |
|
|
S&P 600 |
+0.36 |
596.09 |
+0.06% |
|
52 Wk Lows |
68 |
|
|
52 Wk Lows |
16 |
|
|
 |
Major Averages End Mixed With Lighter Volume Totals
Kenneth J. Gruneisen - Passed the CAN SLIM® Master's Exam
Stocks managed to climb from their early morning lows and the major averages ended mixed on Wednesday as investors digested recent gains in equities. Volume totals were lighter on the NYSE and on the Nasdaq exchange. Breadth was slightly positive as advancers led decliners by an 8-7 margin on the NYSE and 7-5 on the Nasdaq exchange. There were 88 high-ranked companies from the CANSLIM.net Leaders List that made new 52-week highs and appeared on the CANSLIM.net BreakOuts Page, down from the total of 105 stocks on the prior session. The list of stocks hitting new 52-week highs outnumbered new lows on the NYSE and on the Nasdaq exchange. There were gains for 9 of the 18 high-ranked companies currently included on the Featured Stocks Page.
Seven of the 10 sectors on the S&P were higher, led by gains in telecom stocks including F Networks Inc (FFIV +2.29%). Apple Inc (AAPL -5.44%) sank after new details announced surrounding the new iPhone 5c. Analysts were largely disappointed with the company's pricing strategy fearing that it would hinder growth in the emerging markets. In other news, Texas Instruments Inc (TXN -0.69%) fell as the company lowered their current quarterly earnings forecasts.
Turning to fixed income markets, Treasuries were higher along the curve. The benchmark 10-year note was up 15/32 to yield 2.92% and the 30-year bond added 27/32 to yield 3.85%.
New buying efforts in stocks are justified under the fact-based system while the market (M criteria) is currently in a confirmed rally. Stay familiar with companies listed on the CANSLIM.net Featured Stocks Page - a page showing the most action-worthy candidates' latest notes and links to additional resources including detailed analysis with data-packed graphs which are annotated by a Certified expert. The Premium Member Homepage - includes "dynamic archives" to all prior pay reports published. Watch for an announcement via email concerning the next WEBCAST.
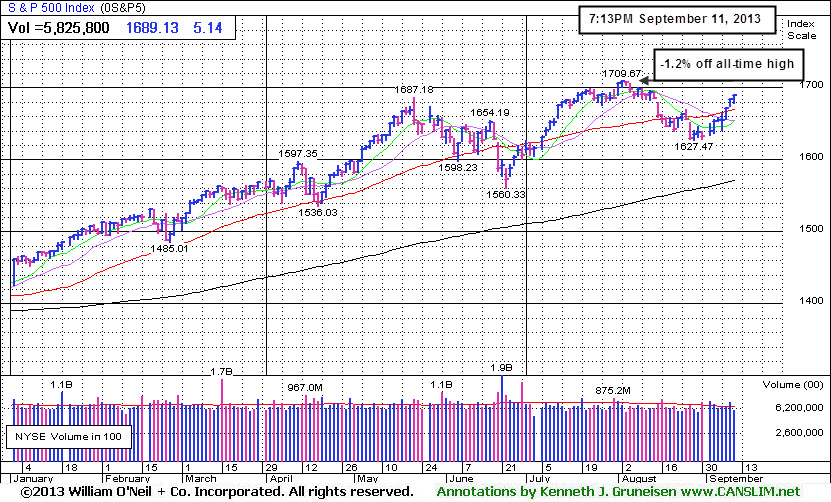
PICTURED: The S&P 500 Index extended its winning streak to 7-consecutive sessions, adding 5 points to 1,689. The rally has it perched -1.2% off its all-time high hit on 8/02/13. Subsequent gains into new high territory for the benchmark index may help the broader market to gain additional upward momentum.
|
 Kenneth J. Gruneisen started out as a licensed stockbroker in August 1987, a couple of months prior to the historic stock market crash that took the Dow Jones Industrial Average down -22.6% in a single day. He has published daily fact-based fundamental and technical analysis on high-ranked stocks online for two decades. Through FACTBASEDINVESTING.COM, Kenneth provides educational articles, news, market commentary, and other information regarding proven investment systems that work in good times and bad.
Comments contained in the body of this report are technical opinions only and are not necessarily those of Gruneisen Growth Corp. The material herein has been obtained from sources believed to be reliable and accurate, however, its accuracy and completeness cannot be guaranteed. Our firm, employees, and customers may effect transactions, including transactions contrary to any recommendation herein, or have positions in the securities mentioned herein or options with respect thereto. Any recommendation contained in this report may not be suitable for all investors and it is not to be deemed an offer or solicitation on our part with respect to the purchase or sale of any securities. |
|
 |
Healthcare, Commodity-Linked Groups Led Gainers
Kenneth J. Gruneisen - Passed the CAN SLIM® Master's Exam
The Healthcare Index ($HMO +1.48%) posted a solid gain. Commodity-linked groups edged higher as the Gold & Silver Index ($XAU +0.90%), Integrated Oil Index ($XOI +0.91%), and the Oil Services Index ($OSX +0.25%) rose. The Retail Index ($RLX +0.28%) also posted a small gain. Financial shares ended the session lower and weighed on the major averages as the Broker/Dealer Index ($XBD -0.75%) and the Bank Index ($BKX -0.30%) pulled back for small losses.The tech sector was mixed as the Biotechnology Index ($BTK -0.40%) and the Semiconductor Index ($SOX -0.33%) edged lower while the Internet Index ($IIX +0.11%) and the Networking Index ($NWX +0.54%) rose.
Charts courtesy www.stockcharts.com
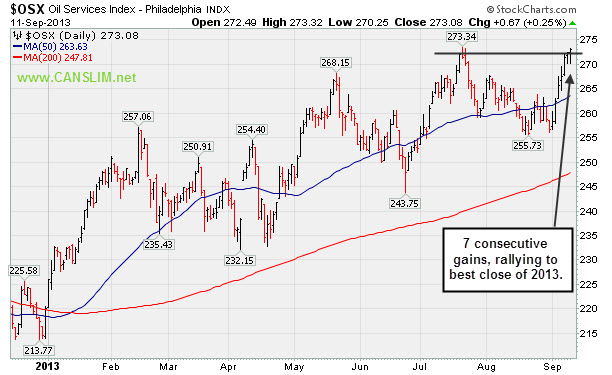
PICTURED: The Oil Services Index ($OSX +0.25%) tallied 7 consecutive gains and ended at its best close for 2013.
| Oil Services |
$OSX |
273.08 |
+0.67 |
+0.25% |
+24.04% |
| Healthcare |
$HMO |
3,536.51 |
+51.42 |
+1.48% |
+40.66% |
| Integrated Oil |
$XOI |
1,408.91 |
+12.68 |
+0.91% |
+13.45% |
| Semiconductor |
$SOX |
489.04 |
-1.61 |
-0.33% |
+27.33% |
| Networking |
$NWX |
301.28 |
+1.61 |
+0.54% |
+32.99% |
| Internet |
$IIX |
417.68 |
+0.45 |
+0.11% |
+27.73% |
| Broker/Dealer |
$XBD |
139.37 |
-1.06 |
-0.75% |
+47.75% |
| Retail |
$RLX |
837.09 |
+2.30 |
+0.28% |
+28.18% |
| Gold & Silver |
$XAU |
99.44 |
+0.89 |
+0.90% |
-39.95% |
| Bank |
$BKX |
63.97 |
-0.19 |
-0.30% |
+24.75% |
| Biotech |
$BTK |
2,205.36 |
-8.93 |
-0.40% |
+42.55% |
|
|
|
 |
Insider Buying While Forming New "Late Stage" Base
Kenneth J. Gruneisen - Passed the CAN SLIM® Master's Exam
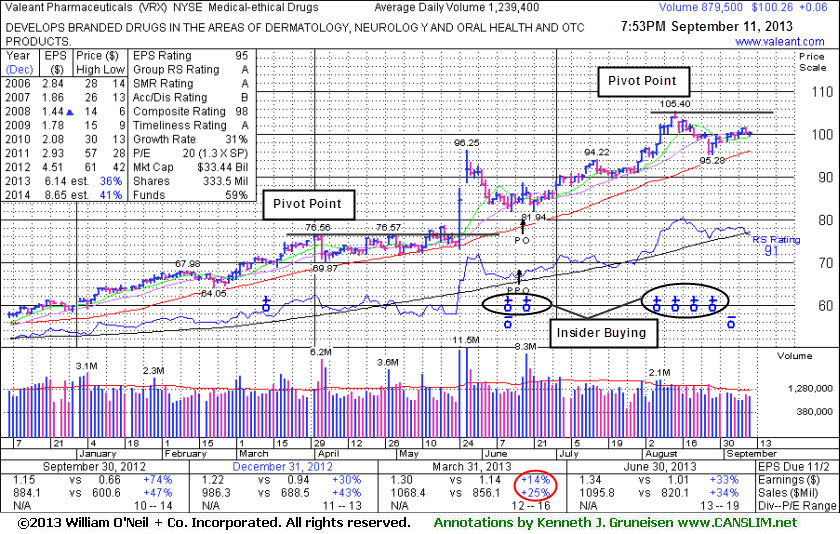
Valeant Pharmaceuticals International, Inc (VRX +$0.06 or +0.06% to $100.26) is holding its ground -4.9% off its 52-week high. Recent insider buying (indicated on the annotated graph) while trading near its highs has been noted as an encouraging sign. A new pivot point is cited based on its 8/14/13 high plus 10 cents. Subsequent volume-driven gains above the pivot point may trigger a new (or add-on) technical buy signal, albeit from a risker "late-stage" base. Prior highs near $96 and its 50-day moving average (DMA) line define support to watch on pullbacks.
It reported earnings +33% on +34% sales revenues for the Jun '13 quarter, above the +25% minimum earnings guideline (C criteria). It was last shown in this FSU section on 8/15/13 with an annotated graph under the headline, "Latest Results Showed Better Earnings Growth", after rallying into new 52-week high territory with 9 gains in the span of 10 sessions.
Concerns had been raised by its Mar '13 earnings report with only a +14% earnings increase, below the +25% minimum guideline (C criteria) for buy candidates. A downturn in FY '07 and '08 earnings (A criteria) has been followed by a strong earnings rebound in recent years. Return On Equity is currently reported at 37%, well above the 17% minimum guideline of the fact-based system.
The number of top-rated funds owning its shares rose from 818 in Mar '12 in to 1,060 in Jun '13, a reassuring trend concerning the I criteria. Its current Up/Down Volume Ratio of 1.6 is an unbiased indication that its shares have been under accumulation over the past 50 days.
The high-ranked Medical - Ethical Drugs firm's shares spiked higher in late May at around the time of M&A news that it would buy Bausch & Lomb for $8.7 billion. That move and other recent acquisitions resulted in stronger earnings in the latest quarterly comparison.
It completed Public Offering on 6/18/13. The upshot of Public Offerings is that when completed the end result is typically an increase in the total number of institutional owners. Institutional owners are often supportive of their existing positions and will even accumulate more shares when they consolidate near classic support levels like the 50-day and 200-day moving average (DMA) lines, if they are still believers in the company. If too many become pessimistic and decide to unload, this is what ends up sending the stocks slicing through support.
Prior reports noted - "Investors are taught in the Certification to only buy stocks with a combination of both strong fundamentals and strong technical action, however stocks should be sold based on their technical action only. In this example, more bullish action rewarded patient investors still giving it the benefit of the doubt until any technical sell signals start adding up."
|
|
|
Color Codes Explained :
Y - Better candidates highlighted by our
staff of experts.
G - Previously featured
in past reports as yellow but may no longer be buyable under the
guidelines.
***Last / Change / Volume data in this table is the closing quote data***
Symbol/Exchange
Company Name
Industry Group |
PRICE |
CHANGE
(%Change) |
Day High |
Volume
(% DAV)
(% 50 day avg vol) |
52 Wk Hi
% From Hi |
Featured
Date |
Price
Featured |
Pivot Featured |
|
Max Buy |
BITA
-
NYSE
Bitauto Hldgs Ltd Ads
INTERNET - Internet Information Providers
|
$16.46
|
+0.36
2.24% |
$16.67
|
364,857
121.21% of 50 DAV
50 DAV is 301,000
|
$18.10
-9.06%
|
8/7/2013
|
$12.01
|
PP = $13.30
|
|
MB = $13.97
|
Most Recent Note - 9/10/2013 12:02:16 PM
G - Finished near the session low after early gains had it poised for a best-ever close on the prior session. During its choppy consolidation it found support above its 50 DMA line and prior highs.
>>> The latest Featured Stock Update with an annotated graph appeared on 9/3/2013. Click here.
View all notes |
Alert me of new notes |
CANSLIM.net Company Profile |
SEC |
Zacks Reports |
StockTalk |
News |
Chart |
Request a new note
C
A N
S L
I M


|
CELG
-
NASDAQ
Celgene Corp
DRUGS - Drug Manufacturers - Major
|
$149.56
|
+0.82
0.55% |
$149.56
|
1,815,513
73.66% of 50 DAV
50 DAV is 2,464,600
|
$151.00
-0.95%
|
7/11/2013
|
$133.25
|
PP = $131.92
|
|
MB = $138.52
|
Most Recent Note - 9/4/2013 11:55:25 AM
Y - Building a base-on-base type pattern, it recently found support above prior highs in the $131 area and above its 50 DMA line, important chart support levels.
>>> The latest Featured Stock Update with an annotated graph appeared on 8/21/2013. Click here.
View all notes |
Alert me of new notes |
CANSLIM.net Company Profile |
SEC |
Zacks Reports |
StockTalk |
News |
Chart |
Request a new note
C
A N
S L
I M
|
FLT
-
NYSE
Fleetcor Technologies
DIVERSIFIED SERVICES - Business/Management Services
|
$107.41
|
+1.32
1.24% |
$110.42
|
2,114,343
365.80% of 50 DAV
50 DAV is 578,000
|
$108.38
-0.89%
|
8/19/2013
|
$99.01
|
PP = $100.97
|
|
MB = $106.02
|
 Most Recent Note - 9/11/2013 1:15:07 PM
G - Color code is changed to green while rallying beyond its "max buy" level and hitting a new high today after pricing a 2.75M share Secondary Offering at $105.25.
>>> The latest Featured Stock Update with an annotated graph appeared on 9/6/2013. Click here.
View all notes |
Alert me of new notes |
CANSLIM.net Company Profile |
SEC |
Zacks Reports |
StockTalk |
News |
Chart |
Request a new note
C
A N
S L
I M
|
GNRC
-
NYSE
Generac Hldgs Inc
CONSUMER DURABLES - Electronic Equipment
|
$40.77
|
+0.14
0.34% |
$40.80
|
741,192
85.79% of 50 DAV
50 DAV is 864,000
|
$44.30
-7.97%
|
7/30/2013
|
$42.60
|
PP = $42.10
|
|
MB = $44.21
|
Most Recent Note - 9/5/2013 6:51:21 PM
G - Lingering below its 50 DMA line, its color code is changed to green as deterioration raised concerns. Stalled after a recent rally from an advanced "3-weeks tight" base as it priced a Secondary Offering. Disciplined investors always limit losses by selling if any stock falls more than -7% from its purchase price.
>>> The latest Featured Stock Update with an annotated graph appeared on 8/22/2013. Click here.
View all notes |
Alert me of new notes |
CANSLIM.net Company Profile |
SEC |
Zacks Reports |
StockTalk |
News |
Chart |
Request a new note
C
A N
S L
I M
|
KORS
-
NYSE
Michael Kors Hldgs Ltd
RETAIL - Apparel Stores
|
$74.58
|
+1.37
1.87% |
$75.00
|
4,997,385
143.10% of 50 DAV
50 DAV is 3,492,200
|
$76.74
-2.81%
|
8/6/2013
|
$69.66
|
PP = $66.28
|
|
MB = $69.59
|
Most Recent Note - 9/10/2013 7:39:15 PM
G - Retreated from its high with above average volume behind today's big loss and it finished near the session low. Its 50 DMA line defines support above prior highs in the $66 area.
>>> The latest Featured Stock Update with an annotated graph appeared on 8/29/2013. Click here.
View all notes |
Alert me of new notes |
CANSLIM.net Company Profile |
SEC |
Zacks Reports |
StockTalk |
News |
Chart |
Request a new note
C
A N
S L
I M
|
Symbol/Exchange
Company Name
Industry Group |
PRICE |
CHANGE
(%Change) |
Day High |
Volume
(% DAV)
(% 50 day avg vol) |
52 Wk Hi
% From Hi |
Featured
Date |
Price
Featured |
Pivot Featured |
|
Max Buy |
LOPE
-
NASDAQ
Grand Canyon Education
DIVERSIFIED SERVICES - Education and; Training Services
|
$36.45
|
-0.10
-0.27% |
$37.19
|
322,785
77.72% of 50 DAV
50 DAV is 415,300
|
$37.17
-1.94%
|
6/19/2013
|
$31.47
|
PP = $34.17
|
|
MB = $35.88
|
Most Recent Note - 9/5/2013 6:53:55 PM
G - Rose to a best-ever close today and inched nearer to its 52-week high with another gain on light volume. Earnings +15% on +19% sales for the Jun '13 quarter, below the +25% minimum earnings guideline (C criteria), raised fundamental concerns, yet technical action has been somewhat reassuring.
>>> The latest Featured Stock Update with an annotated graph appeared on 8/14/2013. Click here.
View all notes |
Alert me of new notes |
CANSLIM.net Company Profile |
SEC |
Zacks Reports |
StockTalk |
News |
Chart |
Request a new note
C
A N
S L
I M
|
MRLN
-
NASDAQ
Marlin Business Services
DIVERSIFIED SERVICES - Rental and Leasing Services
|
$26.83
|
+0.59
2.25% |
$26.96
|
77,371
259.63% of 50 DAV
50 DAV is 29,800
|
$26.27
2.15%
|
9/9/2013
|
$25.75
|
PP = $26.07
|
|
MB = $27.37
|
Most Recent Note - 9/11/2013 1:19:32 PM
Y - Hitting a new 52-week high today. Rising slowly since highlighted in yellow with new pivot point cited based on its May '13 highs plus 10 cents. Technically, it broke out with a volume-driven gain on 9/05/13. The broader market (M criteria) justifies selective new buying efforts with the market shifting to a confirmed rally. Fundamentals remain strong and it found support near its 200 DMA line since dropped from the Featured Stocks list on 6/21/13. See the latest FSU analysis for more details and a new annotated weekly graph.

>>> The latest Featured Stock Update with an annotated graph appeared on 9/9/2013. Click here.
View all notes |
Alert me of new notes |
CANSLIM.net Company Profile |
SEC |
Zacks Reports |
StockTalk |
News |
Chart |
Request a new note
C
A N
S L
I M
|
PCLN
-
NASDAQ
Priceline.Com Inc
INTERNET - Internet Software and Services
|
$981.56
|
+4.06
0.42% |
$985.77
|
348,662
54.19% of 50 DAV
50 DAV is 643,400
|
$994.98
-1.35%
|
7/8/2013
|
$878.28
|
PP = $847.43
|
|
MB = $889.80
|
Most Recent Note - 9/6/2013 6:15:20 PM
G - Consolidating in an orderly fashion above prior highs, building a new base. Reported earnings +24% on +27% sales revenues for the Jun '13 quarter, just under the +25% minimum earnings guideline (C criteria).
>>> The latest Featured Stock Update with an annotated graph appeared on 8/19/2013. Click here.
View all notes |
Alert me of new notes |
CANSLIM.net Company Profile |
SEC |
Zacks Reports |
StockTalk |
News |
Chart |
Request a new note
C
A N
S L
I M
|
PRAA
-
NASDAQ
Portfolio Recovery Assoc
DIVERSIFIED SERVICES - Business/Management Services
|
$58.78
|
-0.53
-0.89% |
$59.45
|
367,281
67.02% of 50 DAV
50 DAV is 548,000
|
$59.34
-0.94%
|
7/31/2013
|
$51.43
|
PP = $54.72
|
|
MB = $57.46
|
Most Recent Note - 9/10/2013 7:33:47 PM
G - Hit a new 52-week high and rallied above its "max buy" level with today's 6th consecutive gain and its color code is changed to green. Found support above its 50 DMA line during the latest consolidation.
>>> The latest Featured Stock Update with an annotated graph appeared on 8/28/2013. Click here.
View all notes |
Alert me of new notes |
CANSLIM.net Company Profile |
SEC |
Zacks Reports |
StockTalk |
News |
Chart |
Request a new note
C
A N
S L
I M
|
PRLB
-
NYSE
Proto Labs Inc
MANUFACTURING - Small Tools and Accessories
|
$74.93
|
-1.34
-1.76% |
$76.73
|
464,251
115.86% of 50 DAV
50 DAV is 400,700
|
$76.69
-2.29%
|
7/29/2013
|
$64.86
|
PP = $67.50
|
|
MB = $70.88
|
Most Recent Note - 9/9/2013 5:51:21 PM
G - Hovering near its all-time high after rallying beyond its "max buy" level. Support to watch is at prior highs and above its 50 DMA line.
>>> The latest Featured Stock Update with an annotated graph appeared on 8/27/2013. Click here.
View all notes |
Alert me of new notes |
CANSLIM.net Company Profile |
SEC |
Zacks Reports |
StockTalk |
News |
Chart |
Request a new note
C
A N
S L
I M
|
Symbol/Exchange
Company Name
Industry Group |
PRICE |
CHANGE
(%Change) |
Day High |
Volume
(% DAV)
(% 50 day avg vol) |
52 Wk Hi
% From Hi |
Featured
Date |
Price
Featured |
Pivot Featured |
|
Max Buy |
QCOR
-
NASDAQ
Questcor Pharmaceuticals
DRUGS - Biotechnology
|
$63.98
|
-3.56
-5.27% |
$68.20
|
2,310,594
138.39% of 50 DAV
50 DAV is 1,669,600
|
$74.76
-14.42%
|
7/31/2013
|
$66.46
|
PP = $59.01
|
|
MB = $61.96
|
Most Recent Note - 9/11/2013 8:28:42 PM
G - Loss today with above average volume tested near its 50 DMA line, yet it found prompt support and ended the session near recent lows in the $64 area.
>>> The latest Featured Stock Update with an annotated graph appeared on 8/26/2013. Click here.
View all notes |
Alert me of new notes |
CANSLIM.net Company Profile |
SEC |
Zacks Reports |
StockTalk |
News |
Chart |
Request a new note
C
A N
S L
I M
|
SFUN
-
NYSE
Soufun Hldgs Ltd Ads A
INTERNET - Internet Information Providers
|
$50.59
|
-2.92
-5.46% |
$53.41
|
1,304,070
175.28% of 50 DAV
50 DAV is 744,000
|
$53.77
-5.91%
|
7/16/2013
|
$29.54
|
PP = $27.90
|
|
MB = $29.30
|
Most Recent Note - 9/11/2013 8:30:08 PM
G - Retreated from all-time highs today with above average volume after getting very extended from any sound base. Recent highs near $42 define initial support to watch on pullbacks.
>>> The latest Featured Stock Update with an annotated graph appeared on 8/30/2013. Click here.
View all notes |
Alert me of new notes |
CANSLIM.net Company Profile |
SEC |
Zacks Reports |
StockTalk |
News |
Chart |
Request a new note
C
A N
S L
I M
|
SSNC
-
NASDAQ
S S & C Technologies
COMPUTER SOFTWARE and SERVICES - Application Software
|
$37.43
|
-0.56
-1.47% |
$38.40
|
506,917
144.96% of 50 DAV
50 DAV is 349,700
|
$38.80
-3.53%
|
9/5/2013
|
$36.01
|
PP = $38.90
|
|
MB = $40.85
|
Most Recent Note - 9/10/2013 7:35:28 PM
Y - Rallied for a solid gain with 2 times average volume today while approaching a new pivot point cited based on its 8/02/13 high plus 10 cents. Subsequent volume-driven gains may trigger a new buy signal.
>>> The latest Featured Stock Update with an annotated graph appeared on 9/5/2013. Click here.
View all notes |
Alert me of new notes |
CANSLIM.net Company Profile |
SEC |
Zacks Reports |
StockTalk |
News |
Chart |
Request a new note
C
A N
S L
I M
|
SSYS
-
NASDAQ
Stratasys Ltd
COMPUTER HARDWARE - Computer Peripherals
|
$102.99
|
-0.81
-0.78% |
$104.00
|
599,583
69.01% of 50 DAV
50 DAV is 868,800
|
$113.49
-9.25%
|
7/8/2013
|
$91.44
|
PP = $95.00
|
|
MB = $99.75
|
Most Recent Note - 9/10/2013 7:36:54 PM
G - Proposed a new Public Offering on 9/09/13 perched near all-time highs. See the latest FSU analysis for more details and a new annotated graph.
>>> The latest Featured Stock Update with an annotated graph appeared on 9/10/2013. Click here.
View all notes |
Alert me of new notes |
CANSLIM.net Company Profile |
SEC |
Zacks Reports |
StockTalk |
News |
Chart |
Request a new note
C
A N
S L
I M
|
STMP
-
NASDAQ
Stamps.Com Inc
INTERNET - Internet Software and Services
|
$43.49
|
-0.58
-1.32% |
$44.13
|
110,940
85.08% of 50 DAV
50 DAV is 130,400
|
$46.47
-6.41%
|
7/31/2013
|
$40.00
|
PP = $42.98
|
|
MB = $45.13
|
Most Recent Note - 9/6/2013 6:19:38 PM
Y - Posted a 7th consecutive gain today and ended at a best-ever close. Recently found encouraging support at its 50 DMA line.
>>> The latest Featured Stock Update with an annotated graph appeared on 8/23/2013. Click here.
View all notes |
Alert me of new notes |
CANSLIM.net Company Profile |
SEC |
Zacks Reports |
StockTalk |
News |
Chart |
Request a new note
C
A N
S L
I M
|
Symbol/Exchange
Company Name
Industry Group |
PRICE |
CHANGE
(%Change) |
Day High |
Volume
(% DAV)
(% 50 day avg vol) |
52 Wk Hi
% From Hi |
Featured
Date |
Price
Featured |
Pivot Featured |
|
Max Buy |
TBBK
-
NASDAQ
Bancorp Inc
BANKING - Regional - Mid-Atlantic Banks
|
$18.13
|
+0.19
1.06% |
$18.38
|
316,895
202.75% of 50 DAV
50 DAV is 156,300
|
$17.97
0.89%
|
9/4/2013
|
$16.26
|
PP = $16.79
|
|
MB = $17.63
|
Most Recent Note - 9/10/2013 12:49:04 PM
G - Hitting another new 52-week high today with its 8th consecutive gain and its color code is changed to green after rallying beyond its "max buy" level. Triggered a technical buy signal with a breakout gain on 3 times average volume on 9/05/13, rising from an 8-week base. Prior highs define important near-term support to watch on pullbacks. An annotated graph and more details were included in the FSU section on 9/04/13 under the headline, "Forming Sound Set-Up While "M" Correction Remains Overriding Concern".
>>> The latest Featured Stock Update with an annotated graph appeared on 9/4/2013. Click here.
View all notes |
Alert me of new notes |
CANSLIM.net Company Profile |
SEC |
Zacks Reports |
StockTalk |
News |
Chart |
Request a new note
C
A N
S L
I M
|
VRX
-
NYSE
Valeant Pharmaceuticals
DRUGS - Drug Manufacturers - Other
|
$100.26
|
+0.06
0.06% |
$100.62
|
880,070
71.01% of 50 DAV
50 DAV is 1,239,400
|
$105.40
-4.88%
|
9/11/2013
|
$100.26
|
PP = $105.50
|
|
MB = $110.78
|
Most Recent Note - 9/11/2013 8:19:59 PM
Y- Color code is changed to yellow with new pivot point cited based on its 8/14/13 high plus 10 cents. Recent insider buying while trading near its highs has been noted as an encouraging sign. See the latest FSU analysis for more details and a new annotated graph.
>>> The latest Featured Stock Update with an annotated graph appeared on 9/11/2013. Click here.
View all notes |
Alert me of new notes |
CANSLIM.net Company Profile |
SEC |
Zacks Reports |
StockTalk |
News |
Chart |
Request a new note
C
A N
S L
I M
|
YNDX
-
NASDAQ
Yandex N V Class A
INTERNET - Internet Information Providers
|
$34.50
|
-0.50
-1.43% |
$35.19
|
2,243,080
90.92% of 50 DAV
50 DAV is 2,467,100
|
$35.88
-3.85%
|
9/5/2013
|
$34.24
|
PP = $34.79
|
|
MB = $36.53
|
Most Recent Note - 9/9/2013 5:48:44 PM
Y - Rallied to a best-ever close and a new 52-week high with today's gain lacking great volume conviction. Found support at its 50 DMA line, important near-term support to watch. It did not form a base of sufficient length, however its color code was changed to yellow while a valid secondary buy point exists up to +5% above its prior high.
>>> The latest Featured Stock Update with an annotated graph appeared on 8/20/2013. Click here.
View all notes |
Alert me of new notes |
CANSLIM.net Company Profile |
SEC |
Zacks Reports |
StockTalk |
News |
Chart |
Request a new note
C
A N
S L
I M
|
|
|
|
THESE ARE NOT BUY RECOMMENDATIONS!
Comments contained in the body of this report are technical
opinions only. The material herein has been obtained
from sources believed to be reliable and accurate, however,
its accuracy and completeness cannot be guaranteed.
This site is not an investment advisor, hence it does
not endorse or recommend any securities or other investments.
Any recommendation contained in this report may not
be suitable for all investors and it is not to be deemed
an offer or solicitation on our part with respect to
the purchase or sale of any securities. All trademarks,
service marks and trade names appearing in this report
are the property of their respective owners, and are
likewise used for identification purposes only.
This report is a service available
only to active Paid Premium Members.
You may opt-out of receiving report notifications
at any time. Questions or comments may be submitted
by writing to Premium Membership Services 665 S.E. 10 Street, Suite 201 Deerfield Beach, FL 33441-5634 or by calling 1-800-965-8307
or 954-785-1121.
|
|
|

