You are not logged in.
This means you
CAN ONLY VIEW reports that were published prior to Monday, April 14, 2025.
You
MUST UPGRADE YOUR MEMBERSHIP if you want to see any current reports.
AFTER MARKET UPDATE - TUESDAY, SEPTEMBER 10TH, 2013
Previous After Market Report Next After Market Report >>>
|
|
|
|
DOW |
+127.94 |
15,191.06 |
+0.85% |
|
Volume |
773,023,160 |
+21% |
|
Volume |
1,759,645,640 |
+9% |
|
NASDAQ |
+22.84 |
3,729.02 |
+0.62% |
|
Advancers |
1,996 |
64% |
|
Advancers |
1,678 |
64% |
|
S&P 500 |
+12.28 |
1,683.99 |
+0.73% |
|
Decliners |
1,012 |
33% |
|
Decliners |
853 |
32% |
|
Russell 2000 |
+9.64 |
1,055.72 |
+0.92% |
|
52 Wk Highs |
212 |
|
|
52 Wk Highs |
209 |
|
|
S&P 600 |
+5.49 |
593.73 |
+0.93% |
|
52 Wk Lows |
39 |
|
|
52 Wk Lows |
15 |
|
|
 |
Major Averages Rise With Higher Volume as Leadership Expands
Kenneth J. Gruneisen - Passed the CAN SLIM® Master's Exam
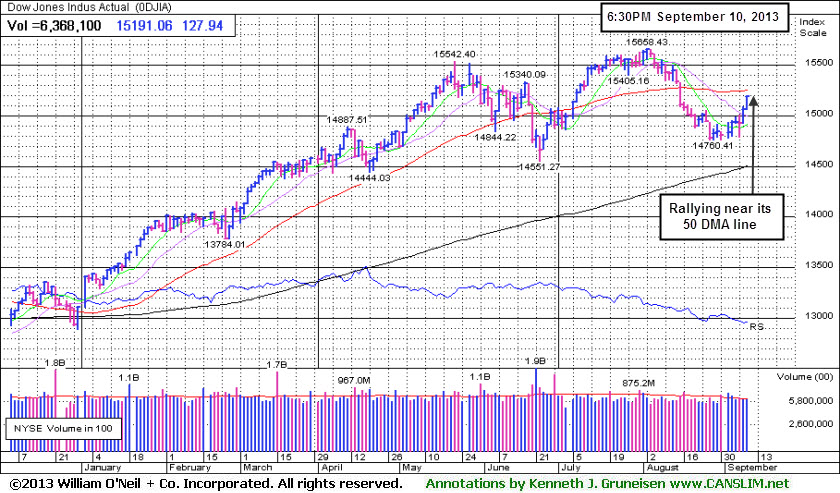
The Nasdaq Composite Index ended higher by 22 points at 3,729, surging further into new high territory for 2013. Following Monday's encouraging shift as the market (M criteria) returned to a confirmed rally, higher volume totals on the NYSE and on the Nasdaq exchange revealed an increase in the level of institutional buying conviction behind additional gains on Tuesday. Breadth was positive as advancers led decliners by nearly a 2-1 margin on the NYSE and on the Nasdaq exchange. There were 105 high-ranked companies from the CANSLIM.net Leaders List that made new 52-week highs and appeared on the CANSLIM.net BreakOuts Page, more than doubling the total of 52 stocks on the prior session, an encouraging expansion in market leadership. The list of stocks hitting new 52-week highs outnumbered new lows on the NYSE and on the Nasdaq exchange. There were gains for 13 of the 18 high-ranked companies currently included on the Featured Stocks Page.
The major averages ended near their best levels of the session after stocks climbed throughout the day. Investors responded positively to better-than-expected Chinese economic data and as fears of a military strike in Syria eased.
All 10 sectors on the S&P ended higher, led by gains in the industrial space. Shares of General Electric Co (GE +2.05%) rose. On the earnings front, retailer PVH Corp (PVH -5.64%) fell after the company delivered better-than-expected earnings, but warned of current-quarter weakness. In other action, shares of The Goldman Sachs Group Inc (GS +3.54%) rallied on news that the stock would be added to the Dow Jones Industrial Average. Additionally, Nike Inc (NKE +2.17%) and Visa Inc (V +3.38%) are also going to be added to the blue chip index, taking the place of Alcoa Inc (AA -0.31%), Bank of America Corp (BAC +0.90%) and Hewlett-Packard Corp (HPQ -0.40%).
Turning to fixed income markets, Treasuries were lower along the curve. The benchmark 10-year note was down 13/32 to yield 2.97% and the 30-year bond was off 21/32 to yield 3.90%.
New buying efforts in stocks are justified under the fact-based system while the market (M criteria) is currently in a confirmed rally. Stay familiar with companies listed on the CANSLIM.net Featured Stocks Page - a page showing the most action-worthy candidates' latest notes and links to additional resources including detailed analysis with data-packed graphs which are annotated by a Certified expert. The Premium Member Homepage - includes "dynamic archives" to all prior pay reports published. Watch for an announcement via email concerning the next WEBCAST.
PICTURED: The Dow Jones Industrial Average surged toward yet remains just below its 50-day moving average. The pending changes to the index, noted in the commentary above, are typical of adjustments made over time by the board of directors at Dow Jones & Co while maintaining the 30-component index's relevance to major US industries.
|
 Kenneth J. Gruneisen started out as a licensed stockbroker in August 1987, a couple of months prior to the historic stock market crash that took the Dow Jones Industrial Average down -22.6% in a single day. He has published daily fact-based fundamental and technical analysis on high-ranked stocks online for two decades. Through FACTBASEDINVESTING.COM, Kenneth provides educational articles, news, market commentary, and other information regarding proven investment systems that work in good times and bad.
Comments contained in the body of this report are technical opinions only and are not necessarily those of Gruneisen Growth Corp. The material herein has been obtained from sources believed to be reliable and accurate, however, its accuracy and completeness cannot be guaranteed. Our firm, employees, and customers may effect transactions, including transactions contrary to any recommendation herein, or have positions in the securities mentioned herein or options with respect thereto. Any recommendation contained in this report may not be suitable for all investors and it is not to be deemed an offer or solicitation on our part with respect to the purchase or sale of any securities. |
|
 |
Financial, Retail, and Tech Sectors Rallying Higher
Kenneth J. Gruneisen - Passed the CAN SLIM® Master's Exam
Financial shares underpinned the major averages' rally as the Bank Index ($BKX +1.07%) and the Broker/Dealer Index ($XBD +1.50%) posted influential gains. The tech sector was led higher by the Semiconductor Index ($SOX +1.92%), while the Internet Index ($IIX +1.29%) and the Networking Index ($NWX +0.82%) followed with smaller gains. The Biotechnology Index ($BTK +0.04%) finished flat. The Retail Index ($RLX +0.79%) rose and the Healthcare Index ($HMO +0.56%) also posted a modest gain. energy-related shares were mixed as the Oil Services Index ($OSX +0.34%) edged higher but the Integrated Oil Index ($XOI -0.29%) fell. The Gold & Silver Index ($XAU -3.56%) was a standout laggard with a big loss on the mostly positive session for growth-oriented groups.
Charts courtesy www.stockcharts.com
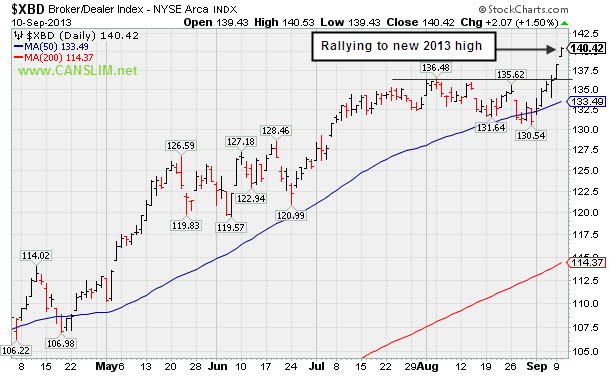
PICTURED: The Broker/Dealer Index ($XBD +1.50%) rallied to a new 52-week high, a reassuring sign of strength from an influential group which has been a reliable "leading indicator" for the broader market.
| Oil Services |
$OSX |
272.41 |
+0.93 |
+0.34% |
+23.73% |
| Healthcare |
$HMO |
3,485.09 |
+19.42 |
+0.56% |
+38.62% |
| Integrated Oil |
$XOI |
1,396.23 |
-4.02 |
-0.29% |
+12.43% |
| Semiconductor |
$SOX |
490.65 |
+9.23 |
+1.92% |
+27.75% |
| Networking |
$NWX |
299.67 |
+2.42 |
+0.82% |
+32.28% |
| Internet |
$IIX |
417.23 |
+5.31 |
+1.29% |
+27.59% |
| Broker/Dealer |
$XBD |
140.42 |
+2.07 |
+1.50% |
+48.86% |
| Retail |
$RLX |
834.79 |
+6.56 |
+0.79% |
+27.83% |
| Gold & Silver |
$XAU |
98.55 |
-3.64 |
-3.56% |
-40.49% |
| Bank |
$BKX |
64.16 |
+0.68 |
+1.07% |
+25.12% |
| Biotech |
$BTK |
2,214.29 |
+0.88 |
+0.04% |
+43.13% |
|
|
|
 |
Consolidating Following New Proposed Public Offering
Kenneth J. Gruneisen - Passed the CAN SLIM® Master's Exam
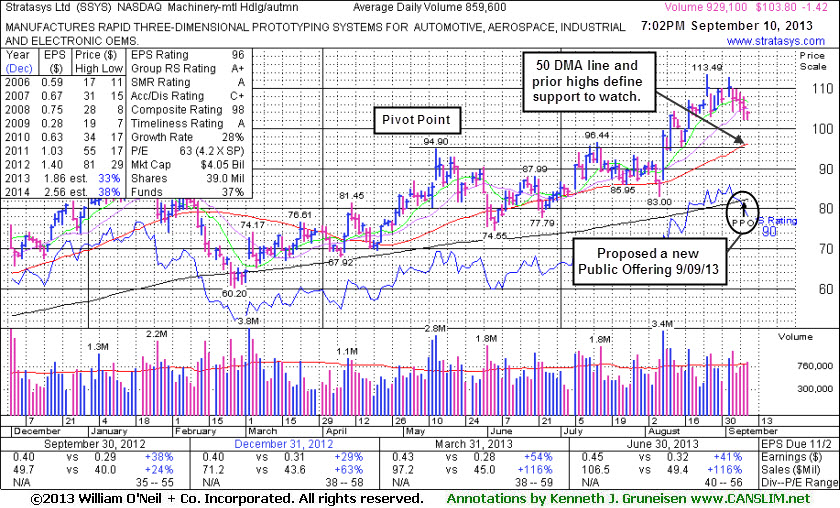
Stratasys Inc (SSYS -$1.42 or -1.35% to $103.80) is extended from a sound base, consolidating well above its 50-day moving average (DMA) line and well above prior highs in the $96 area defining important support. It proposed a new Public Offering on 9/09/13 while perched near all-time highs. Such offerings can often be a short-term hindrance to upward price progress, however underwriters often help companies attract greater institutional ownership interest in the process. Ownership by top-rated funds rose from 246 in Sep '12 to 308 in Jun '13, a reassuring sign concerning the I criteria.
Its Relative Strength Rating has improved to 90, above the 80+ minimum guideline for buy candidates under the fact-based investment system, and up from 86 when last shown in this FSU section on 8/16/13 with an annotated graph under the headline, "Consolidating in Orderly Fashion but Market Shift Raises Caution Flag". The market (M criteria) has also shifted back to a "confirmed uptrend" as noted in the Market Commentary due to solid gains early this week.
The company released financial results for the quarter ended June 30, 2013 showing earnings +41% on +116% sales revenues versus the year ago period. Its strong quarterly earnings history above the +25% minimum guideline satisfies the C criteria. A downturn in its FY '09 earnings was previously noted as a flaw with respect to the investment system's A criteria. It found support near its 200 DMA line during a deep consolidation earlier this year.
|
|
|
Color Codes Explained :
Y - Better candidates highlighted by our
staff of experts.
G - Previously featured
in past reports as yellow but may no longer be buyable under the
guidelines.
***Last / Change / Volume data in this table is the closing quote data***
Symbol/Exchange
Company Name
Industry Group |
PRICE |
CHANGE
(%Change) |
Day High |
Volume
(% DAV)
(% 50 day avg vol) |
52 Wk Hi
% From Hi |
Featured
Date |
Price
Featured |
Pivot Featured |
|
Max Buy |
BITA
-
NYSE
Bitauto Hldgs Ltd Ads
INTERNET - Internet Information Providers
|
$16.10
|
+0.00
0.00% |
$16.75
|
518,798
178.22% of 50 DAV
50 DAV is 291,100
|
$18.10
-11.05%
|
8/7/2013
|
$12.01
|
PP = $13.30
|
|
MB = $13.97
|
 Most Recent Note - 9/10/2013 12:02:16 PM
G - Finished near the session low after early gains had it poised for a best-ever close on the prior session. During its choppy consolidation it found support above its 50 DMA line and prior highs.
>>> The latest Featured Stock Update with an annotated graph appeared on 9/3/2013. Click here.
View all notes |
Alert me of new notes |
CANSLIM.net Company Profile |
SEC |
Zacks Reports |
StockTalk |
News |
Chart |
Request a new note
C
A N
S L
I M


|
CELG
-
NASDAQ
Celgene Corp
DRUGS - Drug Manufacturers - Major
|
$148.74
|
+0.27
0.18% |
$151.00
|
1,961,669
79.11% of 50 DAV
50 DAV is 2,479,800
|
$149.92
-0.78%
|
7/11/2013
|
$133.25
|
PP = $131.92
|
|
MB = $138.52
|
Most Recent Note - 9/4/2013 11:55:25 AM
Y - Building a base-on-base type pattern, it recently found support above prior highs in the $131 area and above its 50 DMA line, important chart support levels.
>>> The latest Featured Stock Update with an annotated graph appeared on 8/21/2013. Click here.
View all notes |
Alert me of new notes |
CANSLIM.net Company Profile |
SEC |
Zacks Reports |
StockTalk |
News |
Chart |
Request a new note
C
A N
S L
I M
|
FLT
-
NYSE
Fleetcor Technologies
DIVERSIFIED SERVICES - Business/Management Services
|
$106.09
|
+2.88
2.79% |
$106.26
|
500,353
83.63% of 50 DAV
50 DAV is 598,300
|
$108.38
-2.11%
|
8/19/2013
|
$99.01
|
PP = $100.97
|
|
MB = $106.02
|
Most Recent Note - 9/6/2013 6:22:32 PM
Y- Consolidating above prior highs after recently rising from an advanced "3-weeks tight" base, albeit a riskier "late stage" base. See the latest FSU analysis for more details and a new annotated graph. Keep in mind the M criteria argues against new buying efforts until a new confirmed rally.
>>> The latest Featured Stock Update with an annotated graph appeared on 9/6/2013. Click here.
View all notes |
Alert me of new notes |
CANSLIM.net Company Profile |
SEC |
Zacks Reports |
StockTalk |
News |
Chart |
Request a new note
C
A N
S L
I M
|
GNRC
-
NYSE
Generac Hldgs Inc
CONSUMER DURABLES - Electronic Equipment
|
$40.63
|
+0.64
1.60% |
$40.67
|
660,571
71.58% of 50 DAV
50 DAV is 922,800
|
$44.30
-8.28%
|
7/30/2013
|
$42.60
|
PP = $42.10
|
|
MB = $44.21
|
Most Recent Note - 9/5/2013 6:51:21 PM
G - Lingering below its 50 DMA line, its color code is changed to green as deterioration raised concerns. Stalled after a recent rally from an advanced "3-weeks tight" base as it priced a Secondary Offering. Disciplined investors always limit losses by selling if any stock falls more than -7% from its purchase price.
>>> The latest Featured Stock Update with an annotated graph appeared on 8/22/2013. Click here.
View all notes |
Alert me of new notes |
CANSLIM.net Company Profile |
SEC |
Zacks Reports |
StockTalk |
News |
Chart |
Request a new note
C
A N
S L
I M
|
KORS
-
NYSE
Michael Kors Hldgs Ltd
RETAIL - Apparel Stores
|
$73.21
|
-2.41
-3.19% |
$76.34
|
5,878,887
165.23% of 50 DAV
50 DAV is 3,558,000
|
$76.74
-4.60%
|
8/6/2013
|
$69.66
|
PP = $66.28
|
|
MB = $69.59
|
Most Recent Note - 9/10/2013 7:39:15 PM
G - Retreated from its high with above average volume behind today's big loss and it finished near the session low. Its 50 DMA line defines support above prior highs in the $66 area.
>>> The latest Featured Stock Update with an annotated graph appeared on 8/29/2013. Click here.
View all notes |
Alert me of new notes |
CANSLIM.net Company Profile |
SEC |
Zacks Reports |
StockTalk |
News |
Chart |
Request a new note
C
A N
S L
I M
|
Symbol/Exchange
Company Name
Industry Group |
PRICE |
CHANGE
(%Change) |
Day High |
Volume
(% DAV)
(% 50 day avg vol) |
52 Wk Hi
% From Hi |
Featured
Date |
Price
Featured |
Pivot Featured |
|
Max Buy |
LOPE
-
NASDAQ
Grand Canyon Education
DIVERSIFIED SERVICES - Education and; Training Services
|
$36.55
|
+0.45
1.25% |
$36.92
|
461,122
109.30% of 50 DAV
50 DAV is 421,900
|
$37.17
-1.67%
|
6/19/2013
|
$31.47
|
PP = $34.17
|
|
MB = $35.88
|
Most Recent Note - 9/5/2013 6:53:55 PM
G - Rose to a best-ever close today and inched nearer to its 52-week high with another gain on light volume. Earnings +15% on +19% sales for the Jun '13 quarter, below the +25% minimum earnings guideline (C criteria), raised fundamental concerns, yet technical action has been somewhat reassuring.
>>> The latest Featured Stock Update with an annotated graph appeared on 8/14/2013. Click here.
View all notes |
Alert me of new notes |
CANSLIM.net Company Profile |
SEC |
Zacks Reports |
StockTalk |
News |
Chart |
Request a new note
C
A N
S L
I M
|
MRLN
-
NASDAQ
Marlin Business Services
DIVERSIFIED SERVICES - Rental and Leasing Services
|
$26.24
|
+0.43
1.67% |
$26.27
|
42,623
142.55% of 50 DAV
50 DAV is 29,900
|
$26.26
-0.08%
|
9/9/2013
|
$25.75
|
PP = $26.07
|
|
MB = $27.37
|
Most Recent Note - 9/9/2013 5:56:52 PM
Y - Highlighted in yellow with new pivot point cited based on its May '13 highs plus 10 cents. Technically, it broke out with a volume-driven gain on 9/05/13. The broader market (M criteria) justifies selective new buying efforts with the market shifting to a confirmed rally. Fundamentals remain strong and it found support near its 200 DMA line since dropped from the Featured Stocks list on 6/21/13. See the latest FSU analysis for more details and a new annotated weekly graph.

>>> The latest Featured Stock Update with an annotated graph appeared on 9/9/2013. Click here.
View all notes |
Alert me of new notes |
CANSLIM.net Company Profile |
SEC |
Zacks Reports |
StockTalk |
News |
Chart |
Request a new note
C
A N
S L
I M
|
PCLN
-
NASDAQ
Priceline.Com Inc
INTERNET - Internet Software and Services
|
$977.50
|
+11.84
1.23% |
$979.93
|
407,507
63.14% of 50 DAV
50 DAV is 645,400
|
$994.98
-1.76%
|
7/8/2013
|
$878.28
|
PP = $847.43
|
|
MB = $889.80
|
Most Recent Note - 9/6/2013 6:15:20 PM
G - Consolidating in an orderly fashion above prior highs, building a new base. Reported earnings +24% on +27% sales revenues for the Jun '13 quarter, just under the +25% minimum earnings guideline (C criteria).
>>> The latest Featured Stock Update with an annotated graph appeared on 8/19/2013. Click here.
View all notes |
Alert me of new notes |
CANSLIM.net Company Profile |
SEC |
Zacks Reports |
StockTalk |
News |
Chart |
Request a new note
C
A N
S L
I M
|
PRAA
-
NASDAQ
Portfolio Recovery Assoc
DIVERSIFIED SERVICES - Business/Management Services
|
$59.31
|
+1.78
3.09% |
$59.34
|
638,762
116.01% of 50 DAV
50 DAV is 550,600
|
$57.57
3.02%
|
7/31/2013
|
$51.43
|
PP = $54.72
|
|
MB = $57.46
|
Most Recent Note - 9/10/2013 7:33:47 PM
G - Hit a new 52-week high and rallied above its "max buy" level with today's 6th consecutive gain and its color code is changed to green. Found support above its 50 DMA line during the latest consolidation.
>>> The latest Featured Stock Update with an annotated graph appeared on 8/28/2013. Click here.
View all notes |
Alert me of new notes |
CANSLIM.net Company Profile |
SEC |
Zacks Reports |
StockTalk |
News |
Chart |
Request a new note
C
A N
S L
I M
|
PRLB
-
NYSE
Proto Labs Inc
MANUFACTURING - Small Tools and Accessories
|
$76.27
|
+2.44
3.30% |
$76.69
|
547,150
130.24% of 50 DAV
50 DAV is 420,100
|
$75.76
0.67%
|
7/29/2013
|
$64.86
|
PP = $67.50
|
|
MB = $70.88
|
Most Recent Note - 9/9/2013 5:51:21 PM
G - Hovering near its all-time high after rallying beyond its "max buy" level. Support to watch is at prior highs and above its 50 DMA line.
>>> The latest Featured Stock Update with an annotated graph appeared on 8/27/2013. Click here.
View all notes |
Alert me of new notes |
CANSLIM.net Company Profile |
SEC |
Zacks Reports |
StockTalk |
News |
Chart |
Request a new note
C
A N
S L
I M
|
Symbol/Exchange
Company Name
Industry Group |
PRICE |
CHANGE
(%Change) |
Day High |
Volume
(% DAV)
(% 50 day avg vol) |
52 Wk Hi
% From Hi |
Featured
Date |
Price
Featured |
Pivot Featured |
|
Max Buy |
QCOR
-
NASDAQ
Questcor Pharmaceuticals
DRUGS - Biotechnology
|
$67.54
|
+0.01
0.01% |
$68.94
|
991,297
58.94% of 50 DAV
50 DAV is 1,681,800
|
$74.76
-9.66%
|
7/31/2013
|
$66.46
|
PP = $59.01
|
|
MB = $61.96
|
Most Recent Note - 9/9/2013 5:52:49 PM
G - Still holding its ground, extended from any sound base. Recent lows in the $64 area define near-term support to watch above its 50 DMA line.
>>> The latest Featured Stock Update with an annotated graph appeared on 8/26/2013. Click here.
View all notes |
Alert me of new notes |
CANSLIM.net Company Profile |
SEC |
Zacks Reports |
StockTalk |
News |
Chart |
Request a new note
C
A N
S L
I M
|
SFUN
-
NYSE
Soufun Hldgs Ltd Ads A
INTERNET - Internet Information Providers
|
$53.51
|
+5.24
10.86% |
$53.77
|
1,488,550
207.06% of 50 DAV
50 DAV is 718,900
|
$50.99
4.94%
|
7/16/2013
|
$29.54
|
PP = $27.90
|
|
MB = $29.30
|
Most Recent Note - 9/10/2013 12:46:10 PM
G - Spiking to new all-time highs with another considerable gain today backed by above average volume. Very extended from any sound base. Recent highs near $42 define initial support to watch on pullbacks.
>>> The latest Featured Stock Update with an annotated graph appeared on 8/30/2013. Click here.
View all notes |
Alert me of new notes |
CANSLIM.net Company Profile |
SEC |
Zacks Reports |
StockTalk |
News |
Chart |
Request a new note
C
A N
S L
I M
|
SSNC
-
NASDAQ
S S & C Technologies
COMPUTER SOFTWARE and SERVICES - Application Software
|
$37.99
|
+1.49
4.08% |
$38.15
|
818,658
196.37% of 50 DAV
50 DAV is 416,900
|
$38.80
-2.09%
|
9/5/2013
|
$36.01
|
PP = $38.90
|
|
MB = $40.85
|
Most Recent Note - 9/10/2013 7:35:28 PM
Y - Rallied for a solid gain with 2 times average volume today while approaching a new pivot point cited based on its 8/02/13 high plus 10 cents. Subsequent volume-driven gains may trigger a new buy signal.
>>> The latest Featured Stock Update with an annotated graph appeared on 9/5/2013. Click here.
View all notes |
Alert me of new notes |
CANSLIM.net Company Profile |
SEC |
Zacks Reports |
StockTalk |
News |
Chart |
Request a new note
C
A N
S L
I M
|
SSYS
-
NASDAQ
Stratasys Ltd
COMPUTER HARDWARE - Computer Peripherals
|
$103.80
|
-1.42
-1.35% |
$104.40
|
929,238
108.10% of 50 DAV
50 DAV is 859,600
|
$113.49
-8.54%
|
7/8/2013
|
$91.44
|
PP = $95.00
|
|
MB = $99.75
|
Most Recent Note - 9/10/2013 7:36:54 PM
G - Proposed a new Public Offering on 9/09/13 perched near all-time highs. See the latest FSU analysis for more details and a new annotated graph.
>>> The latest Featured Stock Update with an annotated graph appeared on 9/10/2013. Click here.
View all notes |
Alert me of new notes |
CANSLIM.net Company Profile |
SEC |
Zacks Reports |
StockTalk |
News |
Chart |
Request a new note
C
A N
S L
I M
|
STMP
-
NASDAQ
Stamps.Com Inc
INTERNET - Internet Software and Services
|
$44.07
|
+0.25
0.57% |
$44.56
|
121,457
91.94% of 50 DAV
50 DAV is 132,100
|
$46.47
-5.16%
|
7/31/2013
|
$40.00
|
PP = $42.98
|
|
MB = $45.13
|
Most Recent Note - 9/6/2013 6:19:38 PM
Y - Posted a 7th consecutive gain today and ended at a best-ever close. Recently found encouraging support at its 50 DMA line.
>>> The latest Featured Stock Update with an annotated graph appeared on 8/23/2013. Click here.
View all notes |
Alert me of new notes |
CANSLIM.net Company Profile |
SEC |
Zacks Reports |
StockTalk |
News |
Chart |
Request a new note
C
A N
S L
I M
|
Symbol/Exchange
Company Name
Industry Group |
PRICE |
CHANGE
(%Change) |
Day High |
Volume
(% DAV)
(% 50 day avg vol) |
52 Wk Hi
% From Hi |
Featured
Date |
Price
Featured |
Pivot Featured |
|
Max Buy |
TBBK
-
NASDAQ
Bancorp Inc
BANKING - Regional - Mid-Atlantic Banks
|
$17.94
|
+0.57
3.28% |
$17.97
|
457,201
295.73% of 50 DAV
50 DAV is 154,600
|
$17.51
2.46%
|
9/4/2013
|
$16.26
|
PP = $16.79
|
|
MB = $17.63
|
Most Recent Note - 9/10/2013 12:49:04 PM
G - Hitting another new 52-week high today with its 8th consecutive gain and its color code is changed to green after rallying beyond its "max buy" level. Triggered a technical buy signal with a breakout gain on 3 times average volume on 9/05/13, rising from an 8-week base. Prior highs define important near-term support to watch on pullbacks. An annotated graph and more details were included in the FSU section on 9/04/13 under the headline, "Forming Sound Set-Up While "M" Correction Remains Overriding Concern".
>>> The latest Featured Stock Update with an annotated graph appeared on 9/4/2013. Click here.
View all notes |
Alert me of new notes |
CANSLIM.net Company Profile |
SEC |
Zacks Reports |
StockTalk |
News |
Chart |
Request a new note
C
A N
S L
I M
|
VRX
-
NYSE
Valeant Pharmaceuticals
DRUGS - Drug Manufacturers - Other
|
$100.20
|
-1.13
-1.12% |
$101.74
|
958,879
76.63% of 50 DAV
50 DAV is 1,251,300
|
$105.40
-4.93%
|
4/30/2013
|
$60.24
|
PP = $76.66
|
|
MB = $80.49
|
Most Recent Note - 9/4/2013 6:22:29 PM
G- Holding its ground -5.2% off its 52-week high and recent insider buying while trading near its highs has been noted as an encouraging sign. Reported earnings +33% on +34% sales revenues for the Jun '13 quarter, above the +25% minimum earnings guideline (C criteria).
>>> The latest Featured Stock Update with an annotated graph appeared on 8/15/2013. Click here.
View all notes |
Alert me of new notes |
CANSLIM.net Company Profile |
SEC |
Zacks Reports |
StockTalk |
News |
Chart |
Request a new note
C
A N
S L
I M
|
YNDX
-
NASDAQ
Yandex N V Class A
INTERNET - Internet Information Providers
|
$35.00
|
-0.17
-0.48% |
$35.88
|
2,561,629
104.14% of 50 DAV
50 DAV is 2,459,900
|
$35.36
-1.02%
|
9/5/2013
|
$34.24
|
PP = $34.79
|
|
MB = $36.53
|
Most Recent Note - 9/9/2013 5:48:44 PM
Y - Rallied to a best-ever close and a new 52-week high with today's gain lacking great volume conviction. Found support at its 50 DMA line, important near-term support to watch. It did not form a base of sufficient length, however its color code was changed to yellow while a valid secondary buy point exists up to +5% above its prior high.
>>> The latest Featured Stock Update with an annotated graph appeared on 8/20/2013. Click here.
View all notes |
Alert me of new notes |
CANSLIM.net Company Profile |
SEC |
Zacks Reports |
StockTalk |
News |
Chart |
Request a new note
C
A N
S L
I M
|
|
|
|
THESE ARE NOT BUY RECOMMENDATIONS!
Comments contained in the body of this report are technical
opinions only. The material herein has been obtained
from sources believed to be reliable and accurate, however,
its accuracy and completeness cannot be guaranteed.
This site is not an investment advisor, hence it does
not endorse or recommend any securities or other investments.
Any recommendation contained in this report may not
be suitable for all investors and it is not to be deemed
an offer or solicitation on our part with respect to
the purchase or sale of any securities. All trademarks,
service marks and trade names appearing in this report
are the property of their respective owners, and are
likewise used for identification purposes only.
This report is a service available
only to active Paid Premium Members.
You may opt-out of receiving report notifications
at any time. Questions or comments may be submitted
by writing to Premium Membership Services 665 S.E. 10 Street, Suite 201 Deerfield Beach, FL 33441-5634 or by calling 1-800-965-8307
or 954-785-1121.
|
|
|

