Symbol/Exchange
Company Name
Industry Group |
PRICE |
CHANGE
(%Change) |
Day High |
Volume
(% DAV)
(% 50 day avg vol) |
52 Wk Hi
% From Hi |
Featured
Date |
Price
Featured |
Pivot Featured |
|
Max Buy |
ABV
-
NYSE
Comp De Bebidas Adr
FOOD and BEVERAGE - Beverages - Brewers
|
$115.34
|
+0.41
0.36% |
$115.73
|
496,842
76.24% of 50 DAV
50 DAV is 651,700
|
$115.55
-0.18%
|
6/29/2010
|
$104.74
|
PP = $109.33
|
|
MB = $114.80
|
Most Recent Note - 9/8/2010 4:49:51 PM
G - This Brazil-based beverage firm rallied to a new all-time high with today's gain on near average volume. Prior highs in the $111-112 area define support above its 50 DMA line.
>>> The latest Featured Stock Update with an annotated graph appeared on 8/18/2010. Click here.
View all notes |
Alert me of new notes |
CANSLIM.net Company Profile |
SEC |
Zacks Reports |
StockTalk |
News |
Chart |
Request a new note
C
A N
S L
I M


|
ARUN
-
NASDAQ
Aruba Networks Inc
COMPUTER HARDWARE - Networking andamp; Communication Dev
|
$19.68
|
+0.13
0.66% |
$19.86
|
1,673,235
92.02% of 50 DAV
50 DAV is 1,818,400
|
$20.05
-1.85%
|
8/30/2010
|
$18.12
|
PP = $18.51
|
|
MB = $19.44
|
Most Recent Note - 9/8/2010 4:51:04 PM
G - Hit another new 52-week high after gapping up today. Its color code was changed to green after getting extended from its latest base. Prior highs near $18 define chart support to watch.
>>> The latest Featured Stock Update with an annotated graph appeared on 9/2/2010. Click here.
View all notes |
Alert me of new notes |
CANSLIM.net Company Profile |
SEC |
Zacks Reports |
StockTalk |
News |
Chart |
Request a new note
C
A N
S L
I M
|
BIDU
-
NASDAQ
Baidu Inc Ads
INTERNET - Internet Information Providers
|
$84.33
|
+0.50
0.60% |
$84.33
|
3,987,680
38.52% of 50 DAV
50 DAV is 10,352,400
|
$88.32
-4.52%
|
7/14/2010
|
$75.03
|
PP = $78.59
|
|
MB = $82.52
|
Most Recent Note - 9/8/2010 4:53:19 PM
Y - Light volume trading continues while the recent rally from its 10-week average may be considered a secondary buy point. However, it may be considered "late-stage" and riskier than fresh technical breakouts.
>>> The latest Featured Stock Update with an annotated graph appeared on 8/13/2010. Click here.
View all notes |
Alert me of new notes |
CANSLIM.net Company Profile |
SEC |
Zacks Reports |
StockTalk |
News |
Chart |
Request a new note
C
A N
S L
I M
|
CACC
-
NASDAQ
Credit Acceptance Corp
FINANCIAL SERVICES - Credit Services
|
$59.81
|
+0.29
0.49% |
$59.90
|
16,183
32.24% of 50 DAV
50 DAV is 50,200
|
$61.41
-2.61%
|
7/29/2010
|
$52.04
|
PP = $54.07
|
|
MB = $56.77
|
Most Recent Note - 9/8/2010 4:56:22 PM
G - Consolidating in a tight trading range with volume totals cooling. Perched -3% off its 52-week high, well above its 50 DMA and old highs near $54 that define support.
>>> The latest Featured Stock Update with an annotated graph appeared on 8/2/2010. Click here.
View all notes |
Alert me of new notes |
CANSLIM.net Company Profile |
SEC |
Zacks Reports |
StockTalk |
News |
Chart |
Request a new note
C
A N
S L
I M
|
CMG
-
NYSE
Chipotle Mexican Grill
LEISURE - Restaurants
|
$166.01
|
+3.19
1.96% |
$167.26
|
596,638
83.39% of 50 DAV
50 DAV is 715,500
|
$167.04
-0.62%
|
9/1/2010
|
$158.31
|
PP = $155.52
|
|
MB = $163.30
|
 Most Recent Note - 9/10/2010 3:58:04 PM
G - Gain today with below average volume, closing above its "max buy" level, and its color code is changed to green again. Technically, it broke out on 9/01/10, rallying to multi-year highs with a considerable gain backed 2 times average volume.
>>> The latest Featured Stock Update with an annotated graph appeared on 9/1/2010. Click here.
View all notes |
Alert me of new notes |
CANSLIM.net Company Profile |
SEC |
Zacks Reports |
StockTalk |
News |
Chart |
Request a new note
C
A N
S L
I M
|
Symbol/Exchange
Company Name
Industry Group |
PRICE |
CHANGE
(%Change) |
Day High |
Volume
(% DAV)
(% 50 day avg vol) |
52 Wk Hi
% From Hi |
Featured
Date |
Price
Featured |
Pivot Featured |
|
Max Buy |
CRM
-
NYSE
Salesforce.Com Inc
INTERNET - Internet Software and Services
|
$117.42
|
-0.23
-0.20% |
$119.37
|
2,371,956
89.27% of 50 DAV
50 DAV is 2,657,000
|
$122.00
-3.75%
|
6/2/2010
|
$88.44
|
PP = $89.60
|
|
MB = $94.08
|
Most Recent Note - 9/9/2010 6:21:09 PM
G - Pulling back today after early gains for a new all-time high. It is extended from a sound base, not currently buyable under the investment system guidelines.
>>> The latest Featured Stock Update with an annotated graph appeared on 8/16/2010. Click here.
View all notes |
Alert me of new notes |
CANSLIM.net Company Profile |
SEC |
Zacks Reports |
StockTalk |
News |
Chart |
Request a new note
C
A N
S L
I M
|
EGO
-
NYSE
Eldorado Gold Corp
METALS and MINING - Gold
|
$18.98
|
-0.05
-0.26% |
$19.23
|
3,061,170
73.29% of 50 DAV
50 DAV is 4,176,600
|
$20.06
-5.38%
|
8/19/2010
|
$18.25
|
PP = $19.17
|
|
MB = $20.13
|
Most Recent Note - 9/8/2010 5:23:54 PM
Y - Holding its ground above its pivot point yet below its "max buy" level after recent volume-driven gains.
>>> The latest Featured Stock Update with an annotated graph appeared on 8/19/2010. Click here.
View all notes |
Alert me of new notes |
CANSLIM.net Company Profile |
SEC |
Zacks Reports |
StockTalk |
News |
Chart |
Request a new note
C
A N
S L
I M
|
FFIV
-
NASDAQ
F 5 Networks Inc
INTERNET - Internet Software and Services
|
$94.15
|
-1.58
-1.65% |
$95.63
|
1,469,692
88.13% of 50 DAV
50 DAV is 1,667,700
|
$98.01
-3.94%
|
6/16/2010
|
$74.50
|
PP = $74.10
|
|
MB = $77.81
|
Most Recent Note - 9/10/2010 3:56:07 PM
G - Consolidating after hitting a new all-time high on the prior session. Upward trendline connecting July-August lows defines an initial chart support level well above its 50 DMA line.
>>> The latest Featured Stock Update with an annotated graph appeared on 8/4/2010. Click here.
View all notes |
Alert me of new notes |
CANSLIM.net Company Profile |
SEC |
Zacks Reports |
StockTalk |
News |
Chart |
Request a new note
C
A N
S L
I M
|
FOSL
-
NASDAQ
Fossil Inc
CONSUMER DURABLES - Recreational Goods, Other
|
$50.39
|
-0.46
-0.90% |
$50.91
|
519,077
66.78% of 50 DAV
50 DAV is 777,300
|
$51.20
-1.58%
|
8/10/2010
|
$45.54
|
PP = $42.69
|
|
MB = $44.82
|
Most Recent Note - 9/8/2010 5:26:57 PM
G - Perched at an all-time high, extended from any sound base after a recent streak of gains. Prior high in the $46 area defines support to watch.
>>> The latest Featured Stock Update with an annotated graph appeared on 8/11/2010. Click here.
View all notes |
Alert me of new notes |
CANSLIM.net Company Profile |
SEC |
Zacks Reports |
StockTalk |
News |
Chart |
Request a new note
C
A N
S L
I M
|
GMCR
-
NASDAQ
Green Mtn Coffee Roastrs
FOOD and BEVERAGE - Processed and Packaged Goods
|
$34.19
|
+0.05
0.15% |
$34.48
|
1,567,802
68.69% of 50 DAV
50 DAV is 2,282,400
|
$34.98
-2.26%
|
8/17/2010
|
$33.62
|
PP = $33.30
|
|
MB = $34.97
|
Most Recent Note - 9/9/2010 12:43:34 PM
Y - Gapped up today and hit another new all-time high. GMCR rallied on nearly 3 times average volume upon news it will hike prices on its K-Cup portion packs, yet it was noted on 9/08/10 - "It failed to close above the high of the handle ($33.98) which may be considered a more valid pivot point than the one previously cited (based on its 4/01/10 high plus ten cents). Confirming gains would be a reassuring sign in the days ahead."
>>> The latest Featured Stock Update with an annotated graph appeared on 8/17/2010. Click here.
View all notes |
Alert me of new notes |
CANSLIM.net Company Profile |
SEC |
Zacks Reports |
StockTalk |
News |
Chart |
Request a new note
C
A N
S L
I M
|
Symbol/Exchange
Company Name
Industry Group |
PRICE |
CHANGE
(%Change) |
Day High |
Volume
(% DAV)
(% 50 day avg vol) |
52 Wk Hi
% From Hi |
Featured
Date |
Price
Featured |
Pivot Featured |
|
Max Buy |
HS
-
NYSE
Healthspring Inc
HEALTH SERVICES - Health Care Plans
|
$23.28
|
+0.36
1.57% |
$23.29
|
554,235
90.81% of 50 DAV
50 DAV is 610,300
|
$23.36
-0.34%
|
8/27/2010
|
$19.91
|
PP = $19.75
|
|
MB = $20.74
|
Most Recent Note - 9/8/2010 5:36:32 PM
G - Hit another new 52-week high today and challenged its 2008 high. Extended from its prior base, support to watch now is prior chart highs in the $19-20 area.
>>> The latest Featured Stock Update with an annotated graph appeared on 8/27/2010. Click here.
View all notes |
Alert me of new notes |
CANSLIM.net Company Profile |
SEC |
Zacks Reports |
StockTalk |
News |
Chart |
Request a new note
C
A N
S L
I M
|
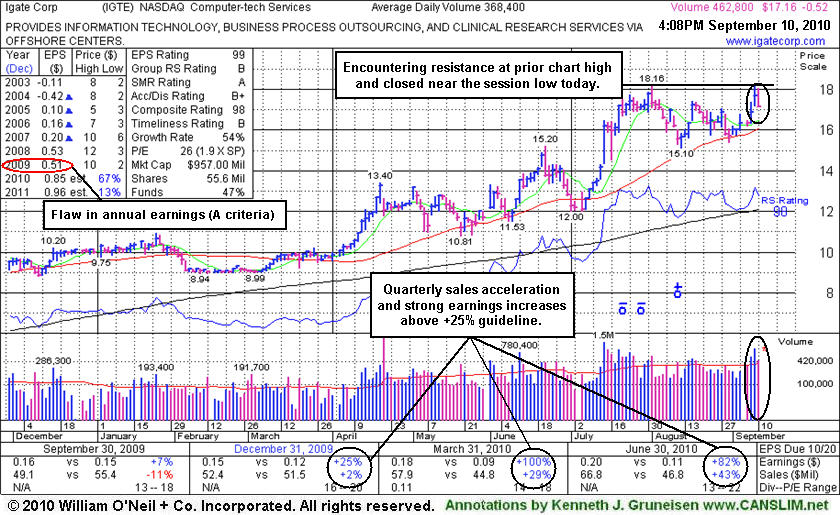
IGTE
-
NASDAQ
Igate Corp
COMPUTER SOFTWARE and SERVICES - Information Technology Service
|
$17.16
|
-0.52
-2.94% |
$18.02
|
463,045
130.25% of 50 DAV
50 DAV is 355,500
|
$18.23
-5.86%
|
9/8/2010
|
$17.29
|
PP = $18.26
|
|
MB = $19.17
|
Most Recent Note - 9/10/2010 1:05:16 PM
Y - Trading above average volume, churning near its 52-week high, the heavier volume and lack of meaningful price progress above its pivot point is considered a sign of distributional pressure. Color code was changed to yellow as it met the 9/08/10 mid-day report screening criteria (read here), identifying it as an ideal leader for investors' watchlists. This high-ranked Fremont, CA-based firm built an orderly new base, however, it is a riskier "late-stage" base. Another concern was noted in prior mid-day reports -"The downturn in FY '09 earnings hurts its annual earnings (A criteria) track record."
>>> The latest Featured Stock Update with an annotated graph appeared on 9/10/2010. Click here.
View all notes |
Alert me of new notes |
CANSLIM.net Company Profile |
SEC |
Zacks Reports |
StockTalk |
News |
Chart |
Request a new note
C
A N
S L
I M
|
MELI
-
NASDAQ
Mercadolibre Inc
INTERNET - Internet Software and; Services
|
$72.51
|
+1.25
1.75% |
$72.67
|
579,909
64.87% of 50 DAV
50 DAV is 893,900
|
$73.00
-0.67%
|
5/13/2010
|
$54.21
|
PP = $55.85
|
|
MB = $58.64
|
Most Recent Note - 9/10/2010 3:59:47 PM
G - Gain today on light volume for another new high close, wedging higher and getting extended from a sound base. Prior highs in the $62 area and its 50 DMA line define chart support.
>>> The latest Featured Stock Update with an annotated graph appeared on 8/26/2010. Click here.
View all notes |
Alert me of new notes |
CANSLIM.net Company Profile |
SEC |
Zacks Reports |
StockTalk |
News |
Chart |
Request a new note
C
A N
S L
I M
|
MRX
-
NYSE
Medicis Pharmaceut Cl A
DRUGS - Biotechnology
|
$28.60
|
-0.13
-0.45% |
$28.79
|
1,424,275
118.09% of 50 DAV
50 DAV is 1,206,100
|
$30.00
-4.67%
|
8/12/2010
|
$26.88
|
PP = $26.71
|
|
MB = $28.05
|
Most Recent Note - 9/10/2010 4:00:35 PM
G - Pulling back from its 52-week high with a 4th consecutive small loss today with near average volume. Prior highs in the $28 area define an initial chart support level to watch.
>>> The latest Featured Stock Update with an annotated graph appeared on 8/12/2010. Click here.
View all notes |
Alert me of new notes |
CANSLIM.net Company Profile |
SEC |
Zacks Reports |
StockTalk |
News |
Chart |
Request a new note
C
A N
S L
I M
|
MWIV
-
NASDAQ
M W I Veterinary Supply
HEALTH SERVICES - Medical Instruments and; Supplies
|
$52.60
|
-1.35
-2.50% |
$53.93
|
46,705
62.94% of 50 DAV
50 DAV is 74,200
|
$55.93
-5.95%
|
7/29/2010
|
$52.05
|
PP = $52.09
|
|
MB = $54.69
|
Most Recent Note - 9/10/2010 3:54:03 PM
Y - Today marks a 4th consecutive small loss on very light volume, quietly consolidating under its "max buy" level yet above its pivot point. Color code was changed to yellow. Recent lows in the $46 area define an important chart support level.
>>> The latest Featured Stock Update with an annotated graph appeared on 9/7/2010. Click here.
View all notes |
Alert me of new notes |
CANSLIM.net Company Profile |
SEC |
Zacks Reports |
StockTalk |
News |
Chart |
Request a new note
C
A N
S L
I M
|
Symbol/Exchange
Company Name
Industry Group |
PRICE |
CHANGE
(%Change) |
Day High |
Volume
(% DAV)
(% 50 day avg vol) |
52 Wk Hi
% From Hi |
Featured
Date |
Price
Featured |
Pivot Featured |
|
Max Buy |
NEM
-
NYSE
Newmont Mining Corp
METALS and MINING - Gold
|
$60.68
|
+0.46
0.76% |
$61.13
|
3,270,889
47.72% of 50 DAV
50 DAV is 6,853,800
|
$63.38
-4.26%
|
8/31/2010
|
$61.32
|
PP = $63.48
|
|
MB = $66.65
|
Most Recent Note - 9/9/2010 6:26:08 PM
Y - Down again today with light volume. Disciplined investors will watch for a confirming gain above its latest pivot with heavy volume. Recent leadership in the Mining - Gold/Silver/Gems group (L criteria) is a nice reassurance.
>>> The latest Featured Stock Update with an annotated graph appeared on 8/6/2010. Click here.
View all notes |
Alert me of new notes |
CANSLIM.net Company Profile |
SEC |
Zacks Reports |
StockTalk |
News |
Chart |
Request a new note
C
A N
S L
I M
|
NEOG
-
NASDAQ
Neogen Corp
DRUGS - Diagnostic Substances
|
$31.15
|
+0.04
0.13% |
$31.63
|
51,881
53.93% of 50 DAV
50 DAV is 96,200
|
$32.42
-3.92%
|
9/1/2010
|
$30.79
|
PP = $30.49
|
|
MB = $32.01
|
Most Recent Note - 9/9/2010 6:27:19 PM
Y- Reversed into the red after an early gain today for a new all-time high. Technically, its 9/01/10 gain above the new pivot point cited triggered a buy signal after an orderly 5-week base-on-base pattern.
>>> The latest Featured Stock Update with an annotated graph appeared on 8/20/2010. Click here.
View all notes |
Alert me of new notes |
CANSLIM.net Company Profile |
SEC |
Zacks Reports |
StockTalk |
News |
Chart |
Request a new note
C
A N
S L
I M
|
NFLX
-
NASDAQ
Netflix Inc
SPECIALTY RETAIL - Music and Video Stores
|
$146.16
|
+0.48
0.33% |
$146.87
|
2,638,393
55.88% of 50 DAV
50 DAV is 4,721,900
|
$149.74
-2.39%
|
8/10/2010
|
$124.05
|
PP = $124.00
|
|
MB = $130.20
|
Most Recent Note - 9/8/2010 5:57:42 PM
G- Hit another new all-time high today with its 6th consecutive gain. No resistance remains to hinder its progress. It has risen beyond its "max buy" level after holding its ground and finding recent support near its pivot point.
>>> The latest Featured Stock Update with an annotated graph appeared on 8/10/2010. Click here.
View all notes |
Alert me of new notes |
CANSLIM.net Company Profile |
SEC |
Zacks Reports |
StockTalk |
News |
Chart |
Request a new note
C
A N
S L
I M
|
NTAP
-
NASDAQ
Netapp Inc
COMPUTER HARDWARE - Data Storage Devices
|
$46.33
|
+0.00
0.00% |
$46.77
|
6,294,618
86.32% of 50 DAV
50 DAV is 7,292,200
|
$47.89
-3.26%
|
9/8/2010
|
$46.98
|
PP = $44.99
|
|
MB = $47.24
|
Most Recent Note - 9/9/2010 1:16:40 PM
Y - Hit another new 52-week high today. It closed strong on 9/08/10, rising from an ascending base type pattern with volume nearly 2 times average triggering a technical buy signal. It was featured in the 9/08/10 mid-day report in yellow with pivot point based on its 52-week high plus ten cents. Recent quarterly comparisons (C criteria) showed accelerating sales revenues and strong earnings increases, but a down turn in its FY '09 earnings is a concern with respect to its annual earnings (A criteria) history.
>>> The latest Featured Stock Update with an annotated graph appeared on 9/8/2010. Click here.
View all notes |
Alert me of new notes |
CANSLIM.net Company Profile |
SEC |
Zacks Reports |
StockTalk |
News |
Chart |
Request a new note
C
A N
S L
I M
|
PAY
-
NYSE
Verifone Systems Inc
COMPUTER HARDWARE - Transaction Automation Systems
|
$26.61
|
+0.30
1.14% |
$26.73
|
588,600
46.47% of 50 DAV
50 DAV is 1,266,700
|
$27.10
-1.81%
|
8/25/2010
|
$24.30
|
PP = $23.74
|
|
MB = $24.93
|
Most Recent Note - 9/10/2010 3:52:07 PM
G - Held its ground this week, poised today to mark a new 52-week high close. Disciplined investors may watch for chances to accumulate shares on pullbacks toward prior highs in the $23 area defining chart support.
>>> The latest Featured Stock Update with an annotated graph appeared on 8/30/2010. Click here.
View all notes |
Alert me of new notes |
CANSLIM.net Company Profile |
SEC |
Zacks Reports |
StockTalk |
News |
Chart |
Request a new note
C
A N
S L
I M
|
Symbol/Exchange
Company Name
Industry Group |
PRICE |
CHANGE
(%Change) |
Day High |
Volume
(% DAV)
(% 50 day avg vol) |
52 Wk Hi
% From Hi |
Featured
Date |
Price
Featured |
Pivot Featured |
|
Max Buy |
ROVI
-
NASDAQ
Rovi Corp
COMPUTER SOFTWARE andamp; SERVICES - Security Software andamp; Services
|
$44.00
|
+0.03
0.07% |
$44.50
|
882,841
76.18% of 50 DAV
50 DAV is 1,158,900
|
$45.47
-3.23%
|
8/31/2010
|
$43.31
|
PP = $45.06
|
|
MB = $47.31
|
Most Recent Note - 9/8/2010 6:23:59 PM
Y - Technically, it has not broken out from the recently noted base-on-base type pattern. It spiked to a new 52-week high today, then encountered distributional pressure and closed the session below its pivot point in the middle of its intra-day range.
>>> The latest Featured Stock Update with an annotated graph appeared on 8/24/2010. Click here.
View all notes |
Alert me of new notes |
CANSLIM.net Company Profile |
SEC |
Zacks Reports |
StockTalk |
News |
Chart |
Request a new note
C
A N
S L
I M
|
SHOO
-
NASDAQ
Steven Madden Limited
CONSUMER NON-DURABLES - Textile - Apparel Footwear
|
$36.33
|
-0.01
-0.03% |
$36.77
|
108,272
25.34% of 50 DAV
50 DAV is 427,200
|
$40.98
-11.35%
|
8/5/2010
|
$39.55
|
PP = $41.08
|
|
MB = $43.13
|
Most Recent Note - 9/8/2010 6:25:48 PM
Y - Volume totals have cooled while recently consolidating. Color code was changed to yellow, and subsequent gains above the pivot point previously cited are still needed to confirm a proper technical buy signal.
>>> The latest Featured Stock Update with an annotated graph appeared on 8/5/2010. Click here.
View all notes |
Alert me of new notes |
CANSLIM.net Company Profile |
SEC |
Zacks Reports |
StockTalk |
News |
Chart |
Request a new note
C
A N
S L
I M
|
SLW
-
NYSE
Silver Wheaton Corp
METALS and; MINING - Silver
|
$23.89
|
+0.64
2.75% |
$23.98
|
5,351,723
114.47% of 50 DAV
50 DAV is 4,675,300
|
$24.72
-3.36%
|
8/25/2010
|
$21.40
|
PP = $21.99
|
|
MB = $23.09
|
Most Recent Note - 9/10/2010 4:02:36 PM
G - Held its ground for the week after enduring distributional pressure. Extended from a sound base, the previous highs in the $21 area are now a support level to watch.
>>> The latest Featured Stock Update with an annotated graph appeared on 8/25/2010. Click here.
View all notes |
Alert me of new notes |
CANSLIM.net Company Profile |
SEC |
Zacks Reports |
StockTalk |
News |
Chart |
Request a new note
C
A N
S L
I M
|
UA
-
NYSE
Under Armour Inc Cl A
CONSUMER NON-DURABLES - Textile - Apparel Clothing
|
$39.89
|
+0.29
0.73% |
$40.68
|
665,471
97.02% of 50 DAV
50 DAV is 685,900
|
$40.38
-1.21%
|
9/9/2010
|
$39.99
|
PP = $40.10
|
|
MB = $42.11
|
Most Recent Note - 9/10/2010 4:04:57 PM
Y - Today was its 8th consecutive gain since finding recent support near its 50 DMA line. A gain with substantial volume could confirm a technical buy signal. Recent quarters show improving sales revenues growth and big earnings increases following weaker comparisons. The downward turn in annual earnings (A criteria) in FY '08 remains a fundamental concern with respect to the fact-based investment system.
>>> The latest Featured Stock Update with an annotated graph appeared on 9/9/2010. Click here.
View all notes |
Alert me of new notes |
CANSLIM.net Company Profile |
SEC |
Zacks Reports |
StockTalk |
News |
Chart |
Request a new note
C
A N
S L
I M
|
ULTA
-
NASDAQ
Ulta Salon Cosm & Frag
SPECIALTY RETAIL - Specialty Retail, Other
|
$26.21
|
-0.14
-0.53% |
$26.87
|
363,746
58.53% of 50 DAV
50 DAV is 621,500
|
$26.96
-2.78%
|
9/3/2010
|
$26.36
|
PP = $25.89
|
|
MB = $27.18
|
Most Recent Note - 9/8/2010 6:29:40 PM
Y - Gain today for a new 52-week high, still trading under is "max buy" level. Color code was changed to yellow with new pivot point cited when featured again in the 9/03/10 mid-day report.
>>> The latest Featured Stock Update with an annotated graph appeared on 9/3/2010. Click here.
View all notes |
Alert me of new notes |
CANSLIM.net Company Profile |
SEC |
Zacks Reports |
StockTalk |
News |
Chart |
Request a new note
C
A N
S L
I M
|
Symbol/Exchange
Company Name
Industry Group |
PRICE |
CHANGE
(%Change) |
Day High |
Volume
(% DAV)
(% 50 day avg vol) |
52 Wk Hi
% From Hi |
Featured
Date |
Price
Featured |
Pivot Featured |
|
Max Buy |
VIT
-
NYSE
Vanceinfo Tech Inc Ads
COMPUTER SOFTWARE and SERVICES - Business Software and Services
|
$29.57
|
-0.16
-0.54% |
$30.00
|
598,948
107.17% of 50 DAV
50 DAV is 558,900
|
$30.50
-3.05%
|
7/8/2010
|
$25.20
|
PP = $26.58
|
|
MB = $27.91
|
Most Recent Note - 9/8/2010 6:34:11 PM
G - Posted a 4th consecutive gain today with light volume for another new high. Patient investors may watch for secondary buy points. Recent gains lifted it more than +5% above its old chart highs.
>>> The latest Featured Stock Update with an annotated graph appeared on 8/31/2010. Click here.
View all notes |
Alert me of new notes |
CANSLIM.net Company Profile |
SEC |
Zacks Reports |
StockTalk |
News |
Chart |
Request a new note
C
A N
S L
I M
|
WCRX
-
NASDAQ
Warner Chilcott Plc
DRUGS - Drug Manufacturers - Other
|
$22.03
|
+0.40
1.85% |
$22.19
|
2,007,230
124.85% of 50 DAV
50 DAV is 1,607,700
|
$30.57
-27.94%
|
8/23/2010
|
$29.54
|
PP = $29.34
|
|
MB = $30.81
|
Most Recent Note - 9/9/2010 6:53:33 PM
Y - Volume was heavy today as it rallied to a new all-time high. Price data will be adjusted to account for a "quirky" dividend effective as of today's trading. WCRX was featured in yellow in the mid-day report on 8/23/10 rising from a cup shaped base.
>>> The latest Featured Stock Update with an annotated graph appeared on 8/23/2010. Click here.
View all notes |
Alert me of new notes |
CANSLIM.net Company Profile |
SEC |
Zacks Reports |
StockTalk |
News |
Chart |
Request a new note
C
A N
S L
I M
|