***Last / Change / Volume data in this table is the closing quote data***
Symbol/Exchange
Company Name
Industry Group |
PRICE |
CHANGE
(%Change) |
Day High |
Volume
(% DAV)
(% 50 day avg vol) |
52 Wk Hi
% From Hi |
Featured
Date |
Price
Featured |
Pivot Featured |
|
Max Buy |
ABV
-
NYSE
Comp De Bebidas Adr
FOOD and BEVERAGE - Beverages - Brewers
|
$114.91
|
+1.56
1.38% |
$115.55
|
718,194
110.61% of 50 DAV
50 DAV is 649,300
|
$114.37
0.47%
|
6/29/2010
|
$104.74
|
PP = $109.33
|
|
MB = $114.80
|
 Most Recent Note - 9/8/2010 4:49:51 PM
G - This Brazil-based beverage firm rallied to a new all-time high with today's gain on near average volume. Prior highs in the $111-112 area define support above its 50 DMA line.
>>> The latest Featured Stock Update with an annotated graph appeared on 8/18/2010. Click here.
View all notes |
Alert me of new notes |
CANSLIM.net Company Profile |
SEC |
Zacks Reports |
StockTalk |
News |
Chart |
Request a new note
C
A N
S L
I M


|
ARUN
-
NASDAQ
Aruba Networks Inc
COMPUTER HARDWARE - Networking andamp; Communication Dev
|
$19.68
|
+0.25
1.29% |
$20.01
|
2,033,635
112.82% of 50 DAV
50 DAV is 1,802,500
|
$19.92
-1.18%
|
8/30/2010
|
$18.12
|
PP = $18.51
|
|
MB = $19.44
|
Most Recent Note - 9/8/2010 4:51:04 PM
G - Hit another new 52-week high after gapping up today. Its color code was changed to green after getting extended from its latest base. Prior highs near $18 define chart support to watch.
>>> The latest Featured Stock Update with an annotated graph appeared on 9/2/2010. Click here.
View all notes |
Alert me of new notes |
CANSLIM.net Company Profile |
SEC |
Zacks Reports |
StockTalk |
News |
Chart |
Request a new note
C
A N
S L
I M
|
BIDU
-
NASDAQ
Baidu Inc Ads
INTERNET - Internet Information Providers
|
$84.19
|
+1.92
2.33% |
$84.43
|
6,490,580
62.32% of 50 DAV
50 DAV is 10,415,600
|
$88.32
-4.68%
|
7/14/2010
|
$75.03
|
PP = $78.59
|
|
MB = $82.52
|
Most Recent Note - 9/8/2010 4:53:19 PM
Y - Light volume trading continues while the recent rally from its 10-week average may be considered a secondary buy point. However, it may be considered "late-stage" and riskier than fresh technical breakouts.
>>> The latest Featured Stock Update with an annotated graph appeared on 8/13/2010. Click here.
View all notes |
Alert me of new notes |
CANSLIM.net Company Profile |
SEC |
Zacks Reports |
StockTalk |
News |
Chart |
Request a new note
C
A N
S L
I M
|
CACC
-
NASDAQ
Credit Acceptance Corp
FINANCIAL SERVICES - Credit Services
|
$59.60
|
+0.81
1.38% |
$59.78
|
24,714
46.90% of 50 DAV
50 DAV is 52,700
|
$61.41
-2.95%
|
7/29/2010
|
$52.04
|
PP = $54.07
|
|
MB = $56.77
|
Most Recent Note - 9/8/2010 4:56:22 PM
G - Consolidating in a tight trading range with volume totals cooling. Perched -3% off its 52-week high, well above its 50 DMA and old highs near $54 that define support.
>>> The latest Featured Stock Update with an annotated graph appeared on 8/2/2010. Click here.
View all notes |
Alert me of new notes |
CANSLIM.net Company Profile |
SEC |
Zacks Reports |
StockTalk |
News |
Chart |
Request a new note
C
A N
S L
I M
|
CMG
-
NYSE
Chipotle Mexican Grill
LEISURE - Restaurants
|
$166.05
|
+1.27
0.77% |
$167.04
|
538,551
75.75% of 50 DAV
50 DAV is 711,000
|
$166.52
-0.28%
|
9/1/2010
|
$158.31
|
PP = $155.52
|
|
MB = $163.30
|
Most Recent Note - 9/8/2010 5:16:12 PM
G - Gain today with light volume, rising further above its "max buy" level. Color code was changed to green after getting extended from prior chart highs. Technically, it broke out on 9/01/10, rallying to multi-year highs with a considerable gain backed 2 times average volume.
>>> The latest Featured Stock Update with an annotated graph appeared on 9/1/2010. Click here.
View all notes |
Alert me of new notes |
CANSLIM.net Company Profile |
SEC |
Zacks Reports |
StockTalk |
News |
Chart |
Request a new note
C
A N
S L
I M
|
Symbol/Exchange
Company Name
Industry Group |
PRICE |
CHANGE
(%Change) |
Day High |
Volume
(% DAV)
(% 50 day avg vol) |
52 Wk Hi
% From Hi |
Featured
Date |
Price
Featured |
Pivot Featured |
|
Max Buy |
CRM
-
NYSE
Salesforce.Com Inc
INTERNET - Internet Software and Services
|
$119.79
|
+0.14
0.12% |
$121.28
|
2,195,483
82.95% of 50 DAV
50 DAV is 2,646,700
|
$121.45
-1.37%
|
6/2/2010
|
$88.44
|
PP = $89.60
|
|
MB = $94.08
|
Most Recent Note - 9/8/2010 5:21:23 PM
G - Gain today for yet another new all-time high. It is extended from a sound base, not currently buyable under the investment system guidelines.
>>> The latest Featured Stock Update with an annotated graph appeared on 8/16/2010. Click here.
View all notes |
Alert me of new notes |
CANSLIM.net Company Profile |
SEC |
Zacks Reports |
StockTalk |
News |
Chart |
Request a new note
C
A N
S L
I M
|
EGO
-
NYSE
Eldorado Gold Corp
METALS and MINING - Gold
|
$19.32
|
+0.03
0.16% |
$19.80
|
4,286,551
102.62% of 50 DAV
50 DAV is 4,177,100
|
$20.06
-3.69%
|
8/19/2010
|
$18.25
|
PP = $19.17
|
|
MB = $20.13
|
Most Recent Note - 9/8/2010 5:23:54 PM
Y - Holding its ground above its pivot point yet below its "max buy" level after recent volume-driven gains.
>>> The latest Featured Stock Update with an annotated graph appeared on 8/19/2010. Click here.
View all notes |
Alert me of new notes |
CANSLIM.net Company Profile |
SEC |
Zacks Reports |
StockTalk |
News |
Chart |
Request a new note
C
A N
S L
I M
|
FFIV
-
NASDAQ
F 5 Networks Inc
INTERNET - Internet Software and Services
|
$96.36
|
+2.84
3.04% |
$97.05
|
2,180,243
131.67% of 50 DAV
50 DAV is 1,655,800
|
$94.48
1.99%
|
6/16/2010
|
$74.50
|
PP = $74.10
|
|
MB = $77.81
|
Most Recent Note - 9/8/2010 5:25:48 PM
G - Gain today with above average volume for another new all-time high. It has not recently formed a sound base, and an upward trendline defines near-term support above its 50 DMA line and prior low ($80).
>>> The latest Featured Stock Update with an annotated graph appeared on 8/4/2010. Click here.
View all notes |
Alert me of new notes |
CANSLIM.net Company Profile |
SEC |
Zacks Reports |
StockTalk |
News |
Chart |
Request a new note
C
A N
S L
I M
|
FOSL
-
NASDAQ
Fossil Inc
CONSUMER DURABLES - Recreational Goods, Other
|
$50.12
|
+0.69
1.40% |
$50.44
|
540,363
60.43% of 50 DAV
50 DAV is 894,200
|
$50.49
-0.73%
|
8/10/2010
|
$45.54
|
PP = $42.69
|
|
MB = $44.82
|
Most Recent Note - 9/8/2010 5:26:57 PM
G - Perched at an all-time high, extended from any sound base after a recent streak of gains. Prior high in the $46 area defines support to watch.
>>> The latest Featured Stock Update with an annotated graph appeared on 8/11/2010. Click here.
View all notes |
Alert me of new notes |
CANSLIM.net Company Profile |
SEC |
Zacks Reports |
StockTalk |
News |
Chart |
Request a new note
C
A N
S L
I M
|
GMCR
-
NASDAQ
Green Mtn Coffee Roastrs
FOOD and BEVERAGE - Processed and Packaged Goods
|
$33.58
|
+2.37
7.59% |
$34.20
|
6,173,637
278.36% of 50 DAV
50 DAV is 2,217,900
|
$33.98
-1.18%
|
8/17/2010
|
$33.62
|
PP = $33.30
|
|
MB = $34.97
|
Most Recent Note - 9/8/2010 5:34:27 PM
Y - Gapped up, rallying on nearly 3 times average volume after news it will hike prices on its K-Cup portion packs. Traded up and touched a new all-time high today but it failed to close above the high of the handle ($33.98) which may be considered a more valid pivot point than the one previously cited (based on its 4/01/10 high plus ten cents). Confirming gains would be a reassuring sign in the days ahead.
>>> The latest Featured Stock Update with an annotated graph appeared on 8/17/2010. Click here.
View all notes |
Alert me of new notes |
CANSLIM.net Company Profile |
SEC |
Zacks Reports |
StockTalk |
News |
Chart |
Request a new note
C
A N
S L
I M
|
Symbol/Exchange
Company Name
Industry Group |
PRICE |
CHANGE
(%Change) |
Day High |
Volume
(% DAV)
(% 50 day avg vol) |
52 Wk Hi
% From Hi |
Featured
Date |
Price
Featured |
Pivot Featured |
|
Max Buy |
HS
-
NYSE
Healthspring Inc
HEALTH SERVICES - Health Care Plans
|
$22.71
|
+0.71
3.23% |
$22.78
|
594,929
96.75% of 50 DAV
50 DAV is 614,900
|
$22.46
1.11%
|
8/27/2010
|
$19.91
|
PP = $19.75
|
|
MB = $20.74
|
Most Recent Note - 9/8/2010 5:36:32 PM
G - Hit another new 52-week high today and challenged its 2008 high. Extended from its prior base, support to watch now is prior chart highs in the $19-20 area.
>>> The latest Featured Stock Update with an annotated graph appeared on 8/27/2010. Click here.
View all notes |
Alert me of new notes |
CANSLIM.net Company Profile |
SEC |
Zacks Reports |
StockTalk |
News |
Chart |
Request a new note
C
A N
S L
I M
|
IGTE
-
NASDAQ
Igate Corp
COMPUTER SOFTWARE and SERVICES - Information Technology Service
|
$16.85
|
+0.53
3.25% |
$17.35
|
585,982
168.19% of 50 DAV
50 DAV is 348,400
|
$18.16
-7.21%
|
9/8/2010
|
$17.29
|
PP = $18.26
|
|
MB = $19.17
|
Most Recent Note - 9/8/2010 5:39:42 PM
Y - Recently found support near its 50 DMA line and today it rallied toward its 52-week high with a gain backed by heavier volume. Color code was changed to yellow as it met the mid-day report screening criteria (read here), identifying it as an ideal leader for investors' watchlists. This high-ranked Fremont, CA-based firm is still working on an orderly new base. However, it is a riskier "late-stage" base, and another concern was noted in prior mid-day reports -"The downturn in FY '09 earnings hurts its annual earnings (A criteria) track record."
There are no Featured Stock Updates™ available for this stock at this time. You may request one by clicking the Request a New Note link below
View all notes |
Alert me of new notes |
CANSLIM.net Company Profile |
SEC |
Zacks Reports |
StockTalk |
News |
Chart |
Request a new note
C
A N
S L
I M
|
MELI
-
NASDAQ
Mercadolibre Inc
INTERNET - Internet Software and; Services
|
$71.41
|
+1.17
1.67% |
$72.32
|
325,416
32.92% of 50 DAV
50 DAV is 988,600
|
$72.87
-2.00%
|
5/13/2010
|
$54.21
|
PP = $55.85
|
|
MB = $58.64
|
Most Recent Note - 9/8/2010 5:41:15 PM
G - Small gain today on light volume for a new high close, wedging higher and getting extended from a sound base. Prior highs in the $62 area and its 50 DMA line define chart support.
>>> The latest Featured Stock Update with an annotated graph appeared on 8/26/2010. Click here.
View all notes |
Alert me of new notes |
CANSLIM.net Company Profile |
SEC |
Zacks Reports |
StockTalk |
News |
Chart |
Request a new note
C
A N
S L
I M
|
MRX
-
NYSE
Medicis Pharmaceut Cl A
DRUGS - Biotechnology
|
$28.96
|
-0.17
-0.58% |
$29.67
|
1,110,488
91.62% of 50 DAV
50 DAV is 1,212,000
|
$30.00
-3.47%
|
8/12/2010
|
$26.88
|
PP = $26.71
|
|
MB = $28.05
|
Most Recent Note - 9/8/2010 5:48:34 PM
G - Pulling back from its 52-week high with a loss today on near average volume. Color code was changed to green after volume-driven gains beyond its "max buy" level. Prior highs in the $28 area define an initial chart support level to watch.
>>> The latest Featured Stock Update with an annotated graph appeared on 8/12/2010. Click here.
View all notes |
Alert me of new notes |
CANSLIM.net Company Profile |
SEC |
Zacks Reports |
StockTalk |
News |
Chart |
Request a new note
C
A N
S L
I M
|
MWIV
-
NASDAQ
M W I Veterinary Supply
HEALTH SERVICES - Medical Instruments and; Supplies
|
$54.00
|
-0.12
-0.22% |
$54.93
|
16,709
21.20% of 50 DAV
50 DAV is 78,800
|
$55.93
-3.45%
|
7/29/2010
|
$52.05
|
PP = $52.09
|
|
MB = $54.69
|
Most Recent Note - 9/8/2010 5:50:18 PM
Y - Small loss on very light volume today, quietly consolidating under its "max buy" level. Color code was changed to yellow. Recent lows in the $46 area define an important chart support level.
>>> The latest Featured Stock Update with an annotated graph appeared on 9/7/2010. Click here.
View all notes |
Alert me of new notes |
CANSLIM.net Company Profile |
SEC |
Zacks Reports |
StockTalk |
News |
Chart |
Request a new note
C
A N
S L
I M
|
Symbol/Exchange
Company Name
Industry Group |
PRICE |
CHANGE
(%Change) |
Day High |
Volume
(% DAV)
(% 50 day avg vol) |
52 Wk Hi
% From Hi |
Featured
Date |
Price
Featured |
Pivot Featured |
|
Max Buy |
NEM
-
NYSE
Newmont Mining Corp
METALS and MINING - Gold
|
$61.57
|
-0.50
-0.81% |
$62.70
|
4,600,694
64.37% of 50 DAV
50 DAV is 7,147,400
|
$63.38
-2.86%
|
8/31/2010
|
$61.32
|
PP = $63.48
|
|
MB = $66.65
|
Most Recent Note - 9/7/2010 5:25:52 PM
Y - Gap up gain today with light volume for a new high close. Color code was changed to yellow with new pivot point cited based on its 52-week high plus ten cents. Disciplined investors will watch for a confirming gain above its pivot with heavy volume. Leadership in the Mining - Gold/Silver/Gems group (L criteria) is a nice reassurance.
>>> The latest Featured Stock Update with an annotated graph appeared on 8/6/2010. Click here.
View all notes |
Alert me of new notes |
CANSLIM.net Company Profile |
SEC |
Zacks Reports |
StockTalk |
News |
Chart |
Request a new note
C
A N
S L
I M
|
NEOG
-
NASDAQ
Neogen Corp
DRUGS - Diagnostic Substances
|
$31.99
|
+0.58
1.85% |
$32.11
|
88,821
88.29% of 50 DAV
50 DAV is 100,600
|
$31.92
0.22%
|
9/1/2010
|
$30.79
|
PP = $30.49
|
|
MB = $32.01
|
Most Recent Note - 9/8/2010 5:52:52 PM
Y- Gain today with below average volume for a new all-time high and close near its "max buy" level. Technically, its 9/01/10 gain above the new pivot point cited triggered a buy signal after an orderly 5-week base-on-base pattern.
>>> The latest Featured Stock Update with an annotated graph appeared on 8/20/2010. Click here.
View all notes |
Alert me of new notes |
CANSLIM.net Company Profile |
SEC |
Zacks Reports |
StockTalk |
News |
Chart |
Request a new note
C
A N
S L
I M
|
NFLX
-
NASDAQ
Netflix Inc
SPECIALTY RETAIL - Music and Video Stores
|
$146.00
|
+4.21
2.97% |
$147.74
|
5,567,767
120.97% of 50 DAV
50 DAV is 4,602,700
|
$142.95
2.13%
|
8/10/2010
|
$124.05
|
PP = $124.00
|
|
MB = $130.20
|
Most Recent Note - 9/8/2010 5:57:42 PM
G- Hit another new all-time high today with its 6th consecutive gain. No resistance remains to hinder its progress. It has risen beyond its "max buy" level after holding its ground and finding recent support near its pivot point.
>>> The latest Featured Stock Update with an annotated graph appeared on 8/10/2010. Click here.
View all notes |
Alert me of new notes |
CANSLIM.net Company Profile |
SEC |
Zacks Reports |
StockTalk |
News |
Chart |
Request a new note
C
A N
S L
I M
|
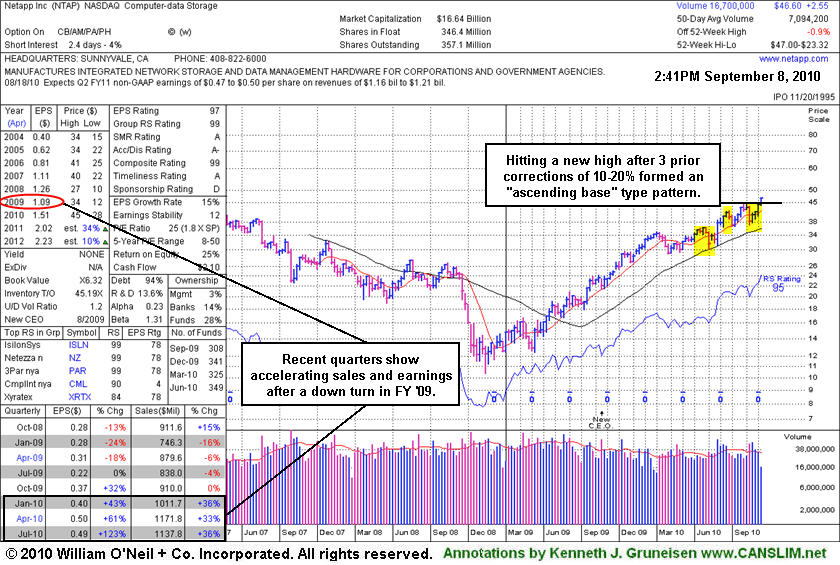
NTAP
-
NASDAQ
Netapp Inc
COMPUTER HARDWARE - Data Storage Devices
|
$46.43
|
+1.65
3.68% |
$47.00
|
13,706,605
193.16% of 50 DAV
50 DAV is 7,096,100
|
$45.00
3.18%
|
9/8/2010
|
$46.98
|
PP = $44.99
|
|
MB = $47.24
|
Most Recent Note - 9/8/2010 6:09:21 PM
Y - Hit a new 52-week high today and closed strong, rising from an ascending base type pattern with volume nearly 2 times average, triggering a technical buy signal. It was featured in the mid-day report (read here) in yellow with pivot point based on its 52-week high plus ten cents. Recent quarterly comparisons (C criteria) showed accelerating sales revenues and strong earnings increases, but a down turn in its FY '09 earnings is a concern with respect to its annual earnings (A criteria) history.
>>> The latest Featured Stock Update with an annotated graph appeared on 9/8/2010. Click here.
View all notes |
Alert me of new notes |
CANSLIM.net Company Profile |
SEC |
Zacks Reports |
StockTalk |
News |
Chart |
Request a new note
C
A N
S L
I M
|
PAY
-
NYSE
Verifone Systems Inc
COMPUTER HARDWARE - Transaction Automation Systems
|
$26.14
|
-0.36
-1.36% |
$26.88
|
1,314,211
102.22% of 50 DAV
50 DAV is 1,285,700
|
$26.72
-2.17%
|
8/25/2010
|
$24.30
|
PP = $23.74
|
|
MB = $24.93
|
Most Recent Note - 9/7/2010 5:31:01 PM
G - Holding its ground at its 52-week high. Disciplined investors may watch for chances to accumulate shares on pullbacks toward prior highs in the $23 area defining chart support.
>>> The latest Featured Stock Update with an annotated graph appeared on 8/30/2010. Click here.
View all notes |
Alert me of new notes |
CANSLIM.net Company Profile |
SEC |
Zacks Reports |
StockTalk |
News |
Chart |
Request a new note
C
A N
S L
I M
|
Symbol/Exchange
Company Name
Industry Group |
PRICE |
CHANGE
(%Change) |
Day High |
Volume
(% DAV)
(% 50 day avg vol) |
52 Wk Hi
% From Hi |
Featured
Date |
Price
Featured |
Pivot Featured |
|
Max Buy |
ROVI
-
NASDAQ
Rovi Corp
COMPUTER SOFTWARE andamp; SERVICES - Security Software andamp; Services
|
$44.24
|
+0.87
2.01% |
$45.46
|
2,799,271
245.83% of 50 DAV
50 DAV is 1,138,700
|
$44.96
-1.60%
|
8/31/2010
|
$43.31
|
PP = $45.06
|
|
MB = $47.31
|
Most Recent Note - 9/8/2010 6:23:59 PM
Y - Technically, it has not broken out from the recently noted base-on-base type pattern. It spiked to a new 52-week high today, then encountered distributional pressure and closed the session below its pivot point in the middle of its intra-day range.
>>> The latest Featured Stock Update with an annotated graph appeared on 8/24/2010. Click here.
View all notes |
Alert me of new notes |
CANSLIM.net Company Profile |
SEC |
Zacks Reports |
StockTalk |
News |
Chart |
Request a new note
C
A N
S L
I M
|
SHOO
-
NASDAQ
Steven Madden Limited
CONSUMER NON-DURABLES - Textile - Apparel Footwear
|
$36.80
|
+0.15
0.41% |
$37.19
|
120,478
27.96% of 50 DAV
50 DAV is 430,900
|
$40.98
-10.20%
|
8/5/2010
|
$39.55
|
PP = $41.08
|
|
MB = $43.13
|
Most Recent Note - 9/8/2010 6:25:48 PM
Y - Volume totals have cooled while recently consolidating. Color code was changed to yellow, and subsequent gains above the pivot point previously cited are still needed to confirm a proper technical buy signal.
>>> The latest Featured Stock Update with an annotated graph appeared on 8/5/2010. Click here.
View all notes |
Alert me of new notes |
CANSLIM.net Company Profile |
SEC |
Zacks Reports |
StockTalk |
News |
Chart |
Request a new note
C
A N
S L
I M
|
SLW
-
NYSE
Silver Wheaton Corp
METALS and; MINING - Silver
|
$24.01
|
-0.15
-0.62% |
$24.72
|
6,908,690
148.05% of 50 DAV
50 DAV is 4,666,400
|
$24.41
-1.64%
|
8/25/2010
|
$21.40
|
PP = $21.99
|
|
MB = $23.09
|
Most Recent Note - 9/8/2010 6:27:10 PM
G - Hit another new all-time high today, then negatively reversed and closed near the session low. Extended from a sound base, the previous highs in the $21 area are now a support level to watch.
>>> The latest Featured Stock Update with an annotated graph appeared on 8/25/2010. Click here.
View all notes |
Alert me of new notes |
CANSLIM.net Company Profile |
SEC |
Zacks Reports |
StockTalk |
News |
Chart |
Request a new note
C
A N
S L
I M
|
ULTA
-
NASDAQ
Ulta Salon Cosm & Frag
SPECIALTY RETAIL - Specialty Retail, Other
|
$26.71
|
+0.31
1.17% |
$26.95
|
813,622
131.04% of 50 DAV
50 DAV is 620,900
|
$26.75
-0.15%
|
9/3/2010
|
$26.36
|
PP = $25.89
|
|
MB = $27.18
|
Most Recent Note - 9/8/2010 6:29:40 PM
Y - Gain today for a new 52-week high, still trading under is "max buy" level. Color code was changed to yellow with new pivot point cited when featured again in the 9/03/10 mid-day report.
>>> The latest Featured Stock Update with an annotated graph appeared on 9/3/2010. Click here.
View all notes |
Alert me of new notes |
CANSLIM.net Company Profile |
SEC |
Zacks Reports |
StockTalk |
News |
Chart |
Request a new note
C
A N
S L
I M
|
VIT
-
NYSE
Vanceinfo Tech Inc Ads
COMPUTER SOFTWARE and SERVICES - Business Software and Services
|
$30.04
|
+0.07
0.23% |
$30.50
|
475,789
84.27% of 50 DAV
50 DAV is 564,600
|
$30.05
-0.03%
|
7/8/2010
|
$25.20
|
PP = $26.58
|
|
MB = $27.91
|
Most Recent Note - 9/8/2010 6:34:11 PM
G - Posted a 4th consecutive gain today with light volume for another new high. Patient investors may watch for secondary buy points. Recent gains lifted it more than +5% above its old chart highs.
>>> The latest Featured Stock Update with an annotated graph appeared on 8/31/2010. Click here.
View all notes |
Alert me of new notes |
CANSLIM.net Company Profile |
SEC |
Zacks Reports |
StockTalk |
News |
Chart |
Request a new note
C
A N
S L
I M
|
Symbol/Exchange
Company Name
Industry Group |
PRICE |
CHANGE
(%Change) |
Day High |
Volume
(% DAV)
(% 50 day avg vol) |
52 Wk Hi
% From Hi |
Featured
Date |
Price
Featured |
Pivot Featured |
|
Max Buy |
WCRX
-
NASDAQ
Warner Chilcott Plc
DRUGS - Drug Manufacturers - Other
|
$29.28
|
-0.21
-0.71% |
$29.61
|
2,278,826
131.85% of 50 DAV
50 DAV is 1,728,300
|
$30.57
-4.22%
|
8/23/2010
|
$29.54
|
PP = $29.34
|
|
MB = $30.81
|
Most Recent Note - 9/8/2010 6:41:25 PM
Y - Volume was above average today as it encountered distributional pressure. It remains perched near its pivot point. WCRX was featured in yellow in the mid-day report on 8/23/10 rising from a cup shaped base.
>>> The latest Featured Stock Update with an annotated graph appeared on 8/23/2010. Click here.
View all notes |
Alert me of new notes |
CANSLIM.net Company Profile |
SEC |
Zacks Reports |
StockTalk |
News |
Chart |
Request a new note
C
A N
S L
I M
|