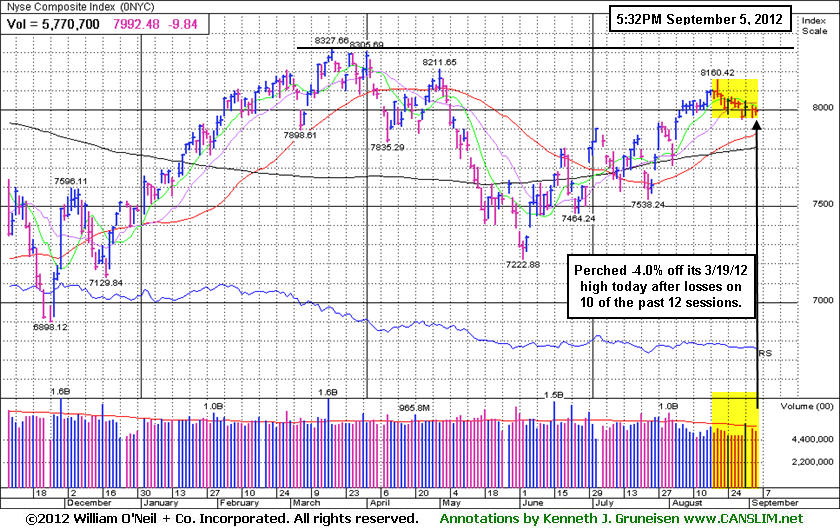
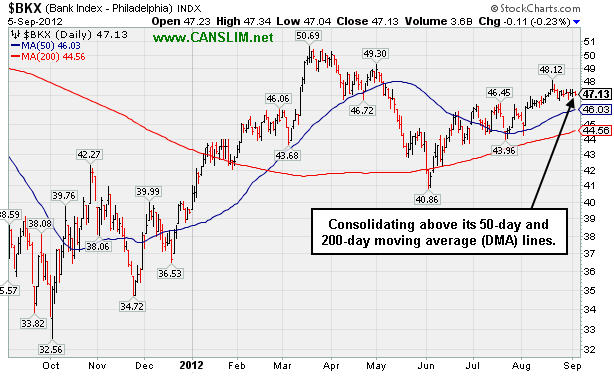
***Last / Change / Volume data in this table is the closing quote data***
Symbol/Exchange
Company Name
Industry Group |
PRICE |
CHANGE
(%Change) |
Day High |
Volume
(% DAV)
(% 50 day avg vol) |
52 Wk Hi
% From Hi |
Featured
Date |
Price
Featured |
Pivot Featured |
|
Max Buy |
ALXN
-
NASDAQ
Alexion Pharmaceuticals
DRUGS - Drug Manufacturers - Other
|
$106.81
|
-1.59
-1.47% |
$108.68
|
927,209
72.36% of 50 DAV
50 DAV is 1,281,400
|
$109.96
-2.86%
|
8/23/2012
|
$103.70
|
PP = $110.06
|
|
MB = $115.56
|
Most Recent Note - 9/4/2012 4:21:07 PM
Y - Still perched within close striking distance of its 52-week high. Subsequent volume-driven gains above its pivot point may trigger a new (or add-on) technical buy signal.
>>> The latest Featured Stock Update with an annotated graph appeared on 8/23/2012. Click here.
View all notes |
Alert me of new notes |
CANSLIM.net Company Profile |
SEC |
Zacks Reports |
StockTalk |
News |
Chart |
Request a new note
C
A N
S L
I M


|
ASPS
-
NASDAQ
Altisource Ptf Sltns Sa
REAL ESTATE - Property Management/Developmen
|
$87.39
|
+1.39
1.62% |
$87.83
|
126,106
98.44% of 50 DAV
50 DAV is 128,100
|
$92.29
-5.31%
|
6/5/2012
|
$60.01
|
PP = $63.00
|
|
MB = $66.15
|
Most Recent Note - 8/30/2012 3:58:06 PM
G - Down today on below average volume, retreating -9.3% from its all-time high. It has been repeatedly noted - "Extended from its prior base, and its 50 DMA line defines near-term support to watch."
>>> The latest Featured Stock Update with an annotated graph appeared on 8/3/2012. Click here.
View all notes |
Alert me of new notes |
CANSLIM.net Company Profile |
SEC |
Zacks Reports |
StockTalk |
News |
Chart |
Request a new note
C
A N
S L
I M
|
CFNL
-
NASDAQ
Cardinal Financial Corp
BANKING - Regional - Southeast Banks
|
$13.30
|
+0.02
0.15% |
$13.42
|
62,431
103.36% of 50 DAV
50 DAV is 60,400
|
$13.36
-0.45%
|
8/17/2012
|
$12.84
|
PP = $13.31
|
|
MB = $13.98
|
Most Recent Note - 9/4/2012 4:15:30 PM
Y - Hit a new 52-week high today with a gain on near average volume. Disciplined investors know to watch for signs of fresh institutional buying demand as a reassurance. Previously noted - "Volume-driven gains above its pivot point may trigger a new (or add-on) technical buy signal, meanwhile its 50 DMA line defines important support."
>>> The latest Featured Stock Update with an annotated graph appeared on 8/21/2012. Click here.
View all notes |
Alert me of new notes |
CANSLIM.net Company Profile |
SEC |
Zacks Reports |
StockTalk |
News |
Chart |
Request a new note
C
A N
S L
I M
|
CMCSA
-
NASDAQ
Comcast Corp Cl A
MEDIA - CATV Systems
|
$33.71
|
+0.19
0.55% |
$33.76
|
12,880,472
102.82% of 50 DAV
50 DAV is 12,527,600
|
$35.16
-4.12%
|
6/11/2012
|
$29.94
|
PP = $30.98
|
|
MB = $32.53
|
Most Recent Note - 9/4/2012 4:22:31 PM
G - Consolidating just above its 50 DMA line. Fundamental concerns were raised as it recently reported earnings +19% on +6% sales revenues for the Jun '12 quarter, below the fact-based investment system's +25% minimum guideline for the C criteria.
>>> The latest Featured Stock Update with an annotated graph appeared on 8/15/2012. Click here.
View all notes |
Alert me of new notes |
CANSLIM.net Company Profile |
SEC |
Zacks Reports |
StockTalk |
News |
Chart |
Request a new note
C
A N
S L
I M
|
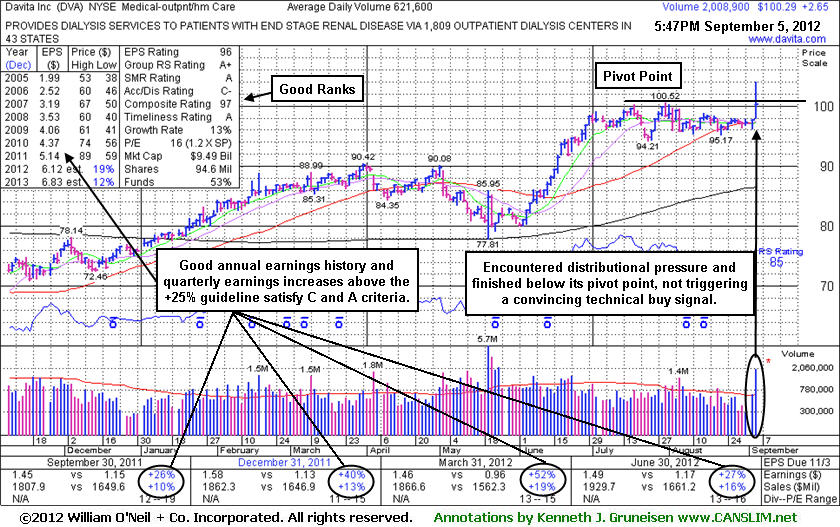
DVA
-
NYSE
Davita Inc
HEALTH SERVICES - Specialized Health Services
|
$100.29
|
+2.65
2.71% |
$103.97
|
2,009,249
323.24% of 50 DAV
50 DAV is 621,600
|
$100.52
-0.23%
|
9/5/2012
|
$102.92
|
PP = $100.62
|
|
MB = $105.65
|
 Most Recent Note - 9/5/2012 6:08:48 PM
Y - Finished just below its pivot point today after highlighted in yellow in the earlier mid-day report (read here) while hitting a new high with a considerable volume-driven gain. See the latest FSU analysis for more details and an annotated graph.
>>> The latest Featured Stock Update with an annotated graph appeared on 9/5/2012. Click here.
View all notes |
Alert me of new notes |
CANSLIM.net Company Profile |
SEC |
Zacks Reports |
StockTalk |
News |
Chart |
Request a new note
C
A N
S L
I M
|
Symbol/Exchange
Company Name
Industry Group |
PRICE |
CHANGE
(%Change) |
Day High |
Volume
(% DAV)
(% 50 day avg vol) |
52 Wk Hi
% From Hi |
Featured
Date |
Price
Featured |
Pivot Featured |
|
Max Buy |
ECPG
-
NASDAQ
Encore Capital Group Inc
FINANCIAL SERVICES - Credit Services
|
$28.39
|
+0.14
0.50% |
$28.53
|
69,237
56.52% of 50 DAV
50 DAV is 122,500
|
$30.47
-6.83%
|
8/3/2012
|
$29.91
|
PP = $30.45
|
|
MB = $31.97
|
Most Recent Note - 9/4/2012 4:23:32 PM
G - Still sputtering below its 50 DMA line and -7.3% off its 52-week high today. Completed a Secondary Offering on 8/08/12. Gains above its 50 DMA line are needed for its outlook to improve.
>>> The latest Featured Stock Update with an annotated graph appeared on 8/6/2012. Click here.
View all notes |
Alert me of new notes |
CANSLIM.net Company Profile |
SEC |
Zacks Reports |
StockTalk |
News |
Chart |
Request a new note
C
A N
S L
I M
|
EXPE
-
NASDAQ
Expedia Inc
INTERNET - Internet Information Providers
|
$52.10
|
+0.11
0.21% |
$52.39
|
1,815,983
54.15% of 50 DAV
50 DAV is 3,353,900
|
$59.50
-12.44%
|
4/27/2012
|
$41.80
|
PP = $35.57
|
|
MB = $37.35
|
Most Recent Note - 8/30/2012 3:59:47 PM
G - Volume totals have been cooling while consolidating above prior highs and its 50 DMA line defining important near-term chart support in the $50 area.
>>> The latest Featured Stock Update with an annotated graph appeared on 8/14/2012. Click here.
View all notes |
Alert me of new notes |
CANSLIM.net Company Profile |
SEC |
Zacks Reports |
StockTalk |
News |
Chart |
Request a new note
C
A N
S L
I M
|
GPX
-
NYSE
G P Strategies Corp
DIVERSIFIED SERVICES - Education and Training Services
|
$19.75
|
-0.20
-1.00% |
$19.96
|
53,250
72.45% of 50 DAV
50 DAV is 73,500
|
$20.67
-4.45%
|
6/29/2012
|
$18.01
|
PP = $18.15
|
|
MB = $19.06
|
Most Recent Note - 9/4/2012 4:25:13 PM
G - Perched -3.5% off its 52-week high today, slightly extended from its prior base. Churned above average volume recently without making much meaningful price progress, a sign of distributional pressure. Prior highs and its 50 DMA line define chart support in the $18 area.
>>> The latest Featured Stock Update with an annotated graph appeared on 8/7/2012. Click here.
View all notes |
Alert me of new notes |
CANSLIM.net Company Profile |
SEC |
Zacks Reports |
StockTalk |
News |
Chart |
Request a new note
C
A N
S L
I M
|
HMSY
-
NASDAQ
H M S Holdings Corp
COMPUTER SOFTWARE and SERVICES - Healthcare Information Service
|
$34.96
|
-0.14
-0.40% |
$35.73
|
818,470
89.72% of 50 DAV
50 DAV is 912,300
|
$37.19
-6.00%
|
7/27/2012
|
$33.91
|
PP = $34.83
|
|
MB = $36.57
|
Most Recent Note - 9/4/2012 4:59:26 PM
Y - Still consolidating above its 50 DMA line. Volume-driven gains into new high territory would be a reassuring sign disciplined investors may wait for as an indication of fresh institutional accumulation.
>>> The latest Featured Stock Update with an annotated graph appeared on 8/22/2012. Click here.
View all notes |
Alert me of new notes |
CANSLIM.net Company Profile |
SEC |
Zacks Reports |
StockTalk |
News |
Chart |
Request a new note
C
A N
S L
I M
|
KH
-
NYSE
China Kanghui Hldgs Ads
HEALTH SERVICES - Medical Appliances and Equipment
|
$26.04
|
-0.26
-0.99% |
$27.47
|
99,766
413.97% of 50 DAV
50 DAV is 24,100
|
$26.50
-1.74%
|
8/30/2012
|
$24.19
|
PP = $22.90
|
|
MB = $24.05
|
Most Recent Note - 9/5/2012 12:22:44 PM
G - Reversed into the red after early gains today into new all-time high territory. It is extended from its latest base, meanwhile its prior highs in the $23 area define support to watch on pullbacks.
>>> The latest Featured Stock Update with an annotated graph appeared on 8/30/2012. Click here.
View all notes |
Alert me of new notes |
CANSLIM.net Company Profile |
SEC |
Zacks Reports |
StockTalk |
News |
Chart |
Request a new note
C
A N
S L
I M
|
Symbol/Exchange
Company Name
Industry Group |
PRICE |
CHANGE
(%Change) |
Day High |
Volume
(% DAV)
(% 50 day avg vol) |
52 Wk Hi
% From Hi |
Featured
Date |
Price
Featured |
Pivot Featured |
|
Max Buy |
LKQ
-
NASDAQ
L K Q Corp
WHOLESALE - Auto Parts
|
$38.28
|
-0.12
-0.31% |
$38.78
|
539,337
73.65% of 50 DAV
50 DAV is 732,300
|
$39.20
-2.35%
|
8/9/2012
|
$37.93
|
PP = $37.44
|
|
MB = $39.31
|
Most Recent Note - 8/30/2012 3:22:25 PM
Y - Down today with light volume, slumping back near its pivot point. Prior highs in the $37 area define initial support to watch above its 50 DMA line.
>>> The latest Featured Stock Update with an annotated graph appeared on 8/10/2012. Click here.
View all notes |
Alert me of new notes |
CANSLIM.net Company Profile |
SEC |
Zacks Reports |
StockTalk |
News |
Chart |
Request a new note
C
A N
S L
I M
|
LNKD
-
NYSE
Linkedin Corp Class A
INTERNET - Internet Information Providers
|
$113.28
|
+5.91
5.50% |
$114.75
|
4,728,085
198.14% of 50 DAV
50 DAV is 2,386,200
|
$120.63
-6.09%
|
9/5/2012
|
$113.25
|
PP = $113.10
|
|
MB = $118.76
|
Most Recent Note - 9/5/2012 6:13:18 PM
Y - Cleared the pivot point cited based on its 8/06/12 high plus 10 cents with a considerable gain today backed by twice average volume clinching a technical buy signal. Little overhead supply remains to act as resistance. Strong quarterly earnings increases satisfy the C criteria. It completed another Public Offering on 11/16/11 following its IPO in May '11. It was highlighted in yellow in the earlier mid-day report (read here) with the annotated graph included below.

There are no Featured Stock Updates™ available for this stock at this time. You may request one by clicking the Request a New Note link below
View all notes |
Alert me of new notes |
CANSLIM.net Company Profile |
SEC |
Zacks Reports |
StockTalk |
News |
Chart |
Request a new note
C
A N
S L
I M
|
MIDD
-
NASDAQ
Middleby Corp
MANUFACTURING - Diversified Machinery
|
$118.85
|
+0.35
0.30% |
$121.51
|
212,629
211.36% of 50 DAV
50 DAV is 100,600
|
$119.74
-0.74%
|
8/9/2012
|
$118.60
|
PP = $104.92
|
|
MB = $110.17
|
Most Recent Note - 9/5/2012 6:15:05 PM
G - Finished in the middle of its intra-day range after touching a new 52-week high with today's 3rd consecutive gain backed by above average volume. Extended from its prior base, its 50 DMA line and prior highs in the $104 area define important chart support to watch.
>>> The latest Featured Stock Update with an annotated graph appeared on 8/13/2012. Click here.
View all notes |
Alert me of new notes |
CANSLIM.net Company Profile |
SEC |
Zacks Reports |
StockTalk |
News |
Chart |
Request a new note
C
A N
S L
I M
|
N
-
NYSE
Netsuite Inc
DIVERSIFIED SERVICES - Business/Management Services
|
$55.83
|
-0.56
-0.99% |
$56.44
|
350,653
53.83% of 50 DAV
50 DAV is 651,400
|
$59.22
-5.72%
|
8/20/2012
|
$55.88
|
PP = $59.32
|
|
MB = $62.29
|
Most Recent Note - 8/31/2012 5:20:11 PM
Y - Posted a solid gain on light volume today. Volume totals have been cooling while consolidating in a tight range near its 52-week high. A volume-driven gain above its pivot point may trigger a new (or add-on) technical buy signal. Meanwhile, its 50 DMA line defines important near-term support.
>>> The latest Featured Stock Update with an annotated graph appeared on 8/20/2012. Click here.
View all notes |
Alert me of new notes |
CANSLIM.net Company Profile |
SEC |
Zacks Reports |
StockTalk |
News |
Chart |
Request a new note
C
A N
S L
I M
|
NSM
-
NYSE
Nationstar Mtg Hldgs Inc
FINANCIAL SERVICES - Credit Services
|
$28.57
|
-0.19
-0.66% |
$30.07
|
1,603,506
208.60% of 50 DAV
50 DAV is 768,700
|
$29.10
-1.82%
|
8/29/2012
|
$27.96
|
PP = $28.85
|
|
MB = $30.29
|
Most Recent Note - 9/5/2012 6:18:26 PM
Y - Ended with a loss and closed near the session low today following a worrisome "negative reversal" after hitting a new 52-week high. Previously noted - "A strong finish above the new pivot point cited may clear the advanced 'ascending base' pattern and clinch a new (or add-on) technical buy signal."
>>> The latest Featured Stock Update with an annotated graph appeared on 8/1/2012. Click here.
View all notes |
Alert me of new notes |
CANSLIM.net Company Profile |
SEC |
Zacks Reports |
StockTalk |
News |
Chart |
Request a new note
C
A N
S L
I M
|
Symbol/Exchange
Company Name
Industry Group |
PRICE |
CHANGE
(%Change) |
Day High |
Volume
(% DAV)
(% 50 day avg vol) |
52 Wk Hi
% From Hi |
Featured
Date |
Price
Featured |
Pivot Featured |
|
Max Buy |
OSIS
-
NASDAQ
O S I Systems Inc
ELECTRONICS - Semiconductor Equipment and Mate
|
$74.39
|
-0.30
-0.40% |
$75.99
|
267,331
248.68% of 50 DAV
50 DAV is 107,500
|
$75.00
-0.81%
|
9/5/2012
|
$74.39
|
PP = $75.10
|
|
MB = $78.86
|
Most Recent Note - 9/5/2012 6:24:43 PM
Y - Encountered distributional pressure and ended with a small loss today with above average volume following a "negative reversal" after touching a new 52-week high. Color code is changed to yellow with a new pivot point cited based on its 8/15/12 high plus 10 cents as it has formed an advanced "3-weeks tight" base pattern. Subsequent volume-driven gains for a close above its pivot point may clinch a new (or add-on) technical buy signal. Prior highs in the $67-68 area define initial support to watch on pullbacks.
>>> The latest Featured Stock Update with an annotated graph appeared on 8/9/2012. Click here.
View all notes |
Alert me of new notes |
CANSLIM.net Company Profile |
SEC |
Zacks Reports |
StockTalk |
News |
Chart |
Request a new note
C
A N
S L
I M
|
RNF
-
NYSE
Rentech Nitrogen Ptnr Lp
CHEMICALS - Agricultural Chemicals
|
$34.78
|
+0.21
0.61% |
$35.48
|
492,171
111.02% of 50 DAV
50 DAV is 443,300
|
$35.00
-0.63%
|
7/27/2012
|
$29.58
|
PP = $30.60
|
|
MB = $32.13
|
Most Recent Note - 8/31/2012 5:38:39 PM
G - Holding its ground perched near its high with volume totals cooling in recent weeks. It is extended from its prior base with near-term support at prior highs in the $30-31 area and its 50 DMA line. See the latest FSU analysis for more details and a new annotated graph.
>>> The latest Featured Stock Update with an annotated graph appeared on 8/31/2012. Click here.
View all notes |
Alert me of new notes |
CANSLIM.net Company Profile |
SEC |
Zacks Reports |
StockTalk |
News |
Chart |
Request a new note
C
A N
S L
I M
|
SWI
-
NYSE
Solarwinds Inc
COMPUTER SOFTWARE and SERVICES - Application Software
|
$57.89
|
-0.73
-1.25% |
$59.01
|
1,102,891
95.46% of 50 DAV
50 DAV is 1,155,300
|
$58.81
-1.56%
|
7/25/2012
|
$47.82
|
PP = $47.89
|
|
MB = $50.28
|
Most Recent Note - 9/4/2012 12:37:08 PM
G - Volume is running at an above average pace today while hitting a new all-time high. Its 50 DMA line and prior highs coincide in the $48 area defining important chart support to watch on pullbacks.
>>> The latest Featured Stock Update with an annotated graph appeared on 8/29/2012. Click here.
View all notes |
Alert me of new notes |
CANSLIM.net Company Profile |
SEC |
Zacks Reports |
StockTalk |
News |
Chart |
Request a new note
C
A N
S L
I M
|
TDG
-
NYSE
Transdigm Group Inc
AEROSPACE/DEFENSE - Aerospace/Defense Products and; Services
|
$137.03
|
-1.64
-1.18% |
$138.46
|
281,123
71.08% of 50 DAV
50 DAV is 395,500
|
$143.15
-4.28%
|
8/16/2012
|
$132.23
|
PP = $136.44
|
|
MB = $143.26
|
Most Recent Note - 9/4/2012 4:27:37 PM
Y - Hovering near its 52-week high. Prior high near $136 defines near-term chart support. Disciplined investors always limit losses if ever any stock falls -7% from their purchase price.
>>> The latest Featured Stock Update with an annotated graph appeared on 8/17/2012. Click here.
View all notes |
Alert me of new notes |
CANSLIM.net Company Profile |
SEC |
Zacks Reports |
StockTalk |
News |
Chart |
Request a new note
C
A N
S L
I M
|
ULTA
-
NASDAQ
Ulta Salon Cosm & Frag
SPECIALTY RETAIL - Specialty Retail, Other
|
$92.92
|
-1.26
-1.34% |
$94.82
|
1,191,966
161.60% of 50 DAV
50 DAV is 737,600
|
$98.42
-5.59%
|
9/4/2012
|
$93.17
|
PP = $98.52
|
|
MB = $103.45
|
Most Recent Note - 9/4/2012 4:55:29 PM
Y - Highlighted in yellow in the earlier mid-day report while building on the current 11-week base during which it found support at its 200 DMA line. New pivot point cited is based on its 6/20/12 high plus 10 cents. Little resistance remains due to overhead supply while consolidating -4.3% off its 52-week high, however volume-driven gains above its pivot point are needed to trigger a technical buy signal. Reported earnings +46% on +23% sales revenues for the quarter ended April 30, 2012 versus the year ago period. Completed a Secondary Offering on 5/10/12. See the latest FSU analysis for more details and a new annotated graph.
>>> The latest Featured Stock Update with an annotated graph appeared on 9/4/2012. Click here.
View all notes |
Alert me of new notes |
CANSLIM.net Company Profile |
SEC |
Zacks Reports |
StockTalk |
News |
Chart |
Request a new note
C
A N
S L
I M
|
Symbol/Exchange
Company Name
Industry Group |
PRICE |
CHANGE
(%Change) |
Day High |
Volume
(% DAV)
(% 50 day avg vol) |
52 Wk Hi
% From Hi |
Featured
Date |
Price
Featured |
Pivot Featured |
|
Max Buy |
ULTI
-
NASDAQ
Ultimate Software Group
INTERNET - Internet Software and Services
|
$101.09
|
+1.14
1.14% |
$101.82
|
209,530
137.85% of 50 DAV
50 DAV is 152,000
|
$100.83
0.26%
|
8/27/2012
|
$98.36
|
PP = $99.19
|
|
MB = $104.15
|
Most Recent Note - 9/5/2012 6:32:46 PM
Y - Tallied a 5th consecutive small gain today with higher volume just below the bare minimum +40% above average volume threshold necessary to trigger technical buy signal.
>>> The latest Featured Stock Update with an annotated graph appeared on 8/27/2012. Click here.
View all notes |
Alert me of new notes |
CANSLIM.net Company Profile |
SEC |
Zacks Reports |
StockTalk |
News |
Chart |
Request a new note
C
A N
S L
I M
|
VSI
-
NYSE
Vitamin Shoppe Inc
SPECIALTY RETAIL - Specialty Retail, Other
|
$57.92
|
+1.57
2.79% |
$58.23
|
921,498
252.05% of 50 DAV
50 DAV is 365,600
|
$61.83
-6.32%
|
6/29/2012
|
$54.93
|
PP = $55.03
|
|
MB = $57.78
|
Most Recent Note - 9/5/2012 12:52:11 PM
G - Gapped up today after rallying above its 50 DMA line on the prior session with a considerable volume-driven gain helping its technical stance. Prior low ($52.41 on 7/23/12) defines a near-term support level where any further deterioration would raise more serious concerns.
>>> The latest Featured Stock Update with an annotated graph appeared on 8/2/2012. Click here.
View all notes |
Alert me of new notes |
CANSLIM.net Company Profile |
SEC |
Zacks Reports |
StockTalk |
News |
Chart |
Request a new note
C
A N
S L
I M
|
WPI
-
NYSE
Watson Pharmaceuticals
DRUGS - Drugs - Generic
|
$83.07
|
+0.01
0.01% |
$83.25
|
922,028
70.66% of 50 DAV
50 DAV is 1,304,900
|
$83.83
-0.91%
|
8/24/2012
|
$82.90
|
PP = $81.10
|
|
MB = $85.16
|
Most Recent Note - 9/4/2012 4:28:34 PM
Y - Still holding its ground since triggering a technical buy signal on 8/24/12 when highlighted in the mid-day report with a gap up gain backed by above average volume. Prior highs in the $81 area define initial support to watch on pullbacks.
>>> The latest Featured Stock Update with an annotated graph appeared on 8/28/2012. Click here.
View all notes |
Alert me of new notes |
CANSLIM.net Company Profile |
SEC |
Zacks Reports |
StockTalk |
News |
Chart |
Request a new note
C
A N
S L
I M
|