Symbol/Exchange
Company Name
Industry Group |
PRICE |
CHANGE
(%Change) |
Day High |
Volume
(% DAV)
(% 50 day avg vol) |
52 Wk Hi
% From Hi |
Featured
Date |
Price
Featured |
Pivot Featured |
|
Max Buy |
ALXN
-
NASDAQ
Alexion Pharmaceuticals
DRUGS - Drug Manufacturers - Other
|
$108.40
|
+1.19
1.11% |
$108.74
|
879,782
67.84% of 50 DAV
50 DAV is 1,296,800
|
$109.96
-1.42%
|
8/23/2012
|
$103.70
|
PP = $110.06
|
|
MB = $115.56
|
 Most Recent Note - 9/4/2012 4:21:07 PM
Y - Still perched within close striking distance of its 52-week high. Subsequent volume-driven gains above its pivot point may trigger a new (or add-on) technical buy signal.
>>> The latest Featured Stock Update with an annotated graph appeared on 8/23/2012. Click here.
View all notes |
Alert me of new notes |
CANSLIM.net Company Profile |
SEC |
Zacks Reports |
StockTalk |
News |
Chart |
Request a new note
C
A N
S L
I M


|
ASPS
-
NASDAQ
Altisource Ptf Sltns Sa
REAL ESTATE - Property Management/Developmen
|
$86.00
|
+1.71
2.03% |
$86.38
|
101,074
79.34% of 50 DAV
50 DAV is 127,400
|
$92.29
-6.82%
|
6/5/2012
|
$60.01
|
PP = $63.00
|
|
MB = $66.15
|
Most Recent Note - 8/30/2012 3:58:06 PM
G - Down today on below average volume, retreating -9.3% from its all-time high. It has been repeatedly noted - "Extended from its prior base, and its 50 DMA line defines near-term support to watch."
>>> The latest Featured Stock Update with an annotated graph appeared on 8/3/2012. Click here.
View all notes |
Alert me of new notes |
CANSLIM.net Company Profile |
SEC |
Zacks Reports |
StockTalk |
News |
Chart |
Request a new note
C
A N
S L
I M
|
CFNL
-
NASDAQ
Cardinal Financial Corp
BANKING - Regional - Southeast Banks
|
$13.28
|
+0.33
2.55% |
$13.36
|
68,489
108.54% of 50 DAV
50 DAV is 63,100
|
$13.30
-0.15%
|
8/17/2012
|
$12.84
|
PP = $13.31
|
|
MB = $13.98
|
Most Recent Note - 9/4/2012 4:15:30 PM
Y - Hit a new 52-week high today with a gain on near average volume. Disciplined investors know to watch for signs of fresh institutional buying demand as a reassurance. Previously noted - "Volume-driven gains above its pivot point may trigger a new (or add-on) technical buy signal, meanwhile its 50 DMA line defines important support."
>>> The latest Featured Stock Update with an annotated graph appeared on 8/21/2012. Click here.
View all notes |
Alert me of new notes |
CANSLIM.net Company Profile |
SEC |
Zacks Reports |
StockTalk |
News |
Chart |
Request a new note
C
A N
S L
I M
|
CMCSA
-
NASDAQ
Comcast Corp Cl A
MEDIA - CATV Systems
|
$33.53
|
-0.01
-0.01% |
$33.71
|
11,845,154
93.59% of 50 DAV
50 DAV is 12,656,200
|
$35.16
-4.65%
|
6/11/2012
|
$29.94
|
PP = $30.98
|
|
MB = $32.53
|
Most Recent Note - 9/4/2012 4:22:31 PM
G - Consolidating just above its 50 DMA line. Fundamental concerns were raised as it recently reported earnings +19% on +6% sales revenues for the Jun '12 quarter, below the fact-based investment system's +25% minimum guideline for the C criteria.
>>> The latest Featured Stock Update with an annotated graph appeared on 8/15/2012. Click here.
View all notes |
Alert me of new notes |
CANSLIM.net Company Profile |
SEC |
Zacks Reports |
StockTalk |
News |
Chart |
Request a new note
C
A N
S L
I M
|
ECPG
-
NASDAQ
Encore Capital Group Inc
FINANCIAL SERVICES - Credit Services
|
$28.25
|
+0.22
0.78% |
$28.45
|
147,313
105.90% of 50 DAV
50 DAV is 139,100
|
$30.47
-7.29%
|
8/3/2012
|
$29.91
|
PP = $30.45
|
|
MB = $31.97
|
Most Recent Note - 9/4/2012 4:23:32 PM
G - Still sputtering below its 50 DMA line and -7.3% off its 52-week high today. Completed a Secondary Offering on 8/08/12. Gains above its 50 DMA line are needed for its outlook to improve.
>>> The latest Featured Stock Update with an annotated graph appeared on 8/6/2012. Click here.
View all notes |
Alert me of new notes |
CANSLIM.net Company Profile |
SEC |
Zacks Reports |
StockTalk |
News |
Chart |
Request a new note
C
A N
S L
I M
|
Symbol/Exchange
Company Name
Industry Group |
PRICE |
CHANGE
(%Change) |
Day High |
Volume
(% DAV)
(% 50 day avg vol) |
52 Wk Hi
% From Hi |
Featured
Date |
Price
Featured |
Pivot Featured |
|
Max Buy |
EXPE
-
NASDAQ
Expedia Inc
INTERNET - Internet Information Providers
|
$51.99
|
+0.63
1.23% |
$52.39
|
1,840,240
54.13% of 50 DAV
50 DAV is 3,399,600
|
$59.50
-12.62%
|
4/27/2012
|
$41.80
|
PP = $35.57
|
|
MB = $37.35
|
Most Recent Note - 8/30/2012 3:59:47 PM
G - Volume totals have been cooling while consolidating above prior highs and its 50 DMA line defining important near-term chart support in the $50 area.
>>> The latest Featured Stock Update with an annotated graph appeared on 8/14/2012. Click here.
View all notes |
Alert me of new notes |
CANSLIM.net Company Profile |
SEC |
Zacks Reports |
StockTalk |
News |
Chart |
Request a new note
C
A N
S L
I M
|
GPX
-
NYSE
G P Strategies Corp
DIVERSIFIED SERVICES - Education and Training Services
|
$19.95
|
-0.10
-0.50% |
$20.00
|
87,025
112.29% of 50 DAV
50 DAV is 77,500
|
$20.67
-3.48%
|
6/29/2012
|
$18.01
|
PP = $18.15
|
|
MB = $19.06
|
Most Recent Note - 9/4/2012 4:25:13 PM
G - Perched -3.5% off its 52-week high today, slightly extended from its prior base. Churned above average volume recently without making much meaningful price progress, a sign of distributional pressure. Prior highs and its 50 DMA line define chart support in the $18 area.
>>> The latest Featured Stock Update with an annotated graph appeared on 8/7/2012. Click here.
View all notes |
Alert me of new notes |
CANSLIM.net Company Profile |
SEC |
Zacks Reports |
StockTalk |
News |
Chart |
Request a new note
C
A N
S L
I M
|
HMSY
-
NASDAQ
H M S Holdings Corp
COMPUTER SOFTWARE and SERVICES - Healthcare Information Service
|
$35.10
|
+0.64
1.86% |
$35.31
|
900,902
98.17% of 50 DAV
50 DAV is 917,700
|
$37.19
-5.62%
|
7/27/2012
|
$33.91
|
PP = $34.83
|
|
MB = $36.57
|
Most Recent Note - 9/4/2012 4:59:26 PM
Y - Still consolidating above its 50 DMA line. Volume-driven gains into new high territory would be a reassuring sign disciplined investors may wait for as an indication of fresh institutional accumulation.
>>> The latest Featured Stock Update with an annotated graph appeared on 8/22/2012. Click here.
View all notes |
Alert me of new notes |
CANSLIM.net Company Profile |
SEC |
Zacks Reports |
StockTalk |
News |
Chart |
Request a new note
C
A N
S L
I M
|
KH
-
NYSE
China Kanghui Hldgs Ads
HEALTH SERVICES - Medical Appliances and Equipment
|
$26.30
|
+1.31
5.24% |
$26.50
|
102,270
456.56% of 50 DAV
50 DAV is 22,400
|
$25.04
5.03%
|
8/30/2012
|
$24.19
|
PP = $22.90
|
|
MB = $24.05
|
Most Recent Note - 9/4/2012 12:19:24 PM
G - Color code is changed to green after getting extended from its latest base. Prior highs in the $23 area define support to watch on pullbacks. See the latest FSU analysis for more details and a new annotated graph.
>>> The latest Featured Stock Update with an annotated graph appeared on 8/30/2012. Click here.
View all notes |
Alert me of new notes |
CANSLIM.net Company Profile |
SEC |
Zacks Reports |
StockTalk |
News |
Chart |
Request a new note
C
A N
S L
I M
|
LKQ
-
NASDAQ
L K Q Corp
WHOLESALE - Auto Parts
|
$38.40
|
+0.66
1.75% |
$38.54
|
587,189
79.82% of 50 DAV
50 DAV is 735,600
|
$39.20
-2.04%
|
8/9/2012
|
$37.93
|
PP = $37.44
|
|
MB = $39.31
|
Most Recent Note - 8/30/2012 3:22:25 PM
Y - Down today with light volume, slumping back near its pivot point. Prior highs in the $37 area define initial support to watch above its 50 DMA line.
>>> The latest Featured Stock Update with an annotated graph appeared on 8/10/2012. Click here.
View all notes |
Alert me of new notes |
CANSLIM.net Company Profile |
SEC |
Zacks Reports |
StockTalk |
News |
Chart |
Request a new note
C
A N
S L
I M
|
Symbol/Exchange
Company Name
Industry Group |
PRICE |
CHANGE
(%Change) |
Day High |
Volume
(% DAV)
(% 50 day avg vol) |
52 Wk Hi
% From Hi |
Featured
Date |
Price
Featured |
Pivot Featured |
|
Max Buy |
MIDD
-
NASDAQ
Middleby Corp
MANUFACTURING - Diversified Machinery
|
$118.50
|
+3.35
2.91% |
$118.88
|
137,437
138.41% of 50 DAV
50 DAV is 99,300
|
$119.74
-1.04%
|
8/9/2012
|
$118.60
|
PP = $104.92
|
|
MB = $110.17
|
Most Recent Note - 9/4/2012 4:17:28 PM
G - Rallied to a best-ever close today with above average volume behind its gain. Extended from its prior base, its 50 DMA line and prior highs in the $104 area define important chart support to watch.
>>> The latest Featured Stock Update with an annotated graph appeared on 8/13/2012. Click here.
View all notes |
Alert me of new notes |
CANSLIM.net Company Profile |
SEC |
Zacks Reports |
StockTalk |
News |
Chart |
Request a new note
C
A N
S L
I M
|
N
-
NYSE
Netsuite Inc
DIVERSIFIED SERVICES - Business/Management Services
|
$56.39
|
-0.49
-0.86% |
$57.36
|
375,207
53.73% of 50 DAV
50 DAV is 698,300
|
$59.22
-4.78%
|
8/20/2012
|
$55.88
|
PP = $59.32
|
|
MB = $62.29
|
Most Recent Note - 8/31/2012 5:20:11 PM
Y - Posted a solid gain on light volume today. Volume totals have been cooling while consolidating in a tight range near its 52-week high. A volume-driven gain above its pivot point may trigger a new (or add-on) technical buy signal. Meanwhile, its 50 DMA line defines important near-term support.
>>> The latest Featured Stock Update with an annotated graph appeared on 8/20/2012. Click here.
View all notes |
Alert me of new notes |
CANSLIM.net Company Profile |
SEC |
Zacks Reports |
StockTalk |
News |
Chart |
Request a new note
C
A N
S L
I M
|
NSM
-
NYSE
Nationstar Mtg Hldgs Inc
FINANCIAL SERVICES - Credit Services
|
$28.76
|
+1.64
6.05% |
$29.10
|
1,468,482
183.86% of 50 DAV
50 DAV is 798,700
|
$28.75
0.03%
|
8/29/2012
|
$27.96
|
PP = $28.85
|
|
MB = $30.29
|
Most Recent Note - 9/4/2012 12:24:06 PM
Y - Perched near its 52-week high today. Color code was changed to yellow with new pivot point cited based on its 8/17/12 high plus 10 cent while working on an advanced "ascending base" pattern. Managed an impressive a "positive reversal" on 8/27/12 while finding support near prior highs in the $25 area. Subsequent volume-driven gains above the pivot point may trigger a new (or add-on) technical buy signal.
>>> The latest Featured Stock Update with an annotated graph appeared on 8/1/2012. Click here.
View all notes |
Alert me of new notes |
CANSLIM.net Company Profile |
SEC |
Zacks Reports |
StockTalk |
News |
Chart |
Request a new note
C
A N
S L
I M
|
OSIS
-
NASDAQ
O S I Systems Inc
ELECTRONICS - Semiconductor Equipment and Mate
|
$74.69
|
+0.59
0.80% |
$74.97
|
114,827
102.34% of 50 DAV
50 DAV is 112,200
|
$75.00
-0.41%
|
8/9/2012
|
$67.71
|
PP = $67.48
|
|
MB = $70.85
|
Most Recent Note - 8/30/2012 12:42:15 PM
G - Still hovering near its 52-week high in a very tight trading range. Ending the week near its current level could form an advanced "3-weeks tight" base pattern. Prior highs in the $67-68 area define initial support to watch on pullbacks.
>>> The latest Featured Stock Update with an annotated graph appeared on 8/9/2012. Click here.
View all notes |
Alert me of new notes |
CANSLIM.net Company Profile |
SEC |
Zacks Reports |
StockTalk |
News |
Chart |
Request a new note
C
A N
S L
I M
|
RNF
-
NYSE
Rentech Nitrogen Ptnr Lp
CHEMICALS - Agricultural Chemicals
|
$34.57
|
+0.60
1.77% |
$35.00
|
488,545
111.80% of 50 DAV
50 DAV is 437,000
|
$34.75
-0.52%
|
7/27/2012
|
$29.58
|
PP = $30.60
|
|
MB = $32.13
|
Most Recent Note - 8/31/2012 5:38:39 PM
G - Holding its ground perched near its high with volume totals cooling in recent weeks. It is extended from its prior base with near-term support at prior highs in the $30-31 area and its 50 DMA line. See the latest FSU analysis for more details and a new annotated graph.
>>> The latest Featured Stock Update with an annotated graph appeared on 8/31/2012. Click here.
View all notes |
Alert me of new notes |
CANSLIM.net Company Profile |
SEC |
Zacks Reports |
StockTalk |
News |
Chart |
Request a new note
C
A N
S L
I M
|
Symbol/Exchange
Company Name
Industry Group |
PRICE |
CHANGE
(%Change) |
Day High |
Volume
(% DAV)
(% 50 day avg vol) |
52 Wk Hi
% From Hi |
Featured
Date |
Price
Featured |
Pivot Featured |
|
Max Buy |
SWI
-
NYSE
Solarwinds Inc
COMPUTER SOFTWARE and SERVICES - Application Software
|
$58.62
|
+3.74
6.81% |
$58.81
|
2,315,022
190.60% of 50 DAV
50 DAV is 1,214,600
|
$56.94
2.95%
|
7/25/2012
|
$47.82
|
PP = $47.89
|
|
MB = $50.28
|
Most Recent Note - 9/4/2012 12:37:08 PM
G - Volume is running at an above average pace today while hitting a new all-time high. Its 50 DMA line and prior highs coincide in the $48 area defining important chart support to watch on pullbacks.
>>> The latest Featured Stock Update with an annotated graph appeared on 8/29/2012. Click here.
View all notes |
Alert me of new notes |
CANSLIM.net Company Profile |
SEC |
Zacks Reports |
StockTalk |
News |
Chart |
Request a new note
C
A N
S L
I M
|
TDG
-
NYSE
Transdigm Group Inc
AEROSPACE/DEFENSE - Aerospace/Defense Products and; Services
|
$138.67
|
+0.05
0.04% |
$139.02
|
283,522
71.47% of 50 DAV
50 DAV is 396,700
|
$143.15
-3.13%
|
8/16/2012
|
$132.23
|
PP = $136.44
|
|
MB = $143.26
|
Most Recent Note - 9/4/2012 4:27:37 PM
Y - Hovering near its 52-week high. Prior high near $136 defines near-term chart support. Disciplined investors always limit losses if ever any stock falls -7% from their purchase price.
>>> The latest Featured Stock Update with an annotated graph appeared on 8/17/2012. Click here.
View all notes |
Alert me of new notes |
CANSLIM.net Company Profile |
SEC |
Zacks Reports |
StockTalk |
News |
Chart |
Request a new note
C
A N
S L
I M
|
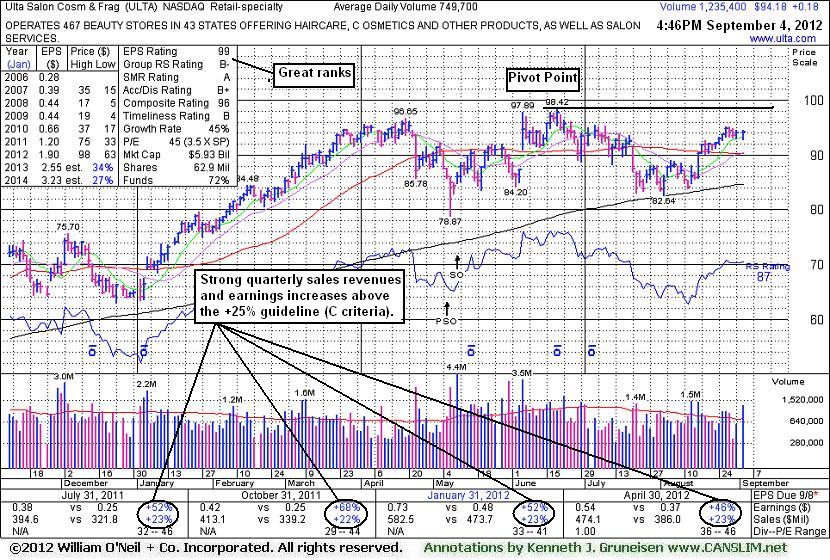
ULTA
-
NASDAQ
Ulta Salon Cosm & Frag
SPECIALTY RETAIL - Specialty Retail, Other
|
$94.18
|
+0.18
0.19% |
$94.55
|
1,235,410
164.79% of 50 DAV
50 DAV is 749,700
|
$98.42
-4.31%
|
9/4/2012
|
$93.17
|
PP = $98.52
|
|
MB = $103.45
|
Most Recent Note - 9/4/2012 4:55:29 PM
Y - Highlighted in yellow in the earlier mid-day report while building on the current 11-week base during which it found support at its 200 DMA line. New pivot point cited is based on its 6/20/12 high plus 10 cents. Little resistance remains due to overhead supply while consolidating -4.3% off its 52-week high, however volume-driven gains above its pivot point are needed to trigger a technical buy signal. Reported earnings +46% on +23% sales revenues for the quarter ended April 30, 2012 versus the year ago period. Completed a Secondary Offering on 5/10/12. See the latest FSU analysis for more details and a new annotated graph.
>>> The latest Featured Stock Update with an annotated graph appeared on 9/4/2012. Click here.
View all notes |
Alert me of new notes |
CANSLIM.net Company Profile |
SEC |
Zacks Reports |
StockTalk |
News |
Chart |
Request a new note
C
A N
S L
I M
|
ULTI
-
NASDAQ
Ultimate Software Group
INTERNET - Internet Software and Services
|
$99.95
|
+0.76
0.77% |
$100.00
|
119,446
75.50% of 50 DAV
50 DAV is 158,200
|
$100.83
-0.87%
|
8/27/2012
|
$98.36
|
PP = $99.19
|
|
MB = $104.15
|
Most Recent Note - 9/4/2012 4:57:08 PM
Y - Tallied a 4th consecutive gain today with light volume and finished at a best-ever close. A volume-driven gain and strong close above its pivot point may trigger technical buy signal.
>>> The latest Featured Stock Update with an annotated graph appeared on 8/27/2012. Click here.
View all notes |
Alert me of new notes |
CANSLIM.net Company Profile |
SEC |
Zacks Reports |
StockTalk |
News |
Chart |
Request a new note
C
A N
S L
I M
|
VSI
-
NYSE
Vitamin Shoppe Inc
SPECIALTY RETAIL - Specialty Retail, Other
|
$56.35
|
+2.74
5.11% |
$56.53
|
549,685
146.82% of 50 DAV
50 DAV is 374,400
|
$61.83
-8.86%
|
6/29/2012
|
$54.93
|
PP = $55.03
|
|
MB = $57.78
|
Most Recent Note - 9/4/2012 4:13:55 PM
G - Rallied back above its 50 DMA line today with a considerable volume-driven gain helping its technical stance. Prior low ($52.41 on 7/23/12) defines a near-term support level where any further deterioration would raise more serious concerns.
>>> The latest Featured Stock Update with an annotated graph appeared on 8/2/2012. Click here.
View all notes |
Alert me of new notes |
CANSLIM.net Company Profile |
SEC |
Zacks Reports |
StockTalk |
News |
Chart |
Request a new note
C
A N
S L
I M
|
Symbol/Exchange
Company Name
Industry Group |
PRICE |
CHANGE
(%Change) |
Day High |
Volume
(% DAV)
(% 50 day avg vol) |
52 Wk Hi
% From Hi |
Featured
Date |
Price
Featured |
Pivot Featured |
|
Max Buy |
WPI
-
NYSE
Watson Pharmaceuticals
DRUGS - Drugs - Generic
|
$83.06
|
+1.71
2.10% |
$83.24
|
1,152,938
87.42% of 50 DAV
50 DAV is 1,318,800
|
$83.83
-0.92%
|
8/24/2012
|
$82.90
|
PP = $81.10
|
|
MB = $85.16
|
Most Recent Note - 9/4/2012 4:28:34 PM
Y - Still holding its ground since triggering a technical buy signal on 8/24/12 when highlighted in the mid-day report with a gap up gain backed by above average volume. Prior highs in the $81 area define initial support to watch on pullbacks.
>>> The latest Featured Stock Update with an annotated graph appeared on 8/28/2012. Click here.
View all notes |
Alert me of new notes |
CANSLIM.net Company Profile |
SEC |
Zacks Reports |
StockTalk |
News |
Chart |
Request a new note
C
A N
S L
I M
|