***Last / Change / Volume data in this table is the closing quote data***
Symbol/Exchange
Company Name
Industry Group |
PRICE |
CHANGE
(%Change) |
Day High |
Volume
(% DAV)
(% 50 day avg vol) |
52 Wk Hi
% From Hi |
Featured
Date |
Price
Featured |
Pivot Featured |
|
Max Buy |
ABV
-
NYSE
Comp De Bebidas Adr
FOOD and BEVERAGE - Beverages - Brewers
|
$112.58
|
-0.63
-0.56% |
$114.05
|
492,548
75.36% of 50 DAV
50 DAV is 653,600
|
$114.23
-1.44%
|
6/29/2010
|
$104.74
|
PP = $109.33
|
|
MB = $114.80
|
Most Recent Note - 8/31/2010 3:54:13 PM
G - This Brazil-based beverage firm is poised for a new high close with today's gain. Found support near its 50 DMA line recently.
>>> The latest Featured Stock Update with an annotated graph appeared on 8/18/2010. Click here.
View all notes |
Alert me of new notes |
CANSLIM.net Company Profile |
SEC |
Zacks Reports |
StockTalk |
News |
Chart |
Request a new note
C
A N
S L
I M


|
ARUN
-
NASDAQ
Aruba Networks Inc
COMPUTER HARDWARE - Networking andamp; Communication Dev
|
$19.49
|
+0.67
3.56% |
$19.56
|
3,012,059
172.90% of 50 DAV
50 DAV is 1,742,100
|
$19.32
0.88%
|
8/30/2010
|
$18.12
|
PP = $18.51
|
|
MB = $19.44
|
 Most Recent Note - 9/3/2010 12:43:05 PM
Y - Hit a new 52-week high today. Confirming gains and a follow-through day on 9/01/10 (M criteria) helped trigger a technical buy signal.
>>> The latest Featured Stock Update with an annotated graph appeared on 9/2/2010. Click here.
View all notes |
Alert me of new notes |
CANSLIM.net Company Profile |
SEC |
Zacks Reports |
StockTalk |
News |
Chart |
Request a new note
C
A N
S L
I M
|
BIDU
-
NASDAQ
Baidu Inc Ads
INTERNET - Internet Information Providers
|
$84.30
|
+1.69
2.05% |
$84.58
|
7,326,630
68.90% of 50 DAV
50 DAV is 10,633,400
|
$88.32
-4.55%
|
7/14/2010
|
$75.03
|
PP = $78.59
|
|
MB = $82.52
|
Most Recent Note - 9/3/2010 5:33:59 PM
Y - Posted a 4th consecutive gain today with below average volume. Color code was changed to yellow as gains helping it rally from its 10-week average may be considered a secondary buy point. However, it may be considered "late-stage" and riskier than fresh breakouts.
>>> The latest Featured Stock Update with an annotated graph appeared on 8/13/2010. Click here.
View all notes |
Alert me of new notes |
CANSLIM.net Company Profile |
SEC |
Zacks Reports |
StockTalk |
News |
Chart |
Request a new note
C
A N
S L
I M
|
CACC
-
NASDAQ
Credit Acceptance Corp
FINANCIAL SERVICES - Credit Services
|
$59.49
|
+0.00
0.00% |
$59.50
|
34,401
64.06% of 50 DAV
50 DAV is 53,700
|
$61.41
-3.13%
|
7/29/2010
|
$52.04
|
PP = $54.07
|
|
MB = $56.77
|
Most Recent Note - 9/1/2010 3:36:35 PM
G - Gain today on light volume. Consolidating well above its 50 DMA and old highs near $54 that define support.
>>> The latest Featured Stock Update with an annotated graph appeared on 8/2/2010. Click here.
View all notes |
Alert me of new notes |
CANSLIM.net Company Profile |
SEC |
Zacks Reports |
StockTalk |
News |
Chart |
Request a new note
C
A N
S L
I M
|
CMG
-
NYSE
Chipotle Mexican Grill
LEISURE - Restaurants
|
$163.51
|
-0.68
-0.41% |
$166.52
|
725,807
105.97% of 50 DAV
50 DAV is 684,900
|
$164.19
-0.41%
|
9/1/2010
|
$158.31
|
PP = $155.52
|
|
MB = $163.30
|
Most Recent Note - 9/3/2010 12:47:02 PM
Y - Gapped up again today and then reversed into the red, now trading near its "max buy" level. Technically, it broke out on 9/01/10, rallying to multi-year highs with a considerable gain backed 2 times average volume. The latest Featured Stock Update includes detailed analysis and an annotated graph.
>>> The latest Featured Stock Update with an annotated graph appeared on 9/1/2010. Click here.
View all notes |
Alert me of new notes |
CANSLIM.net Company Profile |
SEC |
Zacks Reports |
StockTalk |
News |
Chart |
Request a new note
C
A N
S L
I M
|
Symbol/Exchange
Company Name
Industry Group |
PRICE |
CHANGE
(%Change) |
Day High |
Volume
(% DAV)
(% 50 day avg vol) |
52 Wk Hi
% From Hi |
Featured
Date |
Price
Featured |
Pivot Featured |
|
Max Buy |
CRM
-
NYSE
Salesforce.Com Inc
INTERNET - Internet Software and Services
|
$119.63
|
+0.51
0.43% |
$121.45
|
4,119,266
160.47% of 50 DAV
50 DAV is 2,567,000
|
$119.59
0.03%
|
6/2/2010
|
$88.44
|
PP = $89.60
|
|
MB = $94.08
|
Most Recent Note - 9/3/2010 12:52:00 PM
G - Gain today for yet another new all-time high. It is extended from a sound base, not currently buyable under the investment system guidelines.
>>> The latest Featured Stock Update with an annotated graph appeared on 8/16/2010. Click here.
View all notes |
Alert me of new notes |
CANSLIM.net Company Profile |
SEC |
Zacks Reports |
StockTalk |
News |
Chart |
Request a new note
C
A N
S L
I M
|
EGO
-
NYSE
Eldorado Gold Corp
METALS and MINING - Gold
|
$19.10
|
-0.36
-1.85% |
$19.14
|
6,406,926
156.02% of 50 DAV
50 DAV is 4,106,500
|
$20.06
-4.79%
|
8/19/2010
|
$18.25
|
PP = $19.17
|
|
MB = $20.13
|
Most Recent Note - 9/3/2010 5:54:31 PM
Y - Gapped down today for a loss with above average volume, a sign of distribution. It closed near the session high, but the loss led it to finish the week just below its pivot point.
>>> The latest Featured Stock Update with an annotated graph appeared on 8/19/2010. Click here.
View all notes |
Alert me of new notes |
CANSLIM.net Company Profile |
SEC |
Zacks Reports |
StockTalk |
News |
Chart |
Request a new note
C
A N
S L
I M
|
FFIV
-
NASDAQ
F 5 Networks Inc
INTERNET - Internet Software and Services
|
$93.80
|
+2.69
2.95% |
$94.47
|
1,211,028
72.84% of 50 DAV
50 DAV is 1,662,700
|
$92.70
1.19%
|
6/16/2010
|
$74.50
|
PP = $74.10
|
|
MB = $77.81
|
Most Recent Note - 9/3/2010 6:00:15 PM
G - Gapped up today and rallied to a new all-time high. It has not recently formed a sound base, and an upward trendline defines near-term support above its 50 DMA line and prior low ($80).
>>> The latest Featured Stock Update with an annotated graph appeared on 8/4/2010. Click here.
View all notes |
Alert me of new notes |
CANSLIM.net Company Profile |
SEC |
Zacks Reports |
StockTalk |
News |
Chart |
Request a new note
C
A N
S L
I M
|
FOSL
-
NASDAQ
Fossil Inc
CONSUMER DURABLES - Recreational Goods, Other
|
$50.20
|
+0.29
0.58% |
$50.48
|
654,832
72.64% of 50 DAV
50 DAV is 901,500
|
$50.38
-0.35%
|
8/10/2010
|
$45.54
|
PP = $42.69
|
|
MB = $44.82
|
Most Recent Note - 9/3/2010 6:02:21 PM
G - Closed a big up week at a new all-time high. Extended from any sound base after a recent streak of gains. Prior high in the $46 area defines support to watch.
>>> The latest Featured Stock Update with an annotated graph appeared on 8/11/2010. Click here.
View all notes |
Alert me of new notes |
CANSLIM.net Company Profile |
SEC |
Zacks Reports |
StockTalk |
News |
Chart |
Request a new note
C
A N
S L
I M
|
GMCR
-
NASDAQ
Green Mtn Coffee Roastrs
FOOD and BEVERAGE - Processed and Packaged Goods
|
$31.97
|
+0.64
2.04% |
$32.15
|
1,494,461
65.79% of 50 DAV
50 DAV is 2,271,500
|
$33.98
-5.92%
|
8/17/2010
|
$33.62
|
PP = $33.30
|
|
MB = $34.97
|
Most Recent Note - 9/3/2010 6:04:34 PM
Y - Closed -6% off its all-time high, consolidating above its 50 DMA line. It has formed a handle after the previously noted cup shaped pattern. Confirming gains for a new high close are needed to trigger a buy signal.
>>> The latest Featured Stock Update with an annotated graph appeared on 8/17/2010. Click here.
View all notes |
Alert me of new notes |
CANSLIM.net Company Profile |
SEC |
Zacks Reports |
StockTalk |
News |
Chart |
Request a new note
C
A N
S L
I M
|
Symbol/Exchange
Company Name
Industry Group |
PRICE |
CHANGE
(%Change) |
Day High |
Volume
(% DAV)
(% 50 day avg vol) |
52 Wk Hi
% From Hi |
Featured
Date |
Price
Featured |
Pivot Featured |
|
Max Buy |
HS
-
NYSE
Healthspring Inc
HEALTH SERVICES - Health Care Plans
|
$22.22
|
+0.49
2.25% |
$22.32
|
639,274
108.92% of 50 DAV
50 DAV is 586,900
|
$21.82
1.83%
|
8/27/2010
|
$19.91
|
PP = $19.75
|
|
MB = $20.74
|
Most Recent Note - 9/3/2010 6:06:33 PM
G - Hit another new 52-week high today. Extended from its prior base, support to watch now is prior chart highs in the $19-20 area.
>>> The latest Featured Stock Update with an annotated graph appeared on 8/27/2010. Click here.
View all notes |
Alert me of new notes |
CANSLIM.net Company Profile |
SEC |
Zacks Reports |
StockTalk |
News |
Chart |
Request a new note
C
A N
S L
I M
|
MELI
-
NASDAQ
Mercadolibre Inc
INTERNET - Internet Software and; Services
|
$70.37
|
+0.48
0.69% |
$72.87
|
752,699
74.14% of 50 DAV
50 DAV is 1,015,300
|
$71.10
-1.03%
|
5/13/2010
|
$54.21
|
PP = $55.85
|
|
MB = $58.64
|
Most Recent Note - 9/2/2010 11:18:23 AM
G - Hit a new 52-week high today, getting extended from any sound base. Prior highs in the $62 area and its 50 DMA line define chart support.
>>> The latest Featured Stock Update with an annotated graph appeared on 8/26/2010. Click here.
View all notes |
Alert me of new notes |
CANSLIM.net Company Profile |
SEC |
Zacks Reports |
StockTalk |
News |
Chart |
Request a new note
C
A N
S L
I M
|
MRX
-
NYSE
Medicis Pharmaceut Cl A
DRUGS - Biotechnology
|
$29.80
|
+0.33
1.12% |
$30.00
|
1,139,905
96.95% of 50 DAV
50 DAV is 1,175,800
|
$29.61
0.64%
|
8/12/2010
|
$26.88
|
PP = $26.71
|
|
MB = $28.05
|
Most Recent Note - 9/2/2010 12:45:06 PM
G - Hit another new 52-week high today. Color code was changed to green after volume-driven gains beyond its "max buy" level. Prior highs in the $28 area define an initial chart support level to watch.
>>> The latest Featured Stock Update with an annotated graph appeared on 8/12/2010. Click here.
View all notes |
Alert me of new notes |
CANSLIM.net Company Profile |
SEC |
Zacks Reports |
StockTalk |
News |
Chart |
Request a new note
C
A N
S L
I M
|
MWIV
-
NASDAQ
M W I Veterinary Supply
HEALTH SERVICES - Medical Instruments and; Supplies
|
$55.35
|
+0.08
0.14% |
$55.91
|
31,322
40.26% of 50 DAV
50 DAV is 77,800
|
$55.48
-0.23%
|
7/29/2010
|
$52.05
|
PP = $52.09
|
|
MB = $54.69
|
Most Recent Note - 9/2/2010 4:49:14 PM
G - Gain on light volume today for a new all-time high above its "max buy" level. Color code is changed to green. Recent lows in the $46 area define an important chart support level.
>>> The latest Featured Stock Update with an annotated graph appeared on 7/30/2010. Click here.
View all notes |
Alert me of new notes |
CANSLIM.net Company Profile |
SEC |
Zacks Reports |
StockTalk |
News |
Chart |
Request a new note
C
A N
S L
I M
|
NEM
-
NYSE
Newmont Mining Corp
METALS and MINING - Gold
|
$60.87
|
-0.51
-0.83% |
$61.00
|
4,527,542
62.15% of 50 DAV
50 DAV is 7,284,600
|
$63.38
-3.96%
|
8/31/2010
|
$61.32
|
PP = $63.48
|
|
MB = $66.65
|
Most Recent Note - 9/2/2010 4:50:51 PM
Y - Closed 40 cents off its 7/09/10 high close today with gain on light volume. Color code was changed to yellow with new pivot point cited based on its 52-week high plus ten cents. Disciplined investors will watch for a confirming gain above its pivot with heavy volume. Leadership in the Mining - Gold/Silver/Gems group (L criteria) is a nice reassurance.
>>> The latest Featured Stock Update with an annotated graph appeared on 8/6/2010. Click here.
View all notes |
Alert me of new notes |
CANSLIM.net Company Profile |
SEC |
Zacks Reports |
StockTalk |
News |
Chart |
Request a new note
C
A N
S L
I M
|
Symbol/Exchange
Company Name
Industry Group |
PRICE |
CHANGE
(%Change) |
Day High |
Volume
(% DAV)
(% 50 day avg vol) |
52 Wk Hi
% From Hi |
Featured
Date |
Price
Featured |
Pivot Featured |
|
Max Buy |
NEOG
-
NASDAQ
Neogen Corp
DRUGS - Diagnostic Substances
|
$31.77
|
+1.04
3.38% |
$31.80
|
82,682
97.85% of 50 DAV
50 DAV is 84,500
|
$31.19
1.86%
|
9/1/2010
|
$30.79
|
PP = $30.49
|
|
MB = $32.01
|
Most Recent Note - 9/3/2010 6:09:26 PM
Y- Gapped up today and closed near the session high at a new all-time high. Technically, its 9/01/10 gain above the new pivot point cited triggered a buy signal after an orderly 5-week base-on-base pattern.
>>> The latest Featured Stock Update with an annotated graph appeared on 8/20/2010. Click here.
View all notes |
Alert me of new notes |
CANSLIM.net Company Profile |
SEC |
Zacks Reports |
StockTalk |
News |
Chart |
Request a new note
C
A N
S L
I M
|
NFLX
-
NASDAQ
Netflix Inc
SPECIALTY RETAIL - Music and Video Stores
|
$138.48
|
+0.48
0.35% |
$142.50
|
4,970,948
113.19% of 50 DAV
50 DAV is 4,391,800
|
$140.90
-1.72%
|
8/10/2010
|
$124.05
|
PP = $124.00
|
|
MB = $130.20
|
Most Recent Note - 9/3/2010 1:14:28 PM
G- Hit a new all-time high today, and no resistance remains to hinder its progress. It has risen beyond its "max buy" level after holding its ground and finding recent support near its pivot point.
>>> The latest Featured Stock Update with an annotated graph appeared on 8/10/2010. Click here.
View all notes |
Alert me of new notes |
CANSLIM.net Company Profile |
SEC |
Zacks Reports |
StockTalk |
News |
Chart |
Request a new note
C
A N
S L
I M
|
PAY
-
NYSE
Verifone Systems Inc
COMPUTER HARDWARE - Transaction Automation Systems
|
$26.56
|
+1.00
3.91% |
$26.70
|
1,273,932
102.52% of 50 DAV
50 DAV is 1,242,600
|
$25.90
2.55%
|
8/25/2010
|
$24.30
|
PP = $23.74
|
|
MB = $24.93
|
Most Recent Note - 9/3/2010 6:11:04 PM
G - Gapped up today and hit a new 52-week high. Disciplined investors may watch for chances to accumulate shares on pullbacks toward prior highs in the $23 area defining chart support.
>>> The latest Featured Stock Update with an annotated graph appeared on 8/30/2010. Click here.
View all notes |
Alert me of new notes |
CANSLIM.net Company Profile |
SEC |
Zacks Reports |
StockTalk |
News |
Chart |
Request a new note
C
A N
S L
I M
|
ROVI
-
NASDAQ
Rovi Corp
COMPUTER SOFTWARE andamp; SERVICES - Security Software andamp; Services
|
$43.88
|
+0.53
1.22% |
$44.06
|
682,098
60.76% of 50 DAV
50 DAV is 1,122,600
|
$44.96
-2.40%
|
8/31/2010
|
$43.31
|
PP = $45.06
|
|
MB = $47.31
|
Most Recent Note - 9/2/2010 1:02:00 PM
Y - Gapped down today, consolidating above support at its 50 DMA line while only -3.6% off its 52-week high. Color code was changed to yellow with new pivot point cited while building a base-on-base type pattern.
>>> The latest Featured Stock Update with an annotated graph appeared on 8/24/2010. Click here.
View all notes |
Alert me of new notes |
CANSLIM.net Company Profile |
SEC |
Zacks Reports |
StockTalk |
News |
Chart |
Request a new note
C
A N
S L
I M
|
SHOO
-
NASDAQ
Steven Madden Limited
CONSUMER NON-DURABLES - Textile - Apparel Footwear
|
$37.38
|
+1.11
3.06% |
$37.84
|
359,216
84.30% of 50 DAV
50 DAV is 426,100
|
$40.98
-8.78%
|
8/5/2010
|
$39.55
|
PP = $41.08
|
|
MB = $43.13
|
Most Recent Note - 9/3/2010 6:16:41 PM
Y - Gapped up today for a 4th consecutive gain. Color code is changed to yellow while subsequent gains above the pivot point previously cited are still needed to confirm a proper buy signal.
>>> The latest Featured Stock Update with an annotated graph appeared on 8/5/2010. Click here.
View all notes |
Alert me of new notes |
CANSLIM.net Company Profile |
SEC |
Zacks Reports |
StockTalk |
News |
Chart |
Request a new note
C
A N
S L
I M
|
Symbol/Exchange
Company Name
Industry Group |
PRICE |
CHANGE
(%Change) |
Day High |
Volume
(% DAV)
(% 50 day avg vol) |
52 Wk Hi
% From Hi |
Featured
Date |
Price
Featured |
Pivot Featured |
|
Max Buy |
SLW
-
NYSE
Silver Wheaton Corp
METALS and; MINING - Silver
|
$23.89
|
+0.74
3.20% |
$23.98
|
5,546,129
119.95% of 50 DAV
50 DAV is 4,623,600
|
$23.58
1.31%
|
8/25/2010
|
$21.40
|
PP = $21.99
|
|
MB = $23.09
|
Most Recent Note - 9/3/2010 1:29:18 PM
G - Hit another new all-time high today. The M criteria has improved since the 9/01/10 follow-through day confirmed a new rally. Disciplined investors may be patient and watch for secondary buy points to develop. Previous highs in the $21 area are now a support level to watch.
>>> The latest Featured Stock Update with an annotated graph appeared on 8/25/2010. Click here.
View all notes |
Alert me of new notes |
CANSLIM.net Company Profile |
SEC |
Zacks Reports |
StockTalk |
News |
Chart |
Request a new note
C
A N
S L
I M
|
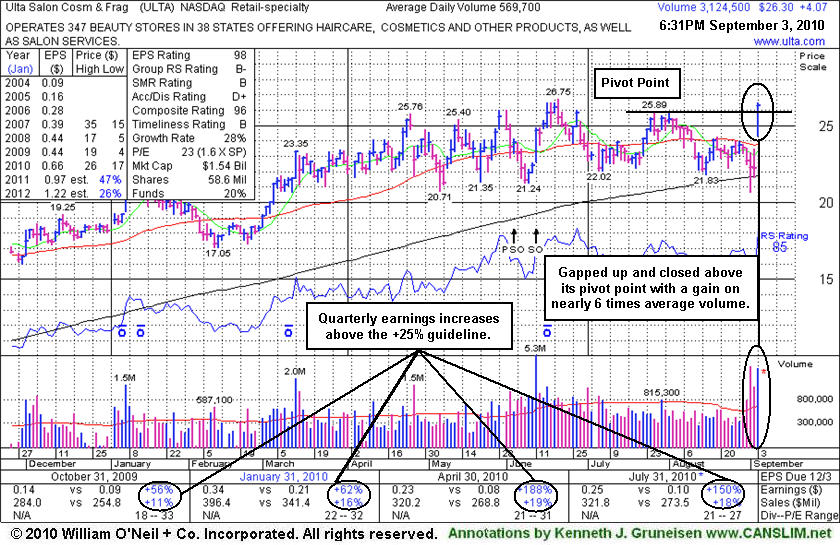
ULTA
-
NASDAQ
Ulta Salon Cosm & Frag
SPECIALTY RETAIL - Specialty Retail, Other
|
$26.30
|
+4.07
18.31% |
$26.47
|
3,125,653
626.89% of 50 DAV
50 DAV is 498,600
|
$26.75
-1.68%
|
9/3/2010
|
$26.36
|
PP = $25.89
|
|
MB = $27.18
|
Most Recent Note - 9/3/2010 1:35:16 PM
Y - Gapped up today, rallying above its 50 DMA line and challenging its 52-week high. Color code is changed to yellow with new pivot point cited. Based on weak action it was dropped from the Featured Stocks list on 8/13/10. In the interim it found support again near its 200 DMA line and prior lows in the $21-22 area.
>>> The latest Featured Stock Update with an annotated graph appeared on 9/3/2010. Click here.
View all notes |
Alert me of new notes |
CANSLIM.net Company Profile |
SEC |
Zacks Reports |
StockTalk |
News |
Chart |
Request a new note
C
A N
S L
I M
|
VIT
-
NYSE
Vanceinfo Tech Inc Ads
COMPUTER SOFTWARE and SERVICES - Business Software and Services
|
$29.78
|
+0.25
0.85% |
$29.96
|
323,998
57.29% of 50 DAV
50 DAV is 565,500
|
$29.80
-0.07%
|
7/8/2010
|
$25.20
|
PP = $26.58
|
|
MB = $27.91
|
Most Recent Note - 9/2/2010 4:57:10 PM
G - Gain today with light volume for a new high close. Patient investors may watch for secondary buy points. Recent gains lifted it more than +5% above its old chart highs.
>>> The latest Featured Stock Update with an annotated graph appeared on 8/31/2010. Click here.
View all notes |
Alert me of new notes |
CANSLIM.net Company Profile |
SEC |
Zacks Reports |
StockTalk |
News |
Chart |
Request a new note
C
A N
S L
I M
|
WCRX
-
NASDAQ
Warner Chilcott Plc
DRUGS - Drug Manufacturers - Other
|
$29.28
|
-0.09
-0.31% |
$29.65
|
1,039,326
59.63% of 50 DAV
50 DAV is 1,743,100
|
$30.57
-4.22%
|
8/23/2010
|
$29.54
|
PP = $29.34
|
|
MB = $30.81
|
Most Recent Note - 9/1/2010 2:10:08 PM
Y - Volume totals have been cooling while it remains perched near its pivot point. It was featured in yellow in the mid-day report on 8/23/10 rising from a cup shaped base.
>>> The latest Featured Stock Update with an annotated graph appeared on 8/23/2010. Click here.
View all notes |
Alert me of new notes |
CANSLIM.net Company Profile |
SEC |
Zacks Reports |
StockTalk |
News |
Chart |
Request a new note
C
A N
S L
I M
|