You are not logged in.
This means you
CAN ONLY VIEW reports that were published prior to Monday, April 14, 2025.
You
MUST UPGRADE YOUR MEMBERSHIP if you want to see any current reports.
AFTER MARKET UPDATE - TUESDAY, SEPTEMBER 1ST, 2009
Previous After Market Report Next After Market Report >>>
|
|
|
|
DOW |
-185.68 |
9,310.60 |
-1.96% |
|
Volume |
1,634,824,100 |
+19% |
|
Volume |
2,863,683,770 |
+19% |
|
NASDAQ |
-40.17 |
1,968.89 |
-2.00% |
|
Advancers |
513 |
16% |
|
Advancers |
585 |
21% |
|
S&P 500 |
-22.58 |
998.04 |
-2.21% |
|
Decliners |
2,542 |
81% |
|
Decliners |
2,165 |
76% |
|
Russell 2000 |
-14.01 |
558.06 |
-2.45% |
|
52 Wk Highs |
63 |
|
|
52 Wk Highs |
38 |
|
|
S&P 600 |
-6.48 |
295.74 |
-2.14% |
|
52 Wk Lows |
1 |
|
|
52 Wk Lows |
9 |
|
|
 |
Indices' Losses On Higher Volume Signal Rally Under Pressure Again
Adam Sarhan, Contributing Writer,
The major averages got clobbered, suffered another distribution day, and negatively reversed on higher volume than the prior session as the first trading day in September kicked off. Decliners trumped advancers by about a 5-to-1 ratio on the NYSE and by a 4-to-1 ratio on the Nasdaq exchange. There were only 5 high-ranked companies from the CANSLIM.net Leaders List that made a new 52-week high and appeared on the CANSLIM.net BreakOuts Page, lower than the 8 issues that appeared on the prior session. New 52-week highs still outnumbered new 52-week lows on both exchanges while new lows were in the single digits again.
Before Tuesday's opening bell, equity futures were in the red in reaction to negative economic data released in England overnight. The negative data sent European markets and US futures lower before the first opening bell rang in September. However, the US market spent the first hour advancing after two stronger than expected economic reports were released. The Institute for Supply Management’s manufacturing index rose to 52.9 which topped forecasts and the boom/bust reading of 50. The reading was the highest level since June 2007 and signaled expansion. A separate report showed that more Americans than anticipated signed contracts to buy existing homes in July, also known as pending home sales. Unfortunately, the bears showed up and sent a slew of leading stocks and the major averages sharply lower. This ominous action puts the current rally under serious pressure and reiterates the importance of remaining in cash until a new batch of healthy leadership emerges.
The S&P 500 Index soared over +50% from its 11-year low set in March 2009. This left the benchmark index valued at about 19 times the profits of its companies as of the end of last week, which is the highest, or, as value investors would say, "most expensive" level since June 2004. The +50% rally in Europe’s Dow Jones Stoxx 600 Index over the same period drove the average price-earnings ratio for its companies to the highest level since 2003. Looking forward, September has been historically noted as the "worst month" for US stocks, which leads many to believe that a market top of some sort will occur. However, the market has amazing knack for proving the crowd wrong. Data collected from Bloomberg.com says historically, the benchmark index has shed -1.3% during September since 1928. Instead of trying to predict, sit back and watch your stocks. If the market starts to roll over, leading stocks will very likely begin to trigger technical sell signals. That is because 3 out of 4 stocks typical follow the broader market averages' direction. Studying price and volume is the best way to interpret market action, not listening to opinions. PICTURED: The S&P 500 Index and all major averages negatively reversed and suffered another distribution day as volume exceeded Monday's levels. This ominous action puts the current rally under serious pressure and reiterates the importance of remaining in cash until a new batch of healthy leadership emerges.
|
|
|
 |
Financial Shares Led Widespread Group Losses
Kenneth J. Gruneisen - Passed the CAN SLIM® Master's Exam
Financial shares led the major averages lower as the Bank Index ($BKX -5.78%) and Broker/Dealer Index ($XBD -5.36%) tumbled on fear of more bank failures. The tech sector was also weak as the Networking Index ($NWX -2.91%), Biotechnology Index ($BTK -2.57%), Semiconductor Index ($SOX -2.46%), and Internet Index ($IIX -2.26%) ended unanimously lower. The Retail Index ($RLX -1.82%) slumped, and generally defensive areas offered no safe haven for investors as the Healthcare Index ($HMO -2.00%), Integrated Oil Index ($XOI -1.89%), Oil Services Index ($OSX -1.45%), and Gold & Silver Index ($XAU -1.71%) rounded out Tuesday's widely negative session.
Charts courtesy www.stockcharts.com
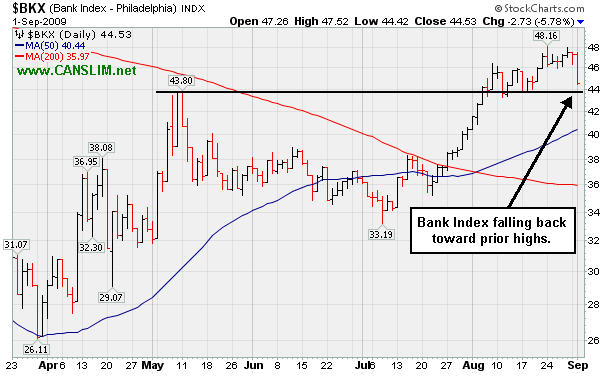
PICTURED 1: The Bank Index ($BKX -5.78%) fell hard, diving toward prior chart highs.
Charts courtesy www.stockcharts.com
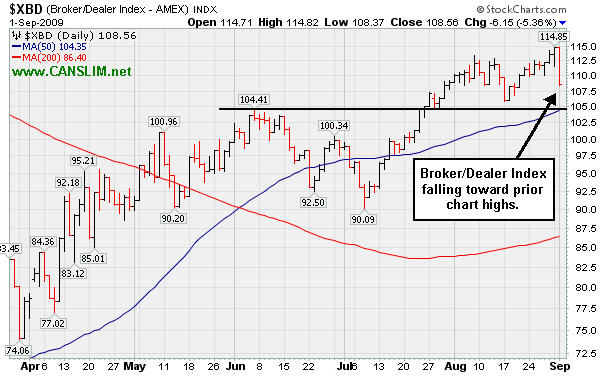
PICTURED 2: The Broker/Dealer Index ($XBD -5.36%) also fell sharply, diving toward prior chart highs.
| Oil Services |
$OSX |
170.82 |
-2.52 |
-1.45% |
+40.72% |
| Healthcare |
$HMO |
1,164.22 |
-23.75 |
-2.00% |
+21.25% |
| Integrated Oil |
$XOI |
960.42 |
-18.46 |
-1.89% |
-1.97% |
| Semiconductor |
$SOX |
298.64 |
-7.54 |
-2.46% |
+40.76% |
| Networking |
$NWX |
205.83 |
-6.18 |
-2.91% |
+43.05% |
| Internet |
$IIX |
198.10 |
-4.58 |
-2.26% |
+48.09% |
| Broker/Dealer |
$XBD |
108.56 |
-6.15 |
-5.36% |
+40.13% |
| Retail |
$RLX |
357.93 |
-6.62 |
-1.82% |
+28.17% |
| Gold & Silver |
$XAU |
144.52 |
-2.52 |
-1.71% |
+16.69% |
| Bank |
$BKX |
44.53 |
-2.73 |
-5.78% |
+0.47% |
| Biotech |
$BTK |
901.77 |
-23.75 |
-2.57% |
+39.34% |
|
|
|
 |
Critical Chart Support Levels Tested Again While Market Weakens
Kenneth J. Gruneisen - Passed the CAN SLIM® Master's Exam
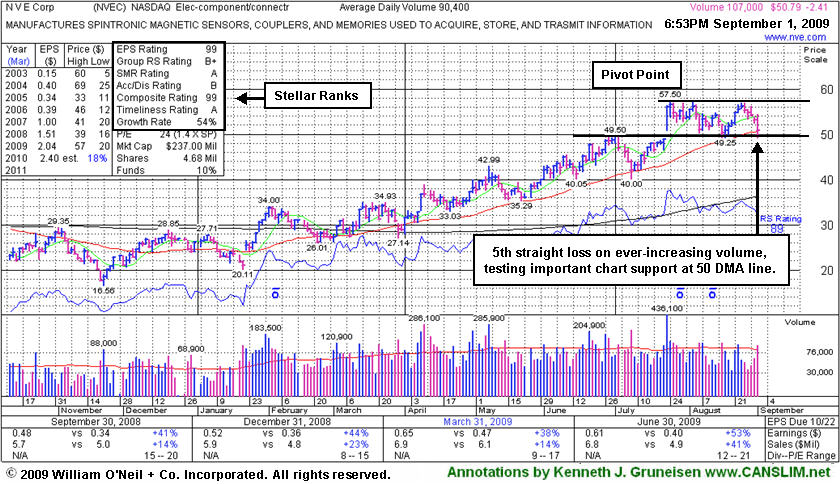
NVE Corp's (NVEC -$2.41 or -4.53% to $50.79) loss today on higher volume was its 5th consecutive decline. It is again trading near important support at its 50-day moving average (DMA) line and prior chart highs. Its color code was changed to green this week based on its weak action and failure to produce gains above its latest pivot point. In fact, today's intra-day low briefly undercut its 8/18/09 low which coincides with its last appearance in this FSU section under the headline, "Consolidation Near Important Support Levels" (read here). Throughout its ongoing advance, NVEC has found support near its 50 DMA line. Caution is warranted now, as eventually a more substantial correction is bound to come, and broader market conditions (the M criteria) appear to be weakening.
NVEC traded up as much as +69.87% since it was first featured in yellow at $33.85 in the Friday, March 13, 2009 Mid-Day Breakouts Report (read here). This high-ranked Electronics - Components leader has a good quarterly and annual earnings growth history (C & A criteria). However, it has failed to make additional progress since it was featured in the 7/23/09 Mid-Day BreakOuts Report (read here) after it gapped up for a considerable gain on heavy volume following news of stronger sales revenues (+41%) and solid earnings increases for the quarter ended June 30, 2009. The technical action was described as a "breakaway gap" from a valid ascending base. It has a very small supply of only 4.68 million shares outstanding. This is another good reason to be especially disciplined about proper entries and exits. A small supply is generally considered a good sign with respect to the S criteria, yet could contribute to great volatility in the event of institutional accumulation or distribution.
|
|
|
Color Codes Explained :
Y - Better candidates highlighted by our
staff of experts.
G - Previously featured
in past reports as yellow but may no longer be buyable under the
guidelines.
***Last / Change / Volume quote data in this table corresponds with the timestamp on the note***
Symbol/Exchange
Company Name
Industry Group |
Last |
Chg. |
Vol
% DAV |
Date Featured |
Price Featured |
Latest Pivot Point
Featured |
Status |
| Latest Max Buy Price |
ARO
- NYSE
Aeropostale Inc
RETAIL - Apparel Stores
|
$38.28
|
-0.87
|
3,137,289
103% DAV
3,034,000
|
8/21/2009
(Date
Featured) |
$39.21
(Price
Featured) |
PP = $38.84 |
Y |
| MB = $40.78 |
Most Recent Note - 9/1/2009 5:51:19 PM
Y - High-ranked leader in the Retail - Clothing/shoe group sank below its pivot point today with a 3rd consecutive loss on average volume, closing near support at prior highs in the $38 area. A gap up gain for a new all-time high on 8/21/09 helped trigger a technical buy signal as it rose from a flat base pattern with almost 3 times average volume. It was featured in yellow with new pivot point and max buy levels noted in the 8/21/09 Mid-Day BreakOuts Report (read here). It has a good annual earnings history (the A criteria), and the 2 latest quarterly comparisons showed +81% and +84% earnings increases, well above the investment system's +25% guideline.
>>> The latest Featured Stock Update with an annotated graph appeared on 8/21/2009. click here.
|
|
C
A
S
I |
News |
Chart |
SEC
View all notes Alert
me of new notes
Company
Profile
|
ARST
-
|
$19.97
|
+0.62
|
1,387,896
189% DAV
733,100
|
9/1/2009
(Date
Featured) |
$19.91
(Price
Featured) |
PP = $20.90 |
Y |
| MB = $21.95 |
Most Recent Note - 9/1/2009 5:56:12 PM
Y - Closed near the middle of its intra-day range with today's gain backed by nearly twice average volume helping it challenge prior chart highs. It met today's mid-day report screening parameters and it was also featured in the new September 2009 CANSLIM.net News (read here).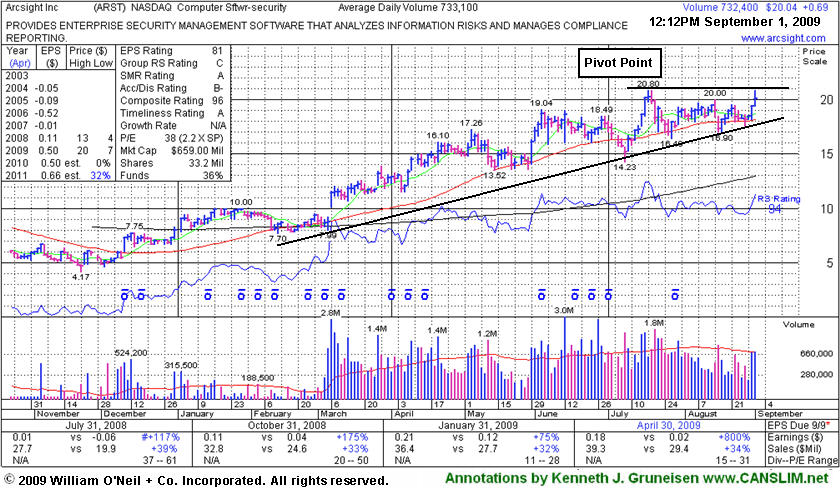
>>> The latest Featured Stock Update with an annotated graph appeared on 8/31/2009. click here.
|
|
C
A
S
I |
News |
Chart |
SEC
View all notes Alert
me of new notes
Company
Profile
|
CPLA
- NASDAQ
Capella Education Co
DIVERSIFIED SERVICES - Education and Training Services
|
$62.43
|
-0.92
|
101,514
55% DAV
186,000
|
7/9/2009
(Date
Featured) |
$59.69
(Price
Featured) |
PP = $62.06 |
Y |
| MB = $65.16 |
Most Recent Note - 9/1/2009 6:01:02 PM
Y - Still quietly consolidating in a tight range on light volume near its pivot point about 5% from its 52-week high. The Commercial Services-Schools Group has shown some isolated leadership which is somewhat reassuring for the L criteria, but the groups still has low ranks and CPLA's Relative Strength rank has slumped to 54, under the 80+ guideline. Its small supply of only 13.9 million shares in the float could contribute to greater price volatility in the event of institutional accumulation or distribution. The number of top-rated funds owning an interest rose from 91 in Sept '08, to 137 as of June '09, which is reassuring with respect to the I criteria. It has a very good earnings history that satisfies the C & A criteria.
>>> The latest Featured Stock Update with an annotated graph appeared on 8/19/2009. click here.
|
|
C
A
S
I |
News |
Chart |
SEC
View all notes Alert
me of new notes
Company
Profile
|
CRM
- NYSE
Salesforce.com Inc
INTERNET - Internet Software & Services
|
$51.14
|
-0.73
|
2,443,192
126% DAV
1,933,400
|
8/16/2009
(Date
Featured) |
$47.12
(Price
Featured) |
PP = $45.59 |
Y |
| MB = $47.87 |
Most Recent Note - 9/1/2009 6:03:05 PM
Y - Today's 4th consecutive loss on slightly higher volume continues its tight consolidation since its "breakaway gap" for a considerable gain on 8/21/09 with more than 5 times average volume. A Stock Bulletin was published with detailed analysis and an annotated graph on 8/16/09 (read here).
>>> The latest Featured Stock Update with an annotated graph appeared on 8/31/2009. click here.
|
|
C
A
S
I |
News |
Chart |
SEC
View all notes Alert
me of new notes
Company
Profile
|
EBIX
- NASDAQ
Ebix Inc
COMPUTER SOFTWARE & SERVICES - Business Software & Services
|
$50.12
|
+0.76
|
307,576
347% DAV
88,600
|
8/28/2009
(Date
Featured) |
$45.86
(Price
Featured) |
PP = $45.35 |
G |
| MB = $47.62 |
Most Recent Note - 9/1/2009 6:04:43 PM
G - Traded up today for an 8th consecutive gain backed by the highest volume behind any gain since May 4th. Quickly got extended after it triggered a technical buy signal as it blasted to a new all-time high on 8/28/09, rising from a big cup-with-high-handle shaped pattern. It has rebounded impressively and was re-featured in yellow at $45.86 with new pivot point and max buy levels noted in the 8/28/09 Mid-Day BreakOuts Report (read here). Sales and earnings increases in quarterly comparisons have been strong, but they have shown steady sequential deceleration. This high-ranked leader had traded up more than +59% after it was first featured in the March 2008 CANSLIM.net News (read here), but weak action later in the year subsequently prompted it to be dropped from the Featured Stocks list. Do not be confused by the 3:1 split that took effect on 10/09/08.
>>> The latest Featured Stock Update with an annotated graph appeared on 8/28/2009. click here.
|
|
C
A
S
I |
News |
Chart |
SEC
View all notes Alert
me of new notes
Company
Profile
|
GMCR
- NASDAQ
Green Mtn Coffee Roastrs
FOOD & BEVERAGE - Processed & Packaged Goods
|
$57.84
|
-2.35
|
1,349,838
82% DAV
1,654,400
|
7/17/2009
(Date
Featured) |
$60.15
(Price
Featured) |
PP = $63.79 |
G |
| MB = $66.98 |
Most Recent Note - 9/1/2009 6:07:48 PM
G - Today it sank further under its 50 DMA line which is now downward sloping and a source of technical resistance, with the next support at prior chart lows in the $54-53 area. As previously noted, "its gap down and considerable loss on 8/17/09 on heavy volume triggered technical sell signals." GMCR traded up more than +168% since appearing with an annotated graph under the headline "It May Soon Be Time To Go Green" when featured in the January 2009 CANSLIM.net News (read here).
>>> The latest Featured Stock Update with an annotated graph appeared on 8/26/2009. click here.
|
|
C
A
S
I |
News |
Chart |
SEC
View all notes Alert
me of new notes
Company
Profile
|
LFT
-
|
$24.17
|
-0.53
|
713,861
92% DAV
777,300
|
8/10/2009
(Date
Featured) |
$31.49
(Price
Featured) |
PP = $30.57 |
G |
| MB = $32.10 |
Most Recent Note - 9/1/2009 6:09:26 PM
G - Third consecutive loss today on average volume. On 8/31/09 it was noted when "violating a multi-month upward trendline connecting February, July, and August chart lows, raising more serious concerns and triggering additional technical sell signals." Volume behind recent gains has been very light since previously noted "substantial losses on heavy volume indicative of distributional pressure." It would need to rally back above its 50 DMA and recent chart highs for its outlook to improve.
>>> The latest Featured Stock Update with an annotated graph appeared on 8/25/2009. click here.
|
|
C
A
S
I |
News |
Chart |
SEC
View all notes Alert
me of new notes
Company
Profile
|
NTES
- NASDAQ
Netease Inc Adr
INTERNET - Internet Information Providers
|
$41.40
|
-0.59
|
1,371,485
61% DAV
2,250,600
|
7/17/2009
(Date
Featured) |
$39.29
(Price
Featured) |
PP = $38.74 |
G |
| MB = $40.68 |
Most Recent Note - 9/1/2009 6:12:36 PM
G - Still quietly consolidating in a tight range above support at its 50 DMA line and above prior chart highs in the $38 area. Deterioration below those levels would raise more serious concerns and triggger additional sell signals. As previously noted, "a 8/13/09 gap down for a considerable loss on nearly 4 times average volume triggered a technical sell signal."
>>> The latest Featured Stock Update with an annotated graph appeared on 8/27/2009. click here.
|
|
C
A
S
I |
News |
Chart |
SEC
View all notes Alert
me of new notes
Company
Profile
|
NVEC
- NASDAQ
N V E Corp
ELECTRONICS - Semiconductor - Specialized
|
$50.79
|
-2.41
|
108,528
120% DAV
90,400
|
8/26/2009
(Date
Featured) |
$55.32
(Price
Featured) |
PP = $57.60 |
G |
| MB = $60.48 |
Most Recent Note - 9/1/2009 6:18:55 PM
G - Loss today on higher volume, its 5th consecutive decline, has it trading near important support at its 50 DMA line and prior chart highs. Color code was changed to green based on its weak action and failure to produce gains above its latest pivot point. Quarterly sales revenues in the 6 million dollar range are still rather minuscule, leaving concerns.
>>> The latest Featured Stock Update with an annotated graph appeared on 9/1/2009. click here.
|
|
C
A
S
I |
News |
Chart |
SEC
View all notes Alert
me of new notes
Company
Profile
|
PEGA
- NASDAQ
Pegasystems Inc
COMPUTER SOFTWARE & SERVICES - Business Software & Services
|
$29.67
|
-0.96
|
434,977
119% DAV
364,700
|
7/29/2009
(Date
Featured) |
$27.53
(Price
Featured) |
PP = $27.49 |
G |
| MB = $28.86 |
Most Recent Note - 9/1/2009 6:20:36 PM
G - Down again today, falling for a 5th consecutive session on near average volume after an impressive 6 session winning streak. Recently found support at its 50 DMA line.
>>> The latest Featured Stock Update with an annotated graph appeared on 8/24/2009. click here.
|
|
C
A
S
I |
News |
Chart |
SEC
View all notes Alert
me of new notes
Company
Profile
|
|
|
|
THESE ARE NOT BUY RECOMMENDATIONS!
Comments contained in the body of this report are technical
opinions only. The material herein has been obtained
from sources believed to be reliable and accurate, however,
its accuracy and completeness cannot be guaranteed.
This site is not an investment advisor, hence it does
not endorse or recommend any securities or other investments.
Any recommendation contained in this report may not
be suitable for all investors and it is not to be deemed
an offer or solicitation on our part with respect to
the purchase or sale of any securities. All trademarks,
service marks and trade names appearing in this report
are the property of their respective owners, and are
likewise used for identification purposes only.
This report is a service available
only to active Paid Premium Members.
You may opt-out of receiving report notifications
at any time. Questions or comments may be submitted
by writing to Premium Membership Services 665 S.E. 10 Street, Suite 201 Deerfield Beach, FL 33441-5634 or by calling 1-800-965-8307
or 954-785-1121.
|
|
|


