***Last / Change / Volume data in this table is the closing quote data***
Symbol/Exchange
Company Name
Industry Group |
PRICE |
CHANGE
(%Change) |
Day High |
Volume
(% DAV)
(% 50 day avg vol) |
52 Wk Hi
% From Hi |
Featured
Date |
Price
Featured |
Pivot Featured |
|
Max Buy |
ALXN
-
NASDAQ
Alexion Pharmaceuticals
DRUGS - Drug Manufacturers - Other
|
$107.21
|
+1.61
1.52% |
$107.49
|
1,034,858
78.85% of 50 DAV
50 DAV is 1,312,400
|
$109.96
-2.50%
|
8/23/2012
|
$103.70
|
PP = $110.06
|
|
MB = $115.56
|
Most Recent Note - 8/28/2012 4:29:06 PM
Y - Posted a 3rd consecutive gain today and it is perched within close striking distance of its 52-week high. Subsequent volume-driven gains above its pivot point may trigger a new (or add-on) technical buy signal.
>>> The latest Featured Stock Update with an annotated graph appeared on 8/23/2012. Click here.
View all notes |
Alert me of new notes |
CANSLIM.net Company Profile |
SEC |
Zacks Reports |
StockTalk |
News |
Chart |
Request a new note
C
A N
S L
I M


|
ASPS
-
NASDAQ
Altisource Ptf Sltns Sa
REAL ESTATE - Property Management/Developmen
|
$84.29
|
+0.70
0.84% |
$84.87
|
52,411
40.22% of 50 DAV
50 DAV is 130,300
|
$92.29
-8.67%
|
6/5/2012
|
$60.01
|
PP = $63.00
|
|
MB = $66.15
|
Most Recent Note - 8/30/2012 3:58:06 PM
G - Down today on below average volume, retreating -9.3% from its all-time high. It has been repeatedly noted - "Extended from its prior base, and its 50 DMA line defines near-term support to watch."
>>> The latest Featured Stock Update with an annotated graph appeared on 8/3/2012. Click here.
View all notes |
Alert me of new notes |
CANSLIM.net Company Profile |
SEC |
Zacks Reports |
StockTalk |
News |
Chart |
Request a new note
C
A N
S L
I M
|
CFNL
-
NASDAQ
Cardinal Financial Corp
BANKING - Regional - Southeast Banks
|
$12.95
|
-0.01
-0.08% |
$13.05
|
41,225
64.51% of 50 DAV
50 DAV is 63,900
|
$13.30
-2.63%
|
8/17/2012
|
$12.84
|
PP = $13.31
|
|
MB = $13.98
|
Most Recent Note - 8/29/2012 6:03:06 PM
Y - Finished near the session high today for a best-ever close with a gain on below average volume. Disciplined investors know to watch for signs of fresh institutional buying demand as a reassurance. Previously noted - "Volume-driven gains above its pivot point may trigger a new (or add-on) technical buy signal, meanwhile its 50 DMA line defines important support."
>>> The latest Featured Stock Update with an annotated graph appeared on 8/21/2012. Click here.
View all notes |
Alert me of new notes |
CANSLIM.net Company Profile |
SEC |
Zacks Reports |
StockTalk |
News |
Chart |
Request a new note
C
A N
S L
I M
|
CMCSA
-
NASDAQ
Comcast Corp Cl A
MEDIA - CATV Systems
|
$33.53
|
-0.10
-0.30% |
$33.90
|
12,122,641
95.46% of 50 DAV
50 DAV is 12,699,000
|
$35.16
-4.64%
|
6/11/2012
|
$29.94
|
PP = $30.98
|
|
MB = $32.53
|
Most Recent Note - 8/28/2012 4:17:57 PM
G - Consolidating in a very tight trading range for the past few weeks. Fundamental concerns were raised as it recently reported earnings +19% on +6% sales revenues for the Jun '12 quarter, below the fact-based investment system's +25% minimum guideline for the C criteria.
>>> The latest Featured Stock Update with an annotated graph appeared on 8/15/2012. Click here.
View all notes |
Alert me of new notes |
CANSLIM.net Company Profile |
SEC |
Zacks Reports |
StockTalk |
News |
Chart |
Request a new note
C
A N
S L
I M
|
ECPG
-
NASDAQ
Encore Capital Group Inc
FINANCIAL SERVICES - Credit Services
|
$28.03
|
+0.16
0.57% |
$28.10
|
45,470
32.07% of 50 DAV
50 DAV is 141,800
|
$30.47
-8.01%
|
8/3/2012
|
$29.91
|
PP = $30.45
|
|
MB = $31.97
|
Most Recent Note - 8/27/2012 3:29:37 PM
G - Color code is changed to green while sputtering below its 50 DMA line and -8% off its 52-week high today. Completed a Secondary Offering on 8/08/12. Gains above its 50 DMA line are needed for its outlook to improve.
>>> The latest Featured Stock Update with an annotated graph appeared on 8/6/2012. Click here.
View all notes |
Alert me of new notes |
CANSLIM.net Company Profile |
SEC |
Zacks Reports |
StockTalk |
News |
Chart |
Request a new note
C
A N
S L
I M
|
Symbol/Exchange
Company Name
Industry Group |
PRICE |
CHANGE
(%Change) |
Day High |
Volume
(% DAV)
(% 50 day avg vol) |
52 Wk Hi
% From Hi |
Featured
Date |
Price
Featured |
Pivot Featured |
|
Max Buy |
EXPE
-
NASDAQ
Expedia Inc
INTERNET - Internet Information Providers
|
$51.36
|
-0.12
-0.23% |
$52.11
|
2,960,749
86.76% of 50 DAV
50 DAV is 3,412,400
|
$59.50
-13.68%
|
4/27/2012
|
$41.80
|
PP = $35.57
|
|
MB = $37.35
|
Most Recent Note - 8/30/2012 3:59:47 PM
G - Volume totals have been cooling while consolidating above prior highs and its 50 DMA line defining important near-term chart support in the $50 area.
>>> The latest Featured Stock Update with an annotated graph appeared on 8/14/2012. Click here.
View all notes |
Alert me of new notes |
CANSLIM.net Company Profile |
SEC |
Zacks Reports |
StockTalk |
News |
Chart |
Request a new note
C
A N
S L
I M
|
GPX
-
NYSE
G P Strategies Corp
DIVERSIFIED SERVICES - Education and Training Services
|
$20.05
|
+0.05
0.25% |
$20.26
|
28,779
36.85% of 50 DAV
50 DAV is 78,100
|
$20.67
-3.00%
|
6/29/2012
|
$18.01
|
PP = $18.15
|
|
MB = $19.06
|
Most Recent Note - 8/27/2012 12:20:04 PM
G - Still perched near its 52-week high today, slightly extended from its prior base. Churned above average volume recently without making much meaningful price progress, a sign of distributional pressure. Prior highs and its 50 DMA line define chart support in the $18 area.
>>> The latest Featured Stock Update with an annotated graph appeared on 8/7/2012. Click here.
View all notes |
Alert me of new notes |
CANSLIM.net Company Profile |
SEC |
Zacks Reports |
StockTalk |
News |
Chart |
Request a new note
C
A N
S L
I M
|
HMSY
-
NASDAQ
H M S Holdings Corp
COMPUTER SOFTWARE and SERVICES - Healthcare Information Service
|
$34.46
|
-0.43
-1.23% |
$35.12
|
576,280
62.68% of 50 DAV
50 DAV is 919,400
|
$37.19
-7.34%
|
7/27/2012
|
$33.91
|
PP = $34.83
|
|
MB = $36.57
|
Most Recent Note - 8/29/2012 5:58:53 PM
Y - Volume totals have been light behind 3 consecutive gains since it halted its slide after dipping below its 50 DMA line as distributional action raised concerns. Color code is changed to yellow but no new pivot point is cited. Volume-driven gains into new high territory would be a reassuring sign disciplined investors may wait for as an indication of fresh institutional accumulation.
>>> The latest Featured Stock Update with an annotated graph appeared on 8/22/2012. Click here.
View all notes |
Alert me of new notes |
CANSLIM.net Company Profile |
SEC |
Zacks Reports |
StockTalk |
News |
Chart |
Request a new note
C
A N
S L
I M
|
KH
-
NYSE
China Kanghui Hldgs Ads
HEALTH SERVICES - Medical Appliances and Equipment
|
$24.99
|
+0.50
2.04% |
$25.04
|
18,630
84.30% of 50 DAV
50 DAV is 22,100
|
$24.80
0.77%
|
8/30/2012
|
$24.19
|
PP = $22.90
|
|
MB = $24.05
|
Most Recent Note - 8/30/2012 5:27:12 PM
Y - Finished near the session high today with a small loss. It was highlighted in yellow with pivot point cited based on its 8/16/12 high plus 10 cents in the earlier mid-day report while noted - "This Chinese Medical - Products firm is pulling back today following a gain with more than 3 times average volume on the prior session which technically helped it break out of an orderly flat base above its 50 DMA line. Prior highs in the $25-26 area were a stubborn resistance area, however overhead supply is not a great concern. Its small supply (S criteria) of only 22.8 million outstanding shares and low daily average volume can contribute to greater volatility in the event of institutional buying or selling so proper discipline is especially important. Reported earnings +41% on +26% sales revenues for the quarter ended June 30, 2012 versus the year ago period. The Dec '11 and Mar '12 quarters showed strong sales revenues and earnings increases, improving following a streak of 3 sub par quarterly comparisons." See the latest FSU analysis for more details and a new annotated graph.
>>> The latest Featured Stock Update with an annotated graph appeared on 8/30/2012. Click here.
View all notes |
Alert me of new notes |
CANSLIM.net Company Profile |
SEC |
Zacks Reports |
StockTalk |
News |
Chart |
Request a new note
C
A N
S L
I M
|
LKQ
-
NASDAQ
L K Q Corp
WHOLESALE - Auto Parts
|
$37.74
|
-0.07
-0.19% |
$38.44
|
561,058
75.98% of 50 DAV
50 DAV is 738,400
|
$39.20
-3.72%
|
8/9/2012
|
$37.93
|
PP = $37.44
|
|
MB = $39.31
|
Most Recent Note - 8/30/2012 3:22:25 PM
Y - Down today with light volume, slumping back near its pivot point. Prior highs in the $37 area define initial support to watch above its 50 DMA line.
>>> The latest Featured Stock Update with an annotated graph appeared on 8/10/2012. Click here.
View all notes |
Alert me of new notes |
CANSLIM.net Company Profile |
SEC |
Zacks Reports |
StockTalk |
News |
Chart |
Request a new note
C
A N
S L
I M
|
Symbol/Exchange
Company Name
Industry Group |
PRICE |
CHANGE
(%Change) |
Day High |
Volume
(% DAV)
(% 50 day avg vol) |
52 Wk Hi
% From Hi |
Featured
Date |
Price
Featured |
Pivot Featured |
|
Max Buy |
MIDD
-
NASDAQ
Middleby Corp
MANUFACTURING - Diversified Machinery
|
$115.15
|
+2.00
1.77% |
$115.49
|
146,138
148.21% of 50 DAV
50 DAV is 98,600
|
$119.74
-3.83%
|
8/9/2012
|
$118.60
|
PP = $104.92
|
|
MB = $110.17
|
Most Recent Note - 8/28/2012 12:30:08 PM
G - Still quietly consolidating -5.6% off its 52-week high today, extended from its prior base. Its 50 DMA line and prior highs in the $104 area define important chart support to watch.
>>> The latest Featured Stock Update with an annotated graph appeared on 8/13/2012. Click here.
View all notes |
Alert me of new notes |
CANSLIM.net Company Profile |
SEC |
Zacks Reports |
StockTalk |
News |
Chart |
Request a new note
C
A N
S L
I M
|
N
-
NYSE
Netsuite Inc
DIVERSIFIED SERVICES - Business/Management Services
|
$56.88
|
+1.51
2.73% |
$57.06
|
342,872
48.20% of 50 DAV
50 DAV is 711,300
|
$59.22
-3.95%
|
8/20/2012
|
$55.88
|
PP = $59.32
|
|
MB = $62.29
|
 Most Recent Note - 8/31/2012 5:20:11 PM
Y - Posted a solid gain on light volume today. Volume totals have been cooling while consolidating in a tight range near its 52-week high. A volume-driven gain above its pivot point may trigger a new (or add-on) technical buy signal. Meanwhile, its 50 DMA line defines important near-term support.
>>> The latest Featured Stock Update with an annotated graph appeared on 8/20/2012. Click here.
View all notes |
Alert me of new notes |
CANSLIM.net Company Profile |
SEC |
Zacks Reports |
StockTalk |
News |
Chart |
Request a new note
C
A N
S L
I M
|
NSM
-
NYSE
Nationstar Mtg Hldgs Inc
FINANCIAL SERVICES - Credit Services
|
$27.12
|
-0.24
-0.88% |
$27.63
|
617,085
77.44% of 50 DAV
50 DAV is 796,900
|
$28.75
-5.67%
|
8/29/2012
|
$27.96
|
PP = $28.85
|
|
MB = $30.29
|
Most Recent Note - 8/29/2012 12:41:18 PM
Y - Trading up and nearly challenging its 52-week high with today's 3rd consecutive gain backed by above average volume. Color code is changed to yellow with new pivot point cited based on its 8/17/12 high plus 10 cent while working on an advanced "ascending base" pattern. Managed an impressive a "positive reversal" on 8/27/12 while finding support near prior highs in the $25 area. Subsequent volume-driven gains above the pivot point may trigger a new (or add-on) technical buy signal.
>>> The latest Featured Stock Update with an annotated graph appeared on 8/1/2012. Click here.
View all notes |
Alert me of new notes |
CANSLIM.net Company Profile |
SEC |
Zacks Reports |
StockTalk |
News |
Chart |
Request a new note
C
A N
S L
I M
|
OSIS
-
NASDAQ
O S I Systems Inc
ELECTRONICS - Semiconductor Equipment and Mate
|
$74.10
|
+0.86
1.17% |
$74.26
|
137,309
123.26% of 50 DAV
50 DAV is 111,400
|
$75.00
-1.20%
|
8/9/2012
|
$67.71
|
PP = $67.48
|
|
MB = $70.85
|
Most Recent Note - 8/30/2012 12:42:15 PM
G - Still hovering near its 52-week high in a very tight trading range. Ending the week near its current level could form an advanced "3-weeks tight" base pattern. Prior highs in the $67-68 area define initial support to watch on pullbacks.
>>> The latest Featured Stock Update with an annotated graph appeared on 8/9/2012. Click here.
View all notes |
Alert me of new notes |
CANSLIM.net Company Profile |
SEC |
Zacks Reports |
StockTalk |
News |
Chart |
Request a new note
C
A N
S L
I M
|
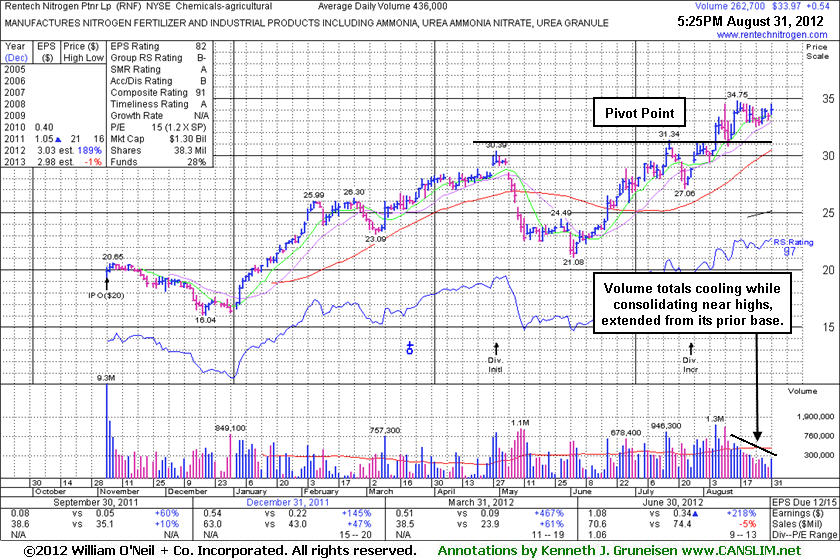
RNF
-
NYSE
Rentech Nitrogen Ptnr Lp
CHEMICALS - Agricultural Chemicals
|
$33.97
|
+0.54
1.62% |
$34.50
|
262,748
60.26% of 50 DAV
50 DAV is 436,000
|
$34.75
-2.24%
|
7/27/2012
|
$29.58
|
PP = $30.60
|
|
MB = $32.13
|
Most Recent Note - 8/31/2012 5:38:39 PM
G - Holding its ground perched near its high with volume totals cooling in recent weeks. It is extended from its prior base with near-term support at prior highs in the $30-31 area and its 50 DMA line. See the latest FSU analysis for more details and a new annotated graph.
>>> The latest Featured Stock Update with an annotated graph appeared on 8/31/2012. Click here.
View all notes |
Alert me of new notes |
CANSLIM.net Company Profile |
SEC |
Zacks Reports |
StockTalk |
News |
Chart |
Request a new note
C
A N
S L
I M
|
Symbol/Exchange
Company Name
Industry Group |
PRICE |
CHANGE
(%Change) |
Day High |
Volume
(% DAV)
(% 50 day avg vol) |
52 Wk Hi
% From Hi |
Featured
Date |
Price
Featured |
Pivot Featured |
|
Max Buy |
SWI
-
NYSE
Solarwinds Inc
COMPUTER SOFTWARE and SERVICES - Application Software
|
$54.88
|
+0.43
0.79% |
$55.25
|
483,769
39.54% of 50 DAV
50 DAV is 1,223,600
|
$56.94
-3.62%
|
7/25/2012
|
$47.82
|
PP = $47.89
|
|
MB = $50.28
|
Most Recent Note - 8/29/2012 6:51:18 PM
G - Volume totals have been cooling in recent weeks while still holding its ground stubbornly near its all-time high. Its 50 DMA line and prior highs coincide in the $48 area defining important chart support to watch on pullbacks. See latest FSU analysis for more details and a new annotated graph.
>>> The latest Featured Stock Update with an annotated graph appeared on 8/29/2012. Click here.
View all notes |
Alert me of new notes |
CANSLIM.net Company Profile |
SEC |
Zacks Reports |
StockTalk |
News |
Chart |
Request a new note
C
A N
S L
I M
|
TDG
-
NYSE
Transdigm Group Inc
AEROSPACE/DEFENSE - Aerospace/Defense Products and; Services
|
$138.62
|
+0.44
0.32% |
$139.37
|
196,429
49.02% of 50 DAV
50 DAV is 400,700
|
$143.15
-3.16%
|
8/16/2012
|
$132.23
|
PP = $136.44
|
|
MB = $143.26
|
Most Recent Note - 8/27/2012 12:45:26 PM
Y - Hit a new 52-week high today and challenged its "max buy" level, however it is now trading well off its earlier highs. Disciplined investors do not chase extended stocks and they always limit losses if ever any stock falls -7% from their purchase price.
>>> The latest Featured Stock Update with an annotated graph appeared on 8/17/2012. Click here.
View all notes |
Alert me of new notes |
CANSLIM.net Company Profile |
SEC |
Zacks Reports |
StockTalk |
News |
Chart |
Request a new note
C
A N
S L
I M
|
ULTI
-
NASDAQ
Ultimate Software Group
INTERNET - Internet Software and Services
|
$99.19
|
+1.12
1.14% |
$99.60
|
159,566
99.73% of 50 DAV
50 DAV is 160,000
|
$100.83
-1.63%
|
8/27/2012
|
$98.36
|
PP = $99.19
|
|
MB = $104.15
|
Most Recent Note - 8/28/2012 1:01:23 PM
Y - Touched another new 52-week high today then reversed into the red. On the prior session it gapped up and posted a volume-driven gain, however it did not finish above the pivot point cited based on its 8/01/12 high plus 10 cents. A volume-driven gain and strong close above its pivot point may trigger technical buy signal. See the latest FSU analysis for more details and an annotated graph.
>>> The latest Featured Stock Update with an annotated graph appeared on 8/27/2012. Click here.
View all notes |
Alert me of new notes |
CANSLIM.net Company Profile |
SEC |
Zacks Reports |
StockTalk |
News |
Chart |
Request a new note
C
A N
S L
I M
|
VSI
-
NYSE
Vitamin Shoppe Inc
SPECIALTY RETAIL - Specialty Retail, Other
|
$53.61
|
-0.46
-0.85% |
$54.97
|
225,202
59.78% of 50 DAV
50 DAV is 376,700
|
$61.83
-13.29%
|
6/29/2012
|
$54.93
|
PP = $55.03
|
|
MB = $57.78
|
Most Recent Note - 8/28/2012 4:24:40 PM
G - The longer it lingers below its 50 DMA line the worse its outlook gets following recent technical sell signals. Prior low ($52.41 on 7/23/12) defines a near-term support level where any further deterioration would raise more serious concerns.
>>> The latest Featured Stock Update with an annotated graph appeared on 8/2/2012. Click here.
View all notes |
Alert me of new notes |
CANSLIM.net Company Profile |
SEC |
Zacks Reports |
StockTalk |
News |
Chart |
Request a new note
C
A N
S L
I M
|
WPI
-
NYSE
Watson Pharmaceuticals
DRUGS - Drugs - Generic
|
$81.35
|
-0.17
-0.21% |
$82.24
|
875,594
66.01% of 50 DAV
50 DAV is 1,326,500
|
$83.83
-2.96%
|
8/24/2012
|
$82.90
|
PP = $81.10
|
|
MB = $85.16
|
Most Recent Note - 8/28/2012 6:16:14 PM
Y - Holding its ground since triggering a technical buy signal on 8/24/12 when highlighted in the mid-day report with a gap up gain backed by above average volume. Prior highs in the $81 area define initial support to watch on pullbacks. See the latest FSU analysis for more details and a new annotated graph.
>>> The latest Featured Stock Update with an annotated graph appeared on 8/28/2012. Click here.
View all notes |
Alert me of new notes |
CANSLIM.net Company Profile |
SEC |
Zacks Reports |
StockTalk |
News |
Chart |
Request a new note
C
A N
S L
I M
|
Symbol/Exchange
Company Name
Industry Group |
PRICE |
CHANGE
(%Change) |
Day High |
Volume
(% DAV)
(% 50 day avg vol) |
52 Wk Hi
% From Hi |
Featured
Date |
Price
Featured |
Pivot Featured |
|
Max Buy |