You are not logged in.
This means you
CAN ONLY VIEW reports that were published prior to Monday, April 14, 2025.
You
MUST UPGRADE YOUR MEMBERSHIP if you want to see any current reports.
AFTER MARKET UPDATE - MONDAY, AUGUST 29TH, 2011
Previous After Market Report Next After Market Report >>>
|
|
|
|
DOW |
+254.71 |
11,539.25 |
+2.26% |
|
Volume |
912,198,450 |
-19% |
|
Volume |
1,589,309,610 |
-13% |
|
NASDAQ |
+82.26 |
2,562.11 |
+3.32% |
|
Advancers |
2,784 |
89% |
|
Advancers |
2,265 |
85% |
|
S&P 500 |
+33.28 |
1,210.08 |
+2.83% |
|
Decliners |
304 |
10% |
|
Decliners |
345 |
13% |
|
Russell 2000 |
+32.86 |
724.65 |
+4.75% |
|
52 Wk Highs |
30 |
|
|
52 Wk Highs |
26 |
|
|
S&P 600 |
+17.27 |
395.23 |
+4.57% |
|
52 Wk Lows |
9 |
|
|
52 Wk Lows |
30 |
|
|
 |
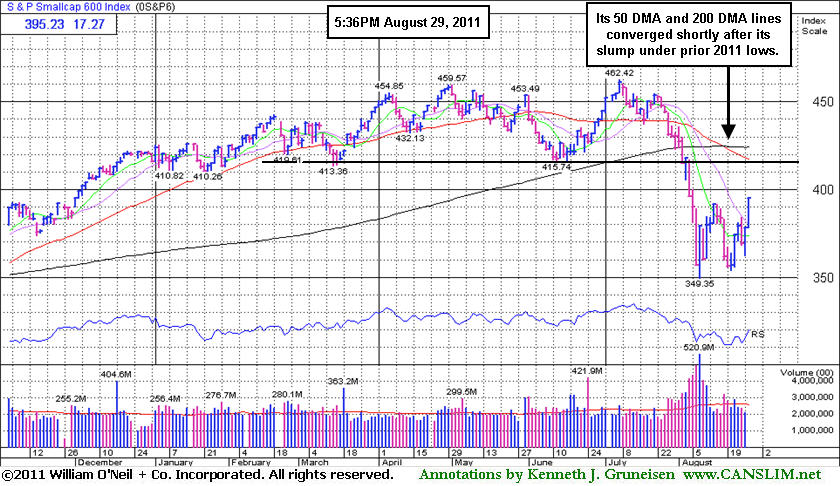
Volume Totals Cooled as Small Caps Outpaced Larger Peers
Kenneth J. Gruneisen - Passed the CAN SLIM® Master's Exam
The Dow Jones Industrial Average, S&P 500 Index, and Nasdaq Composite Index tallied unanimous gains on Monday and the indices again finished near their session highs. Lighter volume totals were reported on the NYSE and on the Nasdaq exchange, however, revealing a suspicious lack of conviction from the institutional crowd behind the otherwise solid rally. Breadth was very positive as advancing issues swamped decliners by 9-1 on the NYSE and by nearly 7-1 on the Nasdaq exchange. On the NYSE new 52-week highs outnumbered new 52-week lows while on the Nasdaq exchange new 52-week lows totals still outnumbered the new 52-week highs totals. There were 22 high-ranked companies from the CANSLIM.net Leaders List that made new 52-week highs and appeared on the CANSLIM.net BreakOuts Page, up from the prior session total of 8 stocks. Any sustainable rally requires a healthy crop of strong leaders hitting new 52-week highs, so further expansion in the new highs list would be a welcome and reassuring sign of heartier leadership. There were gains for all of the 6 high-ranked leaders currently included on the Featured Stocks Page.
Monday's Session brought sunshine after the storm as the new week dawned on Wall Street with a brighter view of the global economy. Insurance stocks led the surging financial group after damage caused by Hurricane Irene was less than predicted. The Allstate Corp (ALL +8.6%) and Travelers Companies Inc (TRV +5%) rallied. Bank of America Corp (BAC +8.1%), still benefiting from a Buffett transfusion, rose after it agreed to sell about half its stake in China Construction Bank for a $3.3 billion gain. Pfizer Inc (PFE +3.7%) , another Dow component, rose after a clinical trial delivered promising results for its experimental blood thinner pill.
Gains in European markets set the table for the Wall Street advance. The benchmark index in Greece soared 14%, the most in one day since 1990, following a merger of the country's two biggest banks.
A report on U.S. consumer spending was an encouragement. The Commerce Department said spending gained 0.8%, the biggest gain since February. July personal income rose 0.3%, in line with expectations. . Oil prices rose more than 2% and rose above $87 per barrel, boosting energy stocks, on optimism that the economy will keep expanding. New data on the housing market signaled no improvement. The number of contracts to purchase previously owned U.S. homes fell in July for the first time in three months, a sign that lower prices and borrowing costs are not luring buyers.
The market environment (M criteria) is currently in a confirmed uptrend. However, the new rally has endured a distribution day, and while leadership (stocks hitting new 52-week highs) improved, the quieter volume hints that buying demand from the institutional crowd may not be sufficient strength to allow the major averages to sustain a meaningful advance. The indices also remain well below their respective 200-day moving average (DMA) lines, and to be considered truly "healthy" they would need to rebound above their long-term averages.
The August 2011 issue of CANSLIM.net News is now available (click here). Links to all prior reports are available on the Premium Member Homepage.
PICTURED: The S&P 600 Small Cap Index (+4.57%) outperformed its larger peers on Monday with a big gain.
|
 Kenneth J. Gruneisen started out as a licensed stockbroker in August 1987, a couple of months prior to the historic stock market crash that took the Dow Jones Industrial Average down -22.6% in a single day. He has published daily fact-based fundamental and technical analysis on high-ranked stocks online for two decades. Through FACTBASEDINVESTING.COM, Kenneth provides educational articles, news, market commentary, and other information regarding proven investment systems that work in good times and bad.
Comments contained in the body of this report are technical opinions only and are not necessarily those of Gruneisen Growth Corp. The material herein has been obtained from sources believed to be reliable and accurate, however, its accuracy and completeness cannot be guaranteed. Our firm, employees, and customers may effect transactions, including transactions contrary to any recommendation herein, or have positions in the securities mentioned herein or options with respect thereto. Any recommendation contained in this report may not be suitable for all investors and it is not to be deemed an offer or solicitation on our part with respect to the purchase or sale of any securities. |
|
 |
Financial Stocks Underpinning Recent Rally
Kenneth J. Gruneisen - Passed the CAN SLIM® Master's Exam
Big gains from the Broker/Dealer Index ($XBD +4.31%) and Bank Index ($BKX +4.54%) underpinned Monday's big gains for the major averages. The Retail Index ($RLX +2.47%) also was among the positive influences. The Networking Index ($NWX +5.38%) led the tech sector higher while the Semiconductor Index ($SOX +3.66%), Internet Index ($IIX +3.65%), and Biotechnology Index ($BTK +3.32%) also posted solid gains. The Healthcare Index ($HMO +3.35%) rose, and energy-related gains boosted the Integrated Oil Index ($XOI +3.01%) and Oil Services Index ($OSX +4.03%). Meanwhile, the Gold & Silver Index ($XAU -0.29%) edged lower, making it a standout laggard.
Charts courtesy www.stockcharts.com
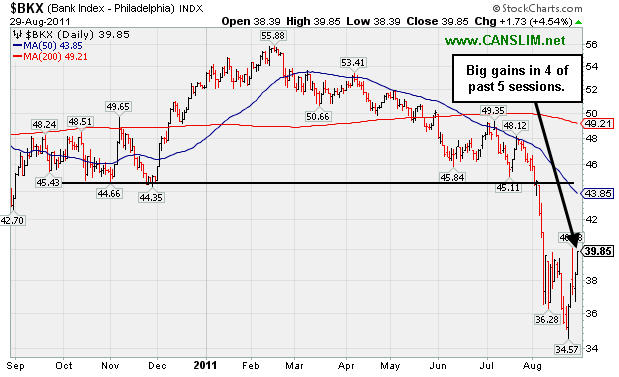
PICTURED: The Bank Index ($BKX +4.54%) posted big gains in 4 of the past 5 sessions while rebounding from a recent dip to lows not seen since July 2009. It is a reassuring sign that financial stocks have been among the positive influences during the latest rally.
|
|
|
 |
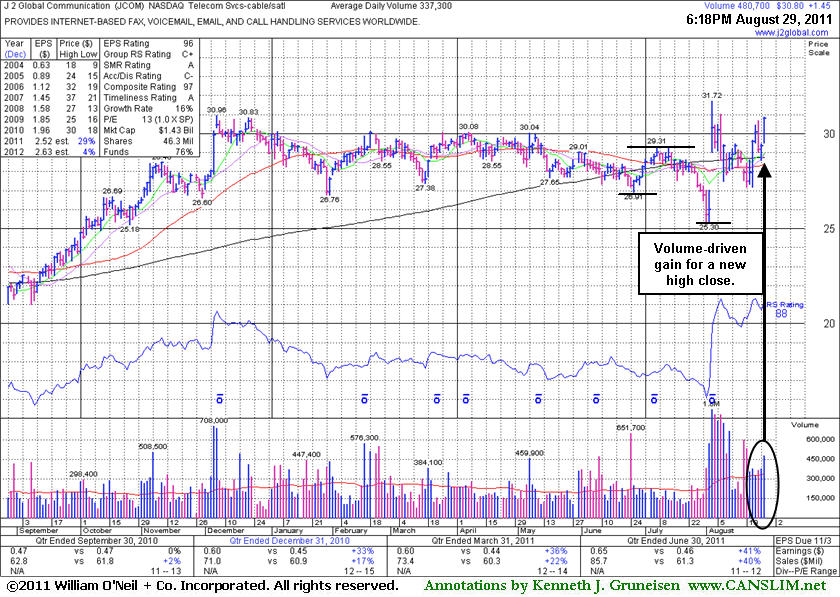
Confirming Gain on +43% Above Average Volume
Kenneth J. Gruneisen - Passed the CAN SLIM® Master's Exam
J 2 Global Communication (JCOM +$1.45 or +4.94% to $30.80) finished near the session high today for its best close of the year with a considerable gain with +43% above average volume. Little resistance remains due to overhead supply. Gains with slightly above average volume helped it rebound above its 50-day and 200-day moving average (DMA) lines, improving its outlook since its last appearance in this FSU section on 8/19/11 with an annotated graph under the headline, "Overhead Supply Acting as Source of Resistance". It has sputtered since its 8/03/11 gap up. The prompt rebound above those important moving averages helped its outlook.
Its color code was changed to yellow today after the solid gain which may be considered a confirming "buy signal" as it powered above the previously cited pivot point based on its 7/07/11 high ($29.31) following a "double bottom" type base. Although it had rallied to a new high and showed explosive potential, the subsequent slump was an indication that overhead supply was hindering its progress while the broader market (M criteria) also lacked upward momentum. The 3 latest quarterly comparisons through June '11 show sales revenues and earnings acceleration and the high-ranked Telecom Services - Cable/Satellite firm has a strong annual earnings history, satisfying the C and A criteria. One concern we have highlighted is the waning ownership by top-rated funds, falling from 421 in Mar '11 to 398 in June '11. Normally, increasing interest from top-rated funds is preferred with respect to the I criteria.
|
|
|
Color Codes Explained :
Y - Better candidates highlighted by our
staff of experts.
G - Previously featured
in past reports as yellow but may no longer be buyable under the
guidelines.
***Last / Change / Volume data in this table is the closing quote data***
Symbol/Exchange
Company Name
Industry Group |
PRICE |
CHANGE
(%Change) |
Day High |
Volume
(% DAV)
(% 50 day avg vol) |
52 Wk Hi
% From Hi |
Featured
Date |
Price
Featured |
Pivot Featured |
|
Max Buy |
EXLS
-
NASDAQ
Exlservice Holdings Inc
DIVERSIFIED SERVICES - Business/Management Services
|
$25.29
|
+0.59
2.39% |
$25.62
|
129,050
143.71% of 50 DAV
50 DAV is 89,800
|
$26.46
-4.42%
|
8/2/2011
|
$24.85
|
PP = $24.85
|
|
MB = $26.09
|
 Most Recent Note - 8/29/2011 6:37:04 PM
Y - Gapped up today and posted a confirming gain with +43% above average volume while rallying above the previously cited pivot point. Finished -4.4% off its 52-week high. Recent low ($23.01 on 8/19/11) and 50 DMA line define important support to watch above its 200 DMA line.
>>> The latest Featured Stock Update with an annotated graph appeared on 8/25/2011. Click here.
View all notes |
Alert me of new notes |
CANSLIM.net Company Profile |
SEC |
Zacks Reports |
StockTalk |
News |
Chart |
Request a new note
C
A N
S L
I M


|
FCFS
-
NASDAQ
First Cash Financial Svs
SPECIALTY RETAIL - Specialty Retail, Other
|
$45.30
|
+1.46
3.33% |
$45.43
|
228,040
71.26% of 50 DAV
50 DAV is 320,000
|
$47.80
-5.23%
|
5/31/2011
|
$42.00
|
PP = $40.23
|
|
MB = $42.24
|
Most Recent Note - 8/29/2011 6:38:14 PM
G - Closed near the session high today with a gain on lighter than average volume. Recently finding support near its 50 DMA line. Prior chart lows near $37-38 define support to watch.
>>> The latest Featured Stock Update with an annotated graph appeared on 8/22/2011. Click here.
View all notes |
Alert me of new notes |
CANSLIM.net Company Profile |
SEC |
Zacks Reports |
StockTalk |
News |
Chart |
Request a new note
C
A N
S L
I M
|
JCOM
-
NASDAQ
J 2 Global Communication
INTERNET - Internet Software and Services
|
$30.80
|
+1.45
4.94% |
$30.86
|
483,152
143.24% of 50 DAV
50 DAV is 337,300
|
$31.72
-2.90%
|
8/8/2011
|
$30.38
|
PP = $29.31
|
|
MB = $30.78
|
Most Recent Note - 8/29/2011 6:41:12 PM
Y - Color code is changed to yellow after a considerable confirming gain above its previously cited pivot point today with +43% above average volume, rallying for its best close of the year. Very little resistance remains due to overhead supply. See the latest FSU analysis for more details and a new annotated graph.
>>> The latest Featured Stock Update with an annotated graph appeared on 8/29/2011. Click here.
View all notes |
Alert me of new notes |
CANSLIM.net Company Profile |
SEC |
Zacks Reports |
StockTalk |
News |
Chart |
Request a new note
C
A N
S L
I M
|
MA
-
NYSE
Mastercard Inc Cl A
DIVERSIFIED SERVICES - Business/Management Services
|
$327.37
|
+2.04
0.63% |
$333.95
|
1,511,895
101.24% of 50 DAV
50 DAV is 1,493,400
|
$340.42
-3.83%
|
8/3/2011
|
$324.82
|
PP = $322.38
|
|
MB = $338.50
|
Most Recent Note - 8/29/2011 6:42:37 PM
Y - Perched -3.8% off its 8/03/11 all-time high after today's small gain on average volume. Recently found support near its 50 DMA line.
>>> The latest Featured Stock Update with an annotated graph appeared on 8/26/2011. Click here.
View all notes |
Alert me of new notes |
CANSLIM.net Company Profile |
SEC |
Zacks Reports |
StockTalk |
News |
Chart |
Request a new note
C
A N
S L
I M
|
MG
-
NYSE
Mistras Group Inc
DIVERSIFIED SERVICES - Bulding and Faci;ity Management Services
|
$20.41
|
+0.51
2.56% |
$20.82
|
177,796
117.90% of 50 DAV
50 DAV is 150,800
|
$20.10
1.54%
|
8/10/2011
|
$17.89
|
PP = $17.58
|
|
MB = $18.46
|
Most Recent Note - 8/29/2011 6:43:21 PM
G - Gapped up today and hit a new all-time high with a gain on slightly above average volume. No resistance remains due to overhead supply. Previous resistance in the $17-18 area defined important chart support after encountering mild distributional pressure.
>>> The latest Featured Stock Update with an annotated graph appeared on 8/24/2011. Click here.
View all notes |
Alert me of new notes |
CANSLIM.net Company Profile |
SEC |
Zacks Reports |
StockTalk |
News |
Chart |
Request a new note
C
A N
S L
I M
|
Symbol/Exchange
Company Name
Industry Group |
PRICE |
CHANGE
(%Change) |
Day High |
Volume
(% DAV)
(% 50 day avg vol) |
52 Wk Hi
% From Hi |
Featured
Date |
Price
Featured |
Pivot Featured |
|
Max Buy |
MKTX
-
NASDAQ
Marketaxess Holdings Inc
FINANCIAL SERVICES - Investment Brokerage - Nationa
|
$30.75
|
+1.07
3.61% |
$30.84
|
233,303
95.89% of 50 DAV
50 DAV is 243,300
|
$30.25
1.65%
|
7/29/2011
|
$25.87
|
PP = $26.35
|
|
MB = $27.67
|
Most Recent Note - 8/29/2011 6:44:39 PM
G - Rallied for a new all-time high today with a gain on lighter than average volume. It is extended from its prior base. Prior resistance in the $25-26 area defines chart support to watch.
>>> The latest Featured Stock Update with an annotated graph appeared on 8/23/2011. Click here.
View all notes |
Alert me of new notes |
CANSLIM.net Company Profile |
SEC |
Zacks Reports |
StockTalk |
News |
Chart |
Request a new note
C
A N
S L
I M
|
|
|
|
THESE ARE NOT BUY RECOMMENDATIONS!
Comments contained in the body of this report are technical
opinions only. The material herein has been obtained
from sources believed to be reliable and accurate, however,
its accuracy and completeness cannot be guaranteed.
This site is not an investment advisor, hence it does
not endorse or recommend any securities or other investments.
Any recommendation contained in this report may not
be suitable for all investors and it is not to be deemed
an offer or solicitation on our part with respect to
the purchase or sale of any securities. All trademarks,
service marks and trade names appearing in this report
are the property of their respective owners, and are
likewise used for identification purposes only.
This report is a service available
only to active Paid Premium Members.
You may opt-out of receiving report notifications
at any time. Questions or comments may be submitted
by writing to Premium Membership Services 665 S.E. 10 Street, Suite 201 Deerfield Beach, FL 33441-5634 or by calling 1-800-965-8307
or 954-785-1121.
|
|
|

