You are not logged in.
This means you
CAN ONLY VIEW reports that were published prior to Monday, February 26, 2024.
You
MUST UPGRADE YOUR MEMBERSHIP if you want to see any current reports.
AFTER MARKET UPDATE - WEDNESDAY, AUGUST 28TH, 2019
Previous After Market Report Next After Market Report >>>
|
|
|
|
DOW |
+258.20 |
26,036.10 |
+1.00% |
|
Volume |
706,896,390 |
-21% |
|
Volume |
1,660,742,890 |
-13% |
|
NASDAQ |
+29.93 |
7,856.88 |
+0.38% |
|
Advancers |
2,020 |
71% |
|
Advancers |
2,086 |
69% |
|
S&P 500 |
+18.78 |
2,887.94 |
+0.65% |
|
Decliners |
833 |
29% |
|
Decliners |
948 |
31% |
|
Russell 2000 |
+16.67 |
1,472.71 |
+1.15% |
|
52 Wk Highs |
115 |
|
|
52 Wk Highs |
69 |
|
|
S&P 600 |
+10.80 |
906.02 |
+1.21% |
|
52 Wk Lows |
163 |
|
|
52 Wk Lows |
158 |
|
|
 |
Breadth Positive But Gains Came With Lighter Volume Totals
Kenneth J. Gruneisen - Passed the CAN SLIM® Master's Exam
The Dow jumped 258 points, while the S&P 500 added 0.7%. The Nasdaq composite gained 0.4%. Volume totals reported were lighter than the prior session totals on the NYSE and on the Nasdaq exchange, revealing lackluster institutional buying demand. Breadth was positive as advancers led decliners by more than a 2-1 margin on the NYSE and on the Nasdaq exchange. There were 19 high-ranked companies from the Leaders List hit new 52-week highs and were listed on the BreakOuts Page, versus the total of 28 on the prior session. New 52-week lows outnumbered new 52-week highs totals on both the NYSE and Nasdaq exchange. A follow-through day on 8/13/19 marked a bullish shift concerning the M criteria of the fact-based investment system, but the market faced immediate pressure. Investors have a green light to make carefully selected new buying efforts, however, subsequent losses below prior low for the Nasdaq Composite Index would technically kill the new rally. The Featured Stocks Page provides the most timely analysis on high-ranked leaders.Charts used courtesy of www.stockcharts.com
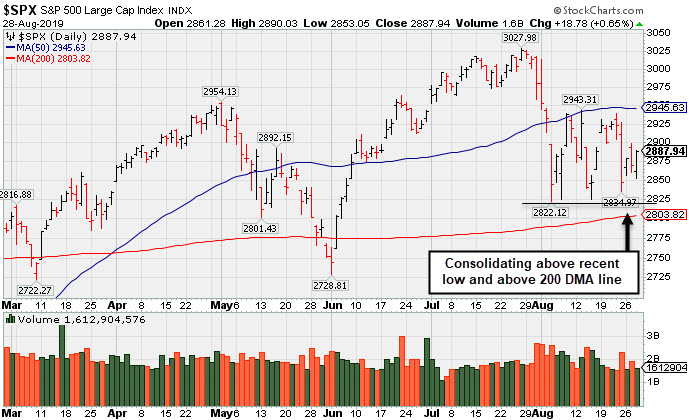
PICTURED: The S&P 500 Index's recent low defines important support above its 200-day moving average (DMA) line. More damaging losses would raise concerns and prompt investors to reduce their exposure to stocks.
U.S. stocks advanced on Wednesday, erasing early session losses as investors awaited the next market catalyst amid light trading volume. The U.S. and China trade dispute also remained in focus as the latest round of tariffs is expected to be implemented by each side on September 1.
Ten of 11 S&P 500 sectors finished in positive territory with the Utilities group as the lone decliner. Energy stocks paced the gains with WTI crude jumping 1.8% to $55.94/barrel after a government report showed U.S. stockpiles fell 10 million barrels last week. Consumer Discretionary shares also outperformed, with Tiffany & Co (TIF +3.0%) rose after the fine jewelry retailer easily beat analysts’ earnings expectations, but revenue and same-store sales came up short. In other earnings, Hewlett Packard Enterprises (HPE +3.40%) rose after the computer hardware company beat profit expectations and raised full-year earnings guidance. Autodesk (ADSK -6.74%) fell after reducing 2020 earnings and sales outlook.
The lone economic data update showed mortgage applications dropped 6.2% last week after dipping 0.9% in the prior period. Treasuries modestly strengthened, as the yield curve inversion persisted. The yield on the 10-year note was little changed at 1.47%, while the yield on the two-year note fell two basis points to 1.50%. The yield on the 30-year bond dipped one basis point to 1.94%, near its all-time low of 1.90% reached earlier and below the three-month bill yield of 1.98%. In commodities, COMEX gold lost 0.2% to $1,537.80/ounce.
|
 Kenneth J. Gruneisen started out as a licensed stockbroker in August 1987, a couple of months prior to the historic stock market crash that took the Dow Jones Industrial Average down -22.6% in a single day. He has published daily fact-based fundamental and technical analysis on high-ranked stocks online for two decades. Through FACTBASEDINVESTING.COM, Kenneth provides educational articles, news, market commentary, and other information regarding proven investment systems that work in good times and bad.
Comments contained in the body of this report are technical opinions only and are not necessarily those of Gruneisen Growth Corp. The material herein has been obtained from sources believed to be reliable and accurate, however, its accuracy and completeness cannot be guaranteed. Our firm, employees, and customers may effect transactions, including transactions contrary to any recommendation herein, or have positions in the securities mentioned herein or options with respect thereto. Any recommendation contained in this report may not be suitable for all investors and it is not to be deemed an offer or solicitation on our part with respect to the purchase or sale of any securities. |
|
 |
Financial, Retail, Tech and Energy Groups Rose
Kenneth J. Gruneisen - Passed the CAN SLIM® Master's Exam
The influential financial indexes both rose as the Bank Index ($BKX +1.40%) and Broker/Dealer Index ($XBD +1.36%) both outpaced the Retail Index ($RLX +1.08%). The tech sector had a positive bias as the Semiconductor Index ($SOX +0.60%), Biotech Index ($BTK +0.66%), and the Networking Index ($NWX +1.02%) each posted gains. Energy-linked groups rose as the Integrated Oil Index ($XOI +1.70%) and the Oil Services Index ($OSX +3.64%) both outpaced the Gold & Silver Index ($XAU +0.15%).
Charts courtesy of www.stockcharts.com
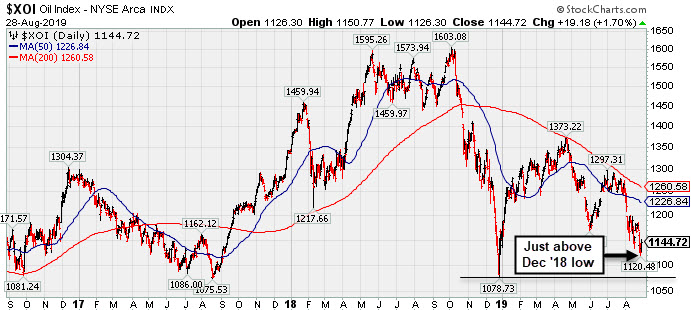
PICTURED: The 3-year graph of the Integrated Oil Index ($XOI +1.70%) shows it slumping near its December 2018 low.
| Oil Services |
$OSX |
61.83 |
+2.17 |
+3.64% |
-23.29% |
| Integrated Oil |
$XOI |
1,144.72 |
+19.18 |
+1.70% |
-1.24% |
| Semiconductor |
$SOX |
1,462.85 |
+8.73 |
+0.60% |
+26.64% |
| Networking |
$NWX |
540.34 |
+5.45 |
+1.02% |
+10.57% |
| Broker/Dealer |
$XBD |
250.45 |
+3.36 |
+1.36% |
+5.52% |
| Retail |
$RLX |
2,321.87 |
+24.81 |
+1.08% |
+18.98% |
| Gold & Silver |
$XAU |
101.19 |
+0.15 |
+0.15% |
+43.21% |
| Bank |
$BKX |
90.82 |
+1.25 |
+1.40% |
+5.86% |
| Biotech |
$BTK |
4,373.62 |
+28.56 |
+0.66% |
+3.62% |
|
|
|
 |
Slumped Near 200-Day Average Ahead of Earnings Report
Kenneth J. Gruneisen - Passed the CAN SLIM® Master's Exam
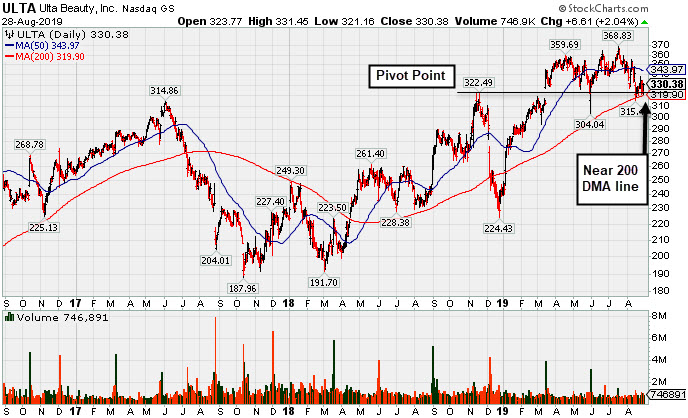
Ulta Beauty Inc (ULTA +$6.61 or +2.04% to $330.38) is still sputtering below its 50-day moving average (DMA) line ($344). Near-term support is defined by its 200 DMA line ($319.90) and recent low $315.49 on 8/15/19). It is -10.4% off its all-time high. A rebound above the 50 DMA line is needed to help its outlook improve.
Keep in mind it is due to report earnings news after the close on Thursday, August 29th. Volume and volatility often increase near earnings news. It reported earnings +17% on +13% sales revenues for the Apr '19 quarter, below the +25% minimum earnings guideline (C criteria), raising fundamental concerns. Earnings increases were above the +25% minimum guideline (C criteria) in the prior 4 quarterly comparisons. Its solid annual earnings (A criteria) history is very reassuring.
ULTA was last shown in this FSU section on 8/07/19 with an annotated graph under the headline, "Ulta Beauty Sputtering Below 50-Day Moving Average". It was highlighted in yellow in the 3/15/19 mid-day report with new pivot point based on its 11/19/18 high plus 10 cents (read here). A big "breakaway gap" on 3/15/19 backed by heavy volume triggered a technical buy signal.
It still has a small supply (S criteria) of only 58.5 million shares outstanding. The number of top-rated funds with an ownership interest has grown from 566 funds in Jun '14 to 1,751 funds as of Jun '19, which is a very encouraging sign of increasing institutional interest (the I criteria). Its current Up/Down Volume Ratio of 0.8 is an unbiased indication its shares have been under distributional pressure over the past 50 days.
|
|
|
Color Codes Explained :
Y - Better candidates highlighted by our
staff of experts.
G - Previously featured
in past reports as yellow but may no longer be buyable under the
guidelines.
***Last / Change / Volume data in this table is the closing quote data***
Symbol/Exchange
Company Name
Industry Group |
PRICE |
CHANGE
(%Change) |
Day High |
Volume
(% DAV)
(% 50 day avg vol) |
52 Wk Hi
% From Hi |
Featured
Date |
Price
Featured |
Pivot Featured |
|
Max Buy |
 EPAM
-
NYSE
EPAM
-
NYSE
Epam Systems Inc
COMPUTER SOFTWARE and SERVICES - Information Technology Service
|
$189.75
|
+0.85
0.45% |
$190.12
|
225,771
54.93% of 50 DAV
50 DAV is 411,000
|
$201.00
-5.60%
|
5/9/2019
|
$169.25
|
PP = $180.55
|
|
MB = $189.58
|
Most Recent Note - 8/23/2019 6:31:38 PM
G - Pulled back toward its 50 DMA line ($186). It has not formed a new base of sufficient length and faces some resistance due to overhead supply up to the $201 level. Reported earnings +27% on +24% sales revenues for the Jun '19 quarter.
>>> FEATURED STOCK ARTICLE : Rebounded Above 50-Day Average Following Earnings Report - 8/12/2019 |
View all notes |
Set NEW NOTE alert |
Company Profile |
SEC
News |
Chart |
Request a new note
C
A
S
I |
AUDC
-
NASDAQ
Audiocodes Ltd
ELECTRONICS - Scientific and Technical Instrum
|
$17.15
|
+0.11
0.65% |
$17.17
|
53,325
30.65% of 50 DAV
50 DAV is 174,000
|
$19.74
-13.12%
|
7/15/2019
|
$17.10
|
PP = $17.54
|
|
MB = $18.42
|
Most Recent Note - 8/23/2019 6:28:54 PM
Y - Support is defined by prior highs in the $17 area and its 50 DMA line ($17.01). More damaging losses would raise concerns and trigger technical sell signals. Reported earnings +57% on +14% sales revenues for the Jun '19 quarter, continuing its strong earnings track record.
>>> FEATURED STOCK ARTICLE : Volume Totals Cooling as Bullish Action Continues - 8/13/2019 |
View all notes |
Set NEW NOTE alert |
Company Profile |
SEC
News |
Chart |
Request a new note
C
A
S
I |
LHCG
-
NASDAQ
L H C Group Inc
HEALTH SERVICES - Home Health Care
|
$118.91
|
+0.91
0.77% |
$119.48
|
176,375
78.04% of 50 DAV
50 DAV is 226,000
|
$129.37
-8.09%
|
7/1/2019
|
$110.94
|
PP = $122.20
|
|
MB = $128.31
|
Most Recent Note - 8/26/2019 5:34:55 PM
G - Still quietly sputtering just below its 50 DMA line ($120.92) and below its pivot point. Any breach of recent low ($116.67 on 8/13/19) could raise more serious concerns.
>>> FEATURED STOCK ARTICLE : Sputtering Below 50-Day Average and Below Pivot Point - 8/20/2019 |
View all notes |
Set NEW NOTE alert |
Company Profile |
SEC
News |
Chart |
Request a new note
C
A
S
I |
CHDN
-
NASDAQ
Churchill Downs Inc
LEISURE - Gaming Activities
|
$124.71
|
+1.14
0.92% |
$124.79
|
214,708
91.37% of 50 DAV
50 DAV is 235,000
|
$132.73
-6.04%
|
7/22/2019
|
$118.45
|
PP = $118.89
|
|
MB = $124.83
|
Most Recent Note - 8/26/2019 5:32:08 PM
Y - Posted a gain today with above average volume. Found support near its 50 DMA line ($117). The prior low ($113.88 on 8/05/19) defines the next important near-term support to watch. Reported Jun '19 earnings rose +10% on +26% sales revenues versus the year ago period, below the +25% minimum earnings guideline (C criteria).
>>> FEATURED STOCK ARTICLE : Recently Found Support at 50-Day Moving Average - 8/14/2019 |
View all notes |
Set NEW NOTE alert |
Company Profile |
SEC
News |
Chart |
Request a new note
C
A
S
I |
LULU
-
NASDAQ
Lululemon Athletica
MANUFACTURING - Textile Manufacturing
|
$182.70
|
+2.59
1.44% |
$183.08
|
893,024
56.66% of 50 DAV
50 DAV is 1,576,000
|
$194.25
-5.95%
|
6/13/2019
|
$174.48
|
PP = $179.60
|
|
MB = $188.58
|
Most Recent Note - 8/26/2019 5:51:19 PM
G - Met resistance, but a convincing rebound above the 50 DMA line ($184) is needed to help its technical stance improve, and it faces near-term resistance up to the $194 level. Reported Apr '19 quarterly earnings +35% on +20% sales revenues versus the year ago period.
>>> FEATURED STOCK ARTICLE : Sputtering After Slump Below 50-Day Moving Average - 8/15/2019 |
View all notes |
Set NEW NOTE alert |
Company Profile |
SEC
News |
Chart |
Request a new note
C
A
S
I |
Symbol/Exchange
Company Name
Industry Group |
PRICE |
CHANGE
(%Change) |
Day High |
Volume
(% DAV)
(% 50 day avg vol) |
52 Wk Hi
% From Hi |
Featured
Date |
Price
Featured |
Pivot Featured |
|
Max Buy |
ULTA
-
NASDAQ
Ulta Beauty Inc
SPECIALTY RETAIL - Specialty Retail, Other
|
$330.38
|
+6.61
2.04% |
$331.45
|
753,105
106.22% of 50 DAV
50 DAV is 709,000
|
$368.83
-10.42%
|
3/15/2019
|
$341.27
|
PP = $322.59
|
|
MB = $338.72
|
 Most Recent Note - 8/28/2019 7:00:54 PM
G - A rebound above its 50 DMA line ($344) is needed for its outlook to improve. Recently found support above its 200 DMA line ($319) following volume-driven losses, but more damaging losses would raise serious concerns. Due to report earnings on 8/29/19 after the close. Volume and volatility often increase near earnings news. The Apr '19 quarter was below the +25% minimum earnings guideline (C criteria) which already raised fundamental concerns. See the latest FSU analysis for more details and a new annotated graph.
>>> FEATURED STOCK ARTICLE : Slumped Near 200-Day Average Ahead of Earnings Report - 8/28/2019 |
View all notes |
Set NEW NOTE alert |
Company Profile |
SEC
News |
Chart |
Request a new note
C
A
S
I |
CHGG
-
NYSE
Chegg Inc
Consumer Svcs-Education
|
$40.17
|
+0.26
0.65% |
$40.37
|
1,112,327
71.62% of 50 DAV
50 DAV is 1,553,000
|
$48.22
-16.69%
|
7/8/2019
|
$44.11
|
PP = $41.79
|
|
MB = $43.88
|
Most Recent Note - 8/27/2019 5:13:23 PM
G - Still sputtering below its 50 DMA line ($41.79) which acted as resistance after recent losses on higher volume. A rebound above the 50 DMA line is needed for its outlook to improve. Reported earnings +92% on +26% sales revenues for the Jun '19 quarter. See the latest FSU analysis for more details and a new annotated graph.
>>> FEATURED STOCK ARTICLE : Sputtering Below 50-Day Average Line in Recent Weeks - 8/27/2019 |
View all notes |
Set NEW NOTE alert |
Company Profile |
SEC
News |
Chart |
Request a new note
C
A
S
I |
VEEV
-
NYSE
Veeva Systems Inc Cl A
Computer Sftwr-Medical
|
$164.12
|
+0.71
0.43% |
$167.95
|
4,726,338
347.52% of 50 DAV
50 DAV is 1,360,000
|
$176.90
-7.22%
|
5/30/2019
|
$154.32
|
PP = $145.80
|
|
MB = $153.09
|
Most Recent Note - 8/28/2019 1:56:30 PM
G - Reported earnings +41% on +27% for the Jul '19 quarter continuing its strong earnings track record. Its 50 DMA line ($164.81) has acted as resistance after damaging volume-driven losses. A rebound above the 50 DMA line is needed for its outlook to improve.
>>> FEATURED STOCK ARTICLE : Met Resistance After Slumping Below 50-Day Moving Average - 8/23/2019 |
View all notes |
Set NEW NOTE alert |
Company Profile |
SEC
News |
Chart |
Request a new note
C
A
S
I |
PAYC
-
NYSE
Paycom Software Inc
COMPUTER SOFTWARE and SERVICES - Application Software
|
$253.23
|
-1.87
-0.73% |
$253.74
|
566,868
91.87% of 50 DAV
50 DAV is 617,000
|
$257.57
-1.68%
|
8/20/2019
|
$246.97
|
PP = $246.95
|
|
MB = $259.30
|
Most Recent Note - 8/26/2019 5:29:04 PM
Y - Wedged higher with recent gains lacking volume. Color code was changed to yellow with new pivot point cited based on its 7/11/19 high plus 10 cents. Gains above a stock's pivot must have at least +40% above average volume to trigger a proper new (or add-on) technical buy signal. Its 50 DMA line ($235) defines support above the recent low ($216.55 on 8/05/19). Reported earnings +27% on +31% sales revenues for the Jun '19 quarter, continuing its strong earnings track record. See the latest FSU analysis for more details and a new annotated graph.
>>> FEATURED STOCK ARTICLE : Recently Wedged Higher Without Great Volume Conviction - 8/26/2019 |
View all notes |
Set NEW NOTE alert |
Company Profile |
SEC
News |
Chart |
Request a new note
C
A
S
I |
BLD
-
NYSE
Topbuild Corp
Bldg-Constr Prds/Misc
|
$90.81
|
+2.67
3.03% |
$91.11
|
295,277
96.50% of 50 DAV
50 DAV is 306,000
|
$93.59
-2.97%
|
5/17/2019
|
$82.19
|
PP = $87.31
|
|
MB = $91.68
|
Most Recent Note - 8/23/2019 6:30:20 PM
G - Pulled back from its all-time high. Stubbornly held its ground following bullish action after it reported earnings +39% on +9% sales revenues for the Jun '19 quarter versus the year ago period, continuing its strong earnings track record. Its prior highs in the $86 area define initial support to watch above 50 DMA line ($83.89) on pullbacks.
>>> FEATURED STOCK ARTICLE : Topbuild Has 4 Consecutive Weekly Gains and Stubbornly Held Ground - 8/19/2019 |
View all notes |
Set NEW NOTE alert |
Company Profile |
SEC
News |
Chart |
Request a new note
C
A
S
I |
Symbol/Exchange
Company Name
Industry Group |
PRICE |
CHANGE
(%Change) |
Day High |
Volume
(% DAV)
(% 50 day avg vol) |
52 Wk Hi
% From Hi |
Featured
Date |
Price
Featured |
Pivot Featured |
|
Max Buy |
TEAM
-
NASDAQ
Atlassian Corp Plc Cl A
Comp Sftwr-Spec Enterprs
|
$138.27
|
-4.35
-3.05% |
$141.75
|
1,491,612
121.37% of 50 DAV
50 DAV is 1,229,000
|
$149.80
-7.70%
|
8/27/2019
|
$142.62
|
PP = $149.90
|
|
MB = $157.40
|
Most Recent Note - 8/27/2019 5:21:35 PM
Y - Formed a 5-week flat base and its color code is changed to yellow with new pivot point cited based on its 7/26/19 high plus 10 cents. Prior low ($130.78 on 7/23/19) defines the next important near-term support to watch where a violation would raise serious concerns and trigger a more worrisome technical sell signal. Reported earnings +43% on +36% sales revenues for the Jun '19 quarter, continuing its strong earnings track record.
>>> FEATURED STOCK ARTICLE : Consolidating Near High After Recently Finding Support - 8/21/2019 |
View all notes |
Set NEW NOTE alert |
Company Profile |
SEC
News |
Chart |
Request a new note
C
A
S
I |
TTD
-
NASDAQ
The Trade Desk Inc Cl A
Comml Svcs-Advertising
|
$248.39
|
+2.28
0.93% |
$250.33
|
707,644
48.70% of 50 DAV
50 DAV is 1,453,000
|
$289.51
-14.20%
|
7/18/2019
|
$240.61
|
PP = $258.10
|
|
MB = $271.01
|
Most Recent Note - 8/23/2019 6:34:19 PM
G - Undercut its 50 DMA line ($248) with a loss raising concerns and its color code is changed to green. The recent low ($239.01 on 8/21/19) defines important near-term support to watch. Violations would raise concerns and trigger technical sell signals. Reported Jun '19 quarterly earnings +58% on +42% sales revenues.
>>> FEATURED STOCK ARTICLE : Consolidating Near 50-Day Moving Average Line - 8/16/2019 |
View all notes |
Set NEW NOTE alert |
Company Profile |
SEC
News |
Chart |
Request a new note
C
A
S
I |
PAGS
-
NYSE
Pagseguro Digital Cl A
Finance-CrdtCard/PmtPr
|
$50.38
|
+0.28
0.56% |
$50.51
|
1,201,467
52.21% of 50 DAV
50 DAV is 2,301,000
|
$53.43
-5.71%
|
6/25/2019
|
$37.69
|
PP = $40.07
|
|
MB = $42.07
|
Most Recent Note - 8/27/2019 5:18:12 PM
G - Pulled back today for a 3rd consecutive small loss with lighter than average volume. Its 50 DMA line ($44) and the recent low ($42.00 on 8/05/19) defines important levels to watch on pullbacks. Reported earnings +35% on +39% sales revenues for the quarter ended June 30,2019 versus the year ago period.
>>> FEATURED STOCK ARTICLE : Brazil-Based Digital Payments Firm Perched at All-Time High - 8/22/2019 |
View all notes |
Set NEW NOTE alert |
Company Profile |
SEC
News |
Chart |
Request a new note
C
A
S
I |
|
|
|
THESE ARE NOT BUY RECOMMENDATIONS!
Comments contained in the body of this report are technical
opinions only. The material herein has been obtained
from sources believed to be reliable and accurate, however,
its accuracy and completeness cannot be guaranteed.
This site is not an investment advisor, hence it does
not endorse or recommend any securities or other investments.
Any recommendation contained in this report may not
be suitable for all investors and it is not to be deemed
an offer or solicitation on our part with respect to
the purchase or sale of any securities. All trademarks,
service marks and trade names appearing in this report
are the property of their respective owners, and are
likewise used for identification purposes only.
This report is a service available
only to active Paid Premium Members.
You may opt-out of receiving report notifications
at any time. Questions or comments may be submitted
by writing to Premium Membership Services 665 S.E. 10 Street, Suite 201 Deerfield Beach, FL 33441-5634 or by calling 1-800-965-8307
or 954-785-1121.
|
|
|