You are not logged in.
This means you
CAN ONLY VIEW reports that were published prior to Monday, February 26, 2024.
You
MUST UPGRADE YOUR MEMBERSHIP if you want to see any current reports.
AFTER MARKET UPDATE - TUESDAY, AUGUST 27TH, 2019
Previous After Market Report Next After Market Report >>>
|
|
|
|
DOW |
-120.93 |
25,777.90 |
-0.47% |
|
Volume |
890,303,500 |
+26% |
|
Volume |
1,914,284,880 |
+14% |
|
NASDAQ |
-26.79 |
7,826.95 |
-0.34% |
|
Advancers |
979 |
34% |
|
Advancers |
867 |
28% |
|
S&P 500 |
-9.22 |
2,869.16 |
-0.32% |
|
Decliners |
1,877 |
66% |
|
Decliners |
2,178 |
72% |
|
Russell 2000 |
-19.96 |
1,456.04 |
-1.35% |
|
52 Wk Highs |
130 |
|
|
52 Wk Highs |
72 |
|
|
S&P 600 |
-10.69 |
895.22 |
-1.18% |
|
52 Wk Lows |
209 |
|
|
52 Wk Lows |
210 |
|
|
 |
Distributional Pressure Weighs on Stocks After Positive Session Fades
Kenneth J. Gruneisen - Passed the CAN SLIM® Master's Exam
The Dow fell 120 points, while the S&P 500 and Nasdaq Composite both lost 0.3%. Volume totals reported were higher than the prior session totals on the NYSE and on the Nasdaq exchange, revealing institutional selling pressure. Breadth was negative as decliners led advancers by near a 2-1 margin on the NYSE and by more than 2-1 on the Nasdaq exchange. Leadership improved as 28 high-ranked companies from the Leaders List hit new 52-week highs and were listed on the BreakOuts Page, versus the total of 5 on the prior session. New 52-week lows outnumbered new 52-week highs totals on both the NYSE and Nasdaq exchange. A follow-through day on 8/13/19 marked a bullish shift concerning the M criteria of the fact-based investment system, but the market faced immediate pressure. Investors have a green light to make carefully selected new buying efforts, however, subsequent losses below prior low for the Nasdaq Composite Index would technically kill the new rally. The Featured Stocks Page provides the most timely analysis on high-ranked leaders.Charts used courtesy of www.stockcharts.com
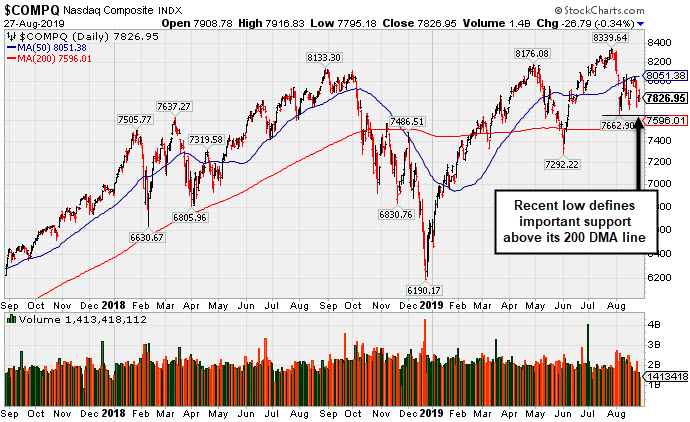
PICTURED: The Nasdaq Composite Index's recent low defines important support above its 200-day moving average (DMA) line. More damaging losses would raise concerns and prompt investors to reduce their exposure to stocks.
Stocks finished lower Tuesday as Chinese officials refused to confirm President Trump’s comments that the two countries are “getting back to the table.” Treasuries strengthened with the yield on the 10-year note dropping six basis points to 1.48%. The significant drop in the 10-year rate leaves the Treasury yield curve inverted with two-year note trading at 1.52%. The yield on the 30-year bond also garnered attention falling below the S&P 500 dividend yield for the first time since 2009.
Ten of 11 S&P 500 sectors declined with Financial stocks leading the retreat. In corporate news, Johnson and Johnson (JNJ +1.44%) rose after an Oklahoma judge ordered the drugmaker to pay a significantly lighter fine than expected in the opioid trial. Philip Morris (PM -7.78%) fell while Altria (MO -3.97%)also fell on news the two companies are discussing an all-stock merger. In earnings, J.M. Smucker (SJM -8.18%) fell after its quarterly figures disappointed Wall Street analysts.
On the data front, a report showed consumer confidence largely surpassed expectations, dipping to 135.1 in August from 135.8 last month, which had been the highest reading since November. The S&P CoreLogic Case Shiller release revealed home prices in its 20-City Composite increased at a 2.1% annualized pace in June, down from the prior period’s 2.4% gain. An update from the Richmond Fed showed manufacturing activity in the region improved this month. In commodities, WTI crude jumped 2.5% to $54.98/barrel, while COMEX gold gained 1.0% to $1,541.00/ounce.
|
 Kenneth J. Gruneisen started out as a licensed stockbroker in August 1987, a couple of months prior to the historic stock market crash that took the Dow Jones Industrial Average down -22.6% in a single day. He has published daily fact-based fundamental and technical analysis on high-ranked stocks online for two decades. Through FACTBASEDINVESTING.COM, Kenneth provides educational articles, news, market commentary, and other information regarding proven investment systems that work in good times and bad.
Comments contained in the body of this report are technical opinions only and are not necessarily those of Gruneisen Growth Corp. The material herein has been obtained from sources believed to be reliable and accurate, however, its accuracy and completeness cannot be guaranteed. Our firm, employees, and customers may effect transactions, including transactions contrary to any recommendation herein, or have positions in the securities mentioned herein or options with respect thereto. Any recommendation contained in this report may not be suitable for all investors and it is not to be deemed an offer or solicitation on our part with respect to the purchase or sale of any securities. |
|
 |
Gold & Silver Index Posts Another Standout Gain
Kenneth J. Gruneisen - Passed the CAN SLIM® Master's Exam
The influential financial indexes both slumped as the Bank Index ($BKX -0.94%) and Broker/Dealer Index ($XBD -0.76%) both outpaced the Retail Index ($RLX -0.38%) to the downside. The tech sector had a negative bias as the Biotech Index ($BTK -1.31%) and the Networking Index ($NWX -0.87%)both outpaced the Semiconductor Index ($SOX -0.33%) to the downside. Commodity-linked groups were mixed as the Integrated Oil Index ($XOI -0.75%) and the Oil Services Index ($OSX -0.96%) both slumped, meanwhile, the Gold & Silver Index ($XAU +3.42%) was a standout gainer.
Charts courtesy of www.stockcharts.com
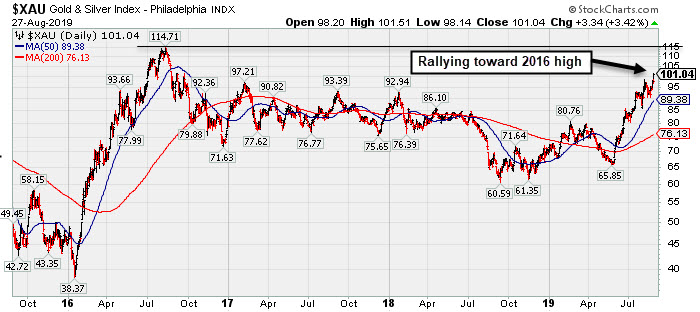
PICTURED: The 4-year graph of the Gold & Silver Index ($XAU +3.42%) shows it rallying toward its 2016 high.
| Oil Services |
$OSX |
59.66 |
-0.58 |
-0.96% |
-25.98% |
| Integrated Oil |
$XOI |
1,125.54 |
-8.56 |
-0.75% |
-2.90% |
| Semiconductor |
$SOX |
1,454.12 |
-4.76 |
-0.33% |
+25.88% |
| Networking |
$NWX |
534.89 |
-4.72 |
-0.87% |
+9.46% |
| Broker/Dealer |
$XBD |
247.09 |
-1.88 |
-0.76% |
+4.11% |
| Retail |
$RLX |
2,297.06 |
-8.83 |
-0.38% |
+17.71% |
| Gold & Silver |
$XAU |
101.04 |
+3.34 |
+3.42% |
+42.99% |
| Bank |
$BKX |
89.57 |
-0.84 |
-0.93% |
+4.41% |
| Biotech |
$BTK |
4,345.06 |
-57.54 |
-1.31% |
+2.94% |
|
|
|
 |
Sputtering Below 50-Day Average Line in Recent Weeks
Kenneth J. Gruneisen - Passed the CAN SLIM® Master's Exam
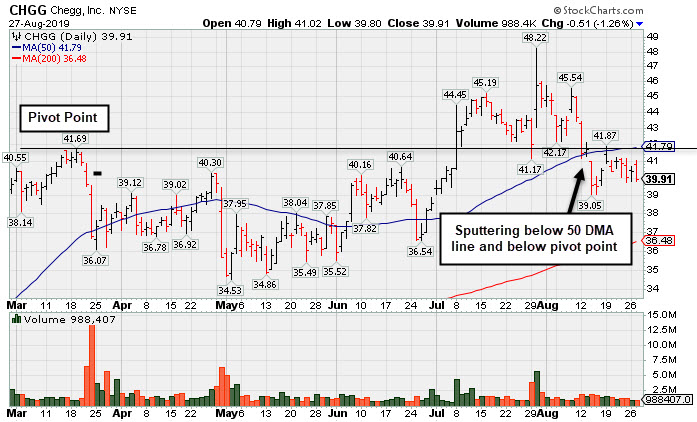
Chegg Inc (CHGG -$0.51 or -1.26% to $39.91) remains below its 50-day moving average (DMA) line ($41.79) which acted as resistance after recent losses on higher volume. A rebound above the 50 DMA line is needed for its outlook to improve.
It reported earnings +92% on +26% sales revenues for the Jun '19 quarter, continuing its strong earnings track record of earnings increases well above the +25% minimum earnings guideline (C criteria). Annual earnings (A criteria) have been growing at a strong pace since turning profitable in FY '16 following years of losses. It completed its $13 IPO in November of 2013 and another new Public Offering in August of 2017. It has 119.7 million shares outstanding.
CHGG slumped back below its pivot point and into the prior base since it was last shown in this FSU section on 8/06/19 with an annotated graph under the headline, "Consolidating Above Prior Highs and 50-Day Average". It was highlighted in yellow in the 7/08/19 mid-day report with a pivot point cited based on its 3/19/19 high plus 10 cents (read here).
The number of high-ranked funds owning its shares rose from 360 in Sep '18 to 474 in Jun '19, a reassuring sign concerning the I criteria. Its current Up/Down Volume Ratio of 1.3 is an unbiased indication its shares have been under slight accumulation over the past 50 days. It has earned a Timeliness Rating of A and Sponsorship Rating of B.
Charts courtesy of www.stockcharts.com
|
|
|
Color Codes Explained :
Y - Better candidates highlighted by our
staff of experts.
G - Previously featured
in past reports as yellow but may no longer be buyable under the
guidelines.
***Last / Change / Volume data in this table is the closing quote data***
Symbol/Exchange
Company Name
Industry Group |
PRICE |
CHANGE
(%Change) |
Day High |
Volume
(% DAV)
(% 50 day avg vol) |
52 Wk Hi
% From Hi |
Featured
Date |
Price
Featured |
Pivot Featured |
|
Max Buy |
 EPAM
-
NYSE
EPAM
-
NYSE
Epam Systems Inc
COMPUTER SOFTWARE and SERVICES - Information Technology Service
|
$188.90
|
-0.07
-0.04% |
$190.53
|
462,740
112.04% of 50 DAV
50 DAV is 413,000
|
$201.00
-6.02%
|
5/9/2019
|
$169.25
|
PP = $180.55
|
|
MB = $189.58
|
Most Recent Note - 8/23/2019 6:31:38 PM
G - Pulled back toward its 50 DMA line ($186). It has not formed a new base of sufficient length and faces some resistance due to overhead supply up to the $201 level. Reported earnings +27% on +24% sales revenues for the Jun '19 quarter.
>>> FEATURED STOCK ARTICLE : Rebounded Above 50-Day Average Following Earnings Report - 8/12/2019 |
View all notes |
Set NEW NOTE alert |
Company Profile |
SEC
News |
Chart |
Request a new note
C
A
S
I |
AUDC
-
NASDAQ
Audiocodes Ltd
ELECTRONICS - Scientific and Technical Instrum
|
$17.04
|
-0.16
-0.93% |
$17.51
|
97,087
55.48% of 50 DAV
50 DAV is 175,000
|
$19.74
-13.68%
|
7/15/2019
|
$17.10
|
PP = $17.54
|
|
MB = $18.42
|
Most Recent Note - 8/23/2019 6:28:54 PM
Y - Support is defined by prior highs in the $17 area and its 50 DMA line ($17.01). More damaging losses would raise concerns and trigger technical sell signals. Reported earnings +57% on +14% sales revenues for the Jun '19 quarter, continuing its strong earnings track record.
>>> FEATURED STOCK ARTICLE : Volume Totals Cooling as Bullish Action Continues - 8/13/2019 |
View all notes |
Set NEW NOTE alert |
Company Profile |
SEC
News |
Chart |
Request a new note
C
A
S
I |
LHCG
-
NASDAQ
L H C Group Inc
HEALTH SERVICES - Home Health Care
|
$118.00
|
-1.33
-1.11% |
$121.03
|
240,581
106.92% of 50 DAV
50 DAV is 225,000
|
$129.37
-8.79%
|
7/1/2019
|
$110.94
|
PP = $122.20
|
|
MB = $128.31
|
Most Recent Note - 8/26/2019 5:34:55 PM
G - Still quietly sputtering just below its 50 DMA line ($120.92) and below its pivot point. Any breach of recent low ($116.67 on 8/13/19) could raise more serious concerns.
>>> FEATURED STOCK ARTICLE : Sputtering Below 50-Day Average and Below Pivot Point - 8/20/2019 |
View all notes |
Set NEW NOTE alert |
Company Profile |
SEC
News |
Chart |
Request a new note
C
A
S
I |
CHDN
-
NASDAQ
Churchill Downs Inc
LEISURE - Gaming Activities
|
$123.57
|
-0.23
-0.19% |
$124.88
|
220,107
94.06% of 50 DAV
50 DAV is 234,000
|
$132.73
-6.90%
|
7/22/2019
|
$118.45
|
PP = $118.89
|
|
MB = $124.83
|
Most Recent Note - 8/26/2019 5:32:08 PM
Y - Posted a gain today with above average volume. Found support near its 50 DMA line ($117). The prior low ($113.88 on 8/05/19) defines the next important near-term support to watch. Reported Jun '19 earnings rose +10% on +26% sales revenues versus the year ago period, below the +25% minimum earnings guideline (C criteria).
>>> FEATURED STOCK ARTICLE : Recently Found Support at 50-Day Moving Average - 8/14/2019 |
View all notes |
Set NEW NOTE alert |
Company Profile |
SEC
News |
Chart |
Request a new note
C
A
S
I |
LULU
-
NASDAQ
Lululemon Athletica
MANUFACTURING - Textile Manufacturing
|
$180.11
|
-2.24
-1.23% |
$183.80
|
1,427,851
87.76% of 50 DAV
50 DAV is 1,627,000
|
$194.25
-7.28%
|
6/13/2019
|
$174.48
|
PP = $179.60
|
|
MB = $188.58
|
Most Recent Note - 8/26/2019 5:51:19 PM
G - Met resistance, but a convincing rebound above the 50 DMA line ($184) is needed to help its technical stance improve, and it faces near-term resistance up to the $194 level. Reported Apr '19 quarterly earnings +35% on +20% sales revenues versus the year ago period.
>>> FEATURED STOCK ARTICLE : Sputtering After Slump Below 50-Day Moving Average - 8/15/2019 |
View all notes |
Set NEW NOTE alert |
Company Profile |
SEC
News |
Chart |
Request a new note
C
A
S
I |
Symbol/Exchange
Company Name
Industry Group |
PRICE |
CHANGE
(%Change) |
Day High |
Volume
(% DAV)
(% 50 day avg vol) |
52 Wk Hi
% From Hi |
Featured
Date |
Price
Featured |
Pivot Featured |
|
Max Buy |
ULTA
-
NASDAQ
Ulta Beauty Inc
SPECIALTY RETAIL - Specialty Retail, Other
|
$323.77
|
-6.45
-1.95% |
$334.80
|
1,000,719
142.76% of 50 DAV
50 DAV is 701,000
|
$368.83
-12.22%
|
3/15/2019
|
$341.27
|
PP = $322.59
|
|
MB = $338.72
|
Most Recent Note - 8/26/2019 5:53:36 PM
G - A rebound above its 50 DMA line ($345) is needed for its outlook to improve. Recently found support above its 200 DMA line ($319) following volume-driven losses, but more damaging losses would raise serious concerns. Due to report earnings on 8/29/19. Volume and volatility often increase near earnings news. The Apr '19 quarter was below the +25% minimum earnings guideline (C criteria) which already raised fundamental concerns.
>>> FEATURED STOCK ARTICLE : Ulta Beauty Sputtering Below 50-Day Moving Average - 8/7/2019 |
View all notes |
Set NEW NOTE alert |
Company Profile |
SEC
News |
Chart |
Request a new note
C
A
S
I |
CHGG
-
NYSE
Chegg Inc
Consumer Svcs-Education
|
$39.91
|
-0.51
-1.26% |
$41.02
|
988,409
63.77% of 50 DAV
50 DAV is 1,550,000
|
$48.22
-17.23%
|
7/8/2019
|
$44.11
|
PP = $41.79
|
|
MB = $43.88
|
 Most Recent Note - 8/27/2019 5:13:23 PM
G - Still sputtering below its 50 DMA line ($41.79) which acted as resistance after recent losses on higher volume. A rebound above the 50 DMA line is needed for its outlook to improve. Reported earnings +92% on +26% sales revenues for the Jun '19 quarter. See the latest FSU analysis for more details and a new annotated graph.
>>> FEATURED STOCK ARTICLE : Sputtering Below 50-Day Average Line in Recent Weeks - 8/27/2019 |
View all notes |
Set NEW NOTE alert |
Company Profile |
SEC
News |
Chart |
Request a new note
C
A
S
I |
VEEV
-
NYSE
Veeva Systems Inc Cl A
Computer Sftwr-Medical
|
$163.41
|
+0.74
0.45% |
$166.98
|
2,947,445
223.12% of 50 DAV
50 DAV is 1,321,000
|
$176.90
-7.63%
|
5/30/2019
|
$154.32
|
PP = $145.80
|
|
MB = $153.09
|
Most Recent Note - 8/27/2019 1:11:49 PM
G - Traded up above it earlier today, however its 50 DMA line ($165) has acted as resistance after damaging volume-driven losses. A rebound above the 50 DMA line is needed for its outlook to improve. Fundamentals remain strong.
>>> FEATURED STOCK ARTICLE : Met Resistance After Slumping Below 50-Day Moving Average - 8/23/2019 |
View all notes |
Set NEW NOTE alert |
Company Profile |
SEC
News |
Chart |
Request a new note
C
A
S
I |
PAYC
-
NYSE
Paycom Software Inc
COMPUTER SOFTWARE and SERVICES - Application Software
|
$255.10
|
+2.42
0.96% |
$257.57
|
529,640
85.70% of 50 DAV
50 DAV is 618,000
|
$256.84
-0.68%
|
8/20/2019
|
$246.97
|
PP = $246.95
|
|
MB = $259.30
|
Most Recent Note - 8/26/2019 5:29:04 PM
Y - Wedged higher with recent gains lacking volume. Color code was changed to yellow with new pivot point cited based on its 7/11/19 high plus 10 cents. Gains above a stock's pivot must have at least +40% above average volume to trigger a proper new (or add-on) technical buy signal. Its 50 DMA line ($235) defines support above the recent low ($216.55 on 8/05/19). Reported earnings +27% on +31% sales revenues for the Jun '19 quarter, continuing its strong earnings track record. See the latest FSU analysis for more details and a new annotated graph.
>>> FEATURED STOCK ARTICLE : Recently Wedged Higher Without Great Volume Conviction - 8/26/2019 |
View all notes |
Set NEW NOTE alert |
Company Profile |
SEC
News |
Chart |
Request a new note
C
A
S
I |
BLD
-
NYSE
Topbuild Corp
Bldg-Constr Prds/Misc
|
$88.14
|
-1.41
-1.57% |
$90.72
|
219,315
70.98% of 50 DAV
50 DAV is 309,000
|
$93.59
-5.82%
|
5/17/2019
|
$82.19
|
PP = $87.31
|
|
MB = $91.68
|
Most Recent Note - 8/23/2019 6:30:20 PM
G - Pulled back from its all-time high. Stubbornly held its ground following bullish action after it reported earnings +39% on +9% sales revenues for the Jun '19 quarter versus the year ago period, continuing its strong earnings track record. Its prior highs in the $86 area define initial support to watch above 50 DMA line ($83.89) on pullbacks.
>>> FEATURED STOCK ARTICLE : Topbuild Has 4 Consecutive Weekly Gains and Stubbornly Held Ground - 8/19/2019 |
View all notes |
Set NEW NOTE alert |
Company Profile |
SEC
News |
Chart |
Request a new note
C
A
S
I |
Symbol/Exchange
Company Name
Industry Group |
PRICE |
CHANGE
(%Change) |
Day High |
Volume
(% DAV)
(% 50 day avg vol) |
52 Wk Hi
% From Hi |
Featured
Date |
Price
Featured |
Pivot Featured |
|
Max Buy |
TEAM
-
NASDAQ
Atlassian Corp Plc Cl A
Comp Sftwr-Spec Enterprs
|
$142.62
|
-0.24
-0.17% |
$145.06
|
1,057,914
86.57% of 50 DAV
50 DAV is 1,222,000
|
$149.80
-4.79%
|
8/27/2019
|
$142.62
|
PP = $149.90
|
|
MB = $157.40
|
Most Recent Note - 8/27/2019 5:21:35 PM
Y - Formed a 5-week flat base and its color code is changed to yellow with new pivot point cited based on its 7/26/19 high plus 10 cents. Prior low ($130.78 on 7/23/19) defines the next important near-term support to watch where a violation would raise serious concerns and trigger a more worrisome technical sell signal. Reported earnings +43% on +36% sales revenues for the Jun '19 quarter, continuing its strong earnings track record.
>>> FEATURED STOCK ARTICLE : Consolidating Near High After Recently Finding Support - 8/21/2019 |
View all notes |
Set NEW NOTE alert |
Company Profile |
SEC
News |
Chart |
Request a new note
C
A
S
I |
TTD
-
NASDAQ
The Trade Desk Inc Cl A
Comml Svcs-Advertising
|
$246.11
|
-4.75
-1.89% |
$256.03
|
950,518
65.37% of 50 DAV
50 DAV is 1,454,000
|
$289.51
-14.99%
|
7/18/2019
|
$240.61
|
PP = $258.10
|
|
MB = $271.01
|
Most Recent Note - 8/23/2019 6:34:19 PM
G - Undercut its 50 DMA line ($248) with a loss raising concerns and its color code is changed to green. The recent low ($239.01 on 8/21/19) defines important near-term support to watch. Violations would raise concerns and trigger technical sell signals. Reported Jun '19 quarterly earnings +58% on +42% sales revenues.
>>> FEATURED STOCK ARTICLE : Consolidating Near 50-Day Moving Average Line - 8/16/2019 |
View all notes |
Set NEW NOTE alert |
Company Profile |
SEC
News |
Chart |
Request a new note
C
A
S
I |
PAGS
-
NYSE
Pagseguro Digital Cl A
Finance-CrdtCard/PmtPr
|
$50.10
|
-0.20
-0.40% |
$51.37
|
1,217,098
52.60% of 50 DAV
50 DAV is 2,314,000
|
$53.43
-6.23%
|
6/25/2019
|
$37.69
|
PP = $40.07
|
|
MB = $42.07
|
Most Recent Note - 8/27/2019 5:18:12 PM
G - Pulled back today for a 3rd consecutive small loss with lighter than average volume. Its 50 DMA line ($44) and the recent low ($42.00 on 8/05/19) defines important levels to watch on pullbacks. Reported earnings +35% on +39% sales revenues for the quarter ended June 30,2019 versus the year ago period.
>>> FEATURED STOCK ARTICLE : Brazil-Based Digital Payments Firm Perched at All-Time High - 8/22/2019 |
View all notes |
Set NEW NOTE alert |
Company Profile |
SEC
News |
Chart |
Request a new note
C
A
S
I |
|
|
|
THESE ARE NOT BUY RECOMMENDATIONS!
Comments contained in the body of this report are technical
opinions only. The material herein has been obtained
from sources believed to be reliable and accurate, however,
its accuracy and completeness cannot be guaranteed.
This site is not an investment advisor, hence it does
not endorse or recommend any securities or other investments.
Any recommendation contained in this report may not
be suitable for all investors and it is not to be deemed
an offer or solicitation on our part with respect to
the purchase or sale of any securities. All trademarks,
service marks and trade names appearing in this report
are the property of their respective owners, and are
likewise used for identification purposes only.
This report is a service available
only to active Paid Premium Members.
You may opt-out of receiving report notifications
at any time. Questions or comments may be submitted
by writing to Premium Membership Services 665 S.E. 10 Street, Suite 201 Deerfield Beach, FL 33441-5634 or by calling 1-800-965-8307
or 954-785-1121.
|
|
|

