You are not logged in.
This means you
CAN ONLY VIEW reports that were published prior to Monday, April 14, 2025.
You
MUST UPGRADE YOUR MEMBERSHIP if you want to see any current reports.
AFTER MARKET UPDATE - FRIDAY, AUGUST 27TH, 2010
Previous After Market Report Next After Market Report >>>
|
|
|
|
DOW |
+164.84 |
10,150.65 |
+1.65% |
|
Volume |
1,098,413,390 |
+5% |
|
Volume |
2,164,640,151 |
+23% |
|
NASDAQ |
+34.94 |
2,153.63 |
+1.65% |
|
Advancers |
2,608 |
84% |
|
Advancers |
2,165 |
79% |
|
S&P 500 |
+17.37 |
1,064.59 |
+1.66% |
|
Decliners |
392 |
13% |
|
Decliners |
470 |
17% |
|
Russell 2000 |
+17.00 |
616.76 |
+2.83% |
|
52 Wk Highs |
142 |
|
|
52 Wk Highs |
22 |
|
|
S&P 600 |
+8.55 |
330.22 |
+2.66% |
|
52 Wk Lows |
71 |
|
|
52 Wk Lows |
83 |
|
|
 |
Stocks Ended A Negative Week On A High Note
Adam Sarhan, Contributing Writer,
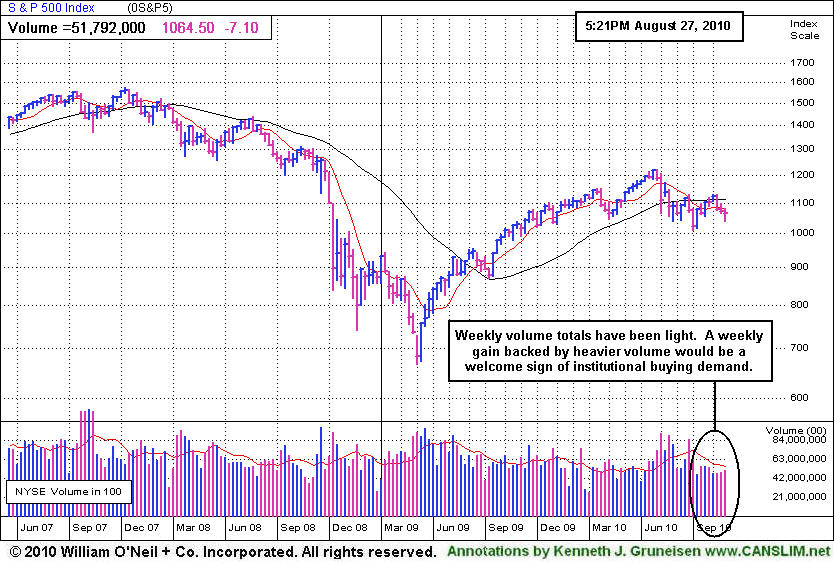
The seven week rally that began on the July 7, 2010 follow-through day (FTD) ended on Tuesday after the latest round of dismal economic data dragged stocks lower. For the week, stocks ended lower but near their highs after a strong advance on Friday. Friday's volume totals ended higher on the NYSE and the Nasdaq exchange compared to Thursday's levels which suggested that large institutions were aggressively buying stocks. Advancers trumped decliners by a 7-to-1 ratio on the NYSE and a 4-to-1 ratio on the Nasdaq exchange. New 52-week highs outnumbered new 52-week lows on the NYSE but trailed new lows on the Nasdaq exchange. There were 21 high-ranked companies from the CANSLIM.net Leaders List made a new 52-week high and appeared on the CANSLIM.net BreakOuts Page, higher than the 10 issues that appeared on the prior session.
The major averages negatively reversed (opened higher but closed lower) on Monday after encountering resistance near their respective 50-day moving average (DMA) lines. Stocks slid on Tuesday after existing home sales tanked, the 10-year Treasury yield plunged to the lowest level in 17 months, and the yen rose to the highest level versus the dollar since 1995. Overnight, stocks in Asia and Europe fell after the yen jumped to a 15-year high against the dollar and Treasury rates slid to their lowest level since the March 2009 bottom. This put pressure on US futures and set the stage for a weak open. The "big" headline of the day occurred when the National Association of Realtors said existing home sales slid by -27.2% to a 3.83 million annual rate in April. The outsized decline was attributed to a high unemployment rate and slowing economic data. This was also the lowest reading in a decade and lower than the worst estimate on Wall Street.
The major averages ended higher on Wednesday which marked Day 1 of a new rally attempt, helping the market snap a four day losing streak. It was somewhat encouraging to see stocks end higher even after new home sales plunged to a record low and durable goods orders fell short of analyst estimates. The Commerce Department said new home sales unexpectedly slid last month to the lowest level on record which suggests the housing market remains very weak. Sales fell -12% from June to an annual pace of 276,000, the lowest level since data began in 1963! The report also showed that the median home price fell to $204,000 which was the lowest reading since late 2003. Meanwhile, durable goods orders, which are goods that are made to last at least three years, rose less than forecast in July. Durable goods orders rose +0.3%, which fell short of the +3% gain analysts had expected. Excluding transportation equipment, demand unexpectedly plunged -3.8% which is the largest monthly decline since January 2009
Before Thursday's open, the Labor Department said applications for jobless benefits slid by 31,000, more than forecast. The report helped allay concern that American employers are not aggressively cutting jobs as the economy slows. The report showed that jobless claims slid to -473,000 in the week ended August 21, 2010. However, shares came under pressure after a Spanish court voided 5.1 billion euros ($6.48 billion) in value-added tax collected in recent years. The move caught many people off guard and sparked concern that the ruling may reignite the European debt crisis. Stocks ended with solid gains on Friday after the GDP rose +1.6% and Ben Bernanke spoke at the Fed's annual symposium in Jackson Hole, Wyoming. The Dow Jones Industrial Average, Nasdaq Composite, and the benchmark S&P 500 Index all undercut Wednesday's lows which reset the day count. Therefore, Friday marked Day 1 of a new rally attempt which means that the earliest a possible follow-through day (FTD) could emerge will be Wednesday. However, if at anytime, Friday's lows (Day 1) are breached then the day count will be reset. The technical action in the major averages has recently been weak while the latest round of economic data has provided a poor outlook for the market and the global recovery. Currently, resistance for the the major averages are their 50-day moving average (DMA) lines, then their longer-term 200 DMA lines while support remains July's lows. It is also disconcerting to see weakness in the financial group. Meanwhile, the action in leading stocks and fact that some high-ranked leaders are breaking out of sound bases can be considered somewhat encouraging. Still there is importance in remaining cautious until the major averages are back in a confirmed uptrend. Put simply, we can expect this sideways/choppy action to continue until the market breaks out above resistance or below support. The first scenario will have bullish ramifications while the second will be clearly bearish. Trade accordingly.
The Market Is In A Correction, Does Your Broker Know?
Our skilled team of portfolio managers knows how to follow the rules of this fact-based investment system. We do not follow opinion or the "conviction list" of some large Wall Street institution which would have us fully invested even during horrific bear markets. Instead, we remain fluid and only buy the best stocks when they are triggering proper technical buy signals. If you are not completely satisfied with the way your portfolio is being managed, Click here to submit your inquiry. *Accounts over $250,000 please. ** Serious inquires only.
PICTURED: The S&P 500 Index's weekly volume totals have been light. A weekly gain backed by heavier volume would be a welcome sign of institutional buying demand.
|
|
|
 |
Widespread Group Gains As Major Averages Attempt New Rally
Kenneth J. Gruneisen - Passed the CAN SLIM® Master's Exam
The Bank Index ($BKX +2.53%) and Broker/Dealer Index ($XBD +1.90%) halted their worrisome slide and posted gains amid the market's widespread strength on Friday. The Retail Index ($RLX +1.13%) and tech shares posted gains as the Internet Index ($IIX +1.64%), Semiconductor Index ($SOX +2.07%), Biotechnology Index ($BTK +2.13%), and Networking Index ($NWX +2.39%) posted unanimous gains. The Oil Services Index ($OSX +3.60%) and Integrated Oil Index ($XOI +2.37%) also posted solid gains and the Healthcare Index ($HMO +1.99%) rose.
Charts courtesy www.stockcharts.com
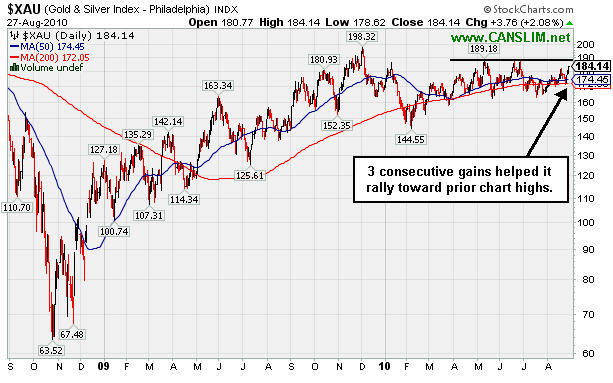
PICTURED: The Gold & Silver Index ($XAU +2.08%) has posted 3 consecutive gains while rallying toward its prior highs. The 2 year chart above shows how it has been consolidating for many months after rallying from the Bear Market lows.
| Oil Services |
$OSX |
175.86 |
+6.11 |
+3.60% |
-9.78% |
| Healthcare |
$HMO |
1,483.31 |
+28.88 |
+1.99% |
+0.70% |
| Integrated Oil |
$XOI |
944.60 |
+21.90 |
+2.37% |
-11.57% |
| Semiconductor |
$SOX |
321.76 |
+6.53 |
+2.07% |
-10.60% |
| Networking |
$NWX |
230.48 |
+5.38 |
+2.39% |
-0.25% |
| Internet |
$IIX |
248.75 |
+4.00 |
+1.64% |
+6.37% |
| Broker/Dealer |
$XBD |
100.53 |
+1.87 |
+1.90% |
-12.62% |
| Retail |
$RLX |
405.82 |
+4.54 |
+1.13% |
-1.29% |
| Gold & Silver |
$XAU |
184.14 |
+3.76 |
+2.08% |
+9.44% |
| Bank |
$BKX |
44.19 |
+1.09 |
+2.53% |
+3.47% |
| Biotech |
$BTK |
1,072.73 |
+22.64 |
+2.16% |
+13.86% |
|
|
|
 |
Market Cheers Healthcare Firms' Plans To Combine
Kenneth J. Gruneisen - Passed the CAN SLIM® Master's Exam
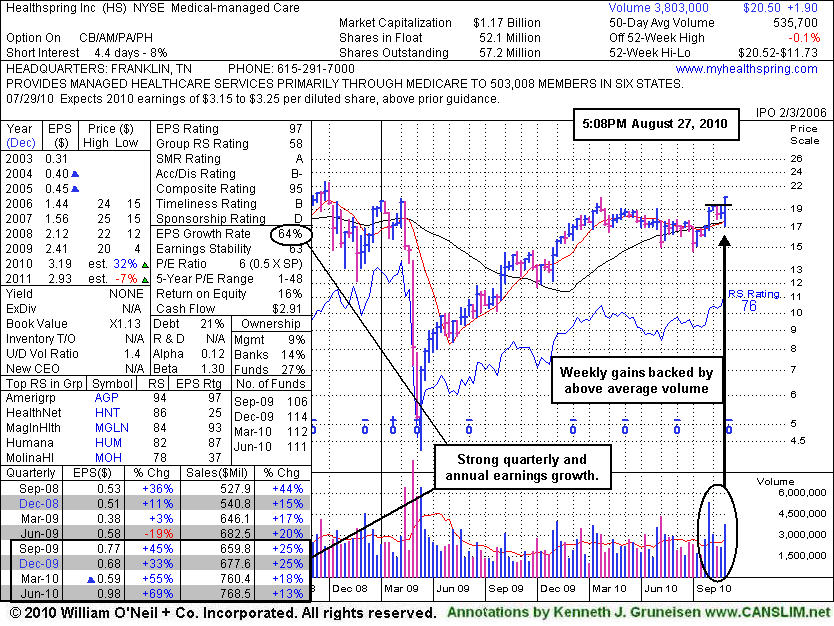
Healthspring Inc (HS +$2.11 or +11.47% to $20.50) gapped up today after announcing news that it will acquire Bravo Health for $545 million. It was featured in the mid-day report (read here) rallying from a short flat base after finding support above its 50-day moving average (DMA) and 200 DMA lines during its light volume pullback following an earlier (7/29/10) breakout. It faces resistance at its 52-week high and the M criteria remains a concern until a follow-through day emerges. Quarterly and annual earnings comparisons have showed strong +25%. or greater increases (good C and A criteria) history. Street estimates had not been calling for great earnings growth in FY '11, and the effects of recent healthcare legislation have made it difficult to make conclusions concerning the outlook of many healthcare companies, however the fresh M&A news was cheered on Friday. Its weekly chart shows a few recent weeks with gains backed by above average volume, a reassuring sign of institutional buying demand.
 |
|
|
Color Codes Explained :
Y - Better candidates highlighted by our
staff of experts.
G - Previously featured
in past reports as yellow but may no longer be buyable under the
guidelines.
***Last / Change / Volume data in this table is the closing quote data***
Symbol/Exchange
Company Name
Industry Group |
PRICE |
CHANGE
(%Change) |
Day High |
Volume
(% DAV)
(% 50 day avg vol) |
52 Wk Hi
% From Hi |
Featured
Date |
Price
Featured |
Pivot Featured |
|
Max Buy |
ABV
-
NYSE
Comp De Bebidas Adr
FOOD and BEVERAGE - Beverages - Brewers
|
$108.58
|
+1.97
1.85% |
$108.61
|
446,053
67.57% of 50 DAV
50 DAV is 660,100
|
$112.60
-3.57%
|
6/29/2010
|
$104.74
|
PP = $109.33
|
|
MB = $114.80
|
 Most Recent Note - 8/27/2010 4:22:01 PM
G - This Brazil-based beverage firm posted a small gain today on light volume, making a stand at its 50 DMA line.
>>> The latest Featured Stock Update with an annotated graph appeared on 8/18/2010. Click here.
View all notes |
Alert me of new notes |
CANSLIM.net Company Profile |
SEC |
Zacks Reports |
StockTalk |
News |
Chart |
Request a new note
C
A N
S L
I M


|
BIDU
-
NASDAQ
Baidu Inc Ads
INTERNET - Internet Information Providers
|
$79.37
|
+2.77
3.62% |
$79.68
|
7,552,039
67.67% of 50 DAV
50 DAV is 11,159,400
|
$88.32
-10.13%
|
7/14/2010
|
$75.03
|
PP = $78.59
|
|
MB = $82.52
|
Most Recent Note - 8/27/2010 4:24:57 PM
G - Posted a gain with light volume today, closing the week above its 50 DMA line.
>>> The latest Featured Stock Update with an annotated graph appeared on 8/13/2010. Click here.
View all notes |
Alert me of new notes |
CANSLIM.net Company Profile |
SEC |
Zacks Reports |
StockTalk |
News |
Chart |
Request a new note
C
A N
S L
I M
|
CACC
-
NASDAQ
Credit Acceptance Corp
FINANCIAL SERVICES - Credit Services
|
$59.67
|
+0.64
1.08% |
$59.85
|
26,709
49.37% of 50 DAV
50 DAV is 54,100
|
$61.41
-2.83%
|
7/29/2010
|
$52.04
|
PP = $54.07
|
|
MB = $56.77
|
Most Recent Note - 8/27/2010 4:29:25 PM
G - Holding its ground in a tight range near all-time highs with volume totals cooling. Support to watch is its 50 DMA and old high near $54. It traded up in 19 of the past 21 months.
>>> The latest Featured Stock Update with an annotated graph appeared on 8/2/2010. Click here.
View all notes |
Alert me of new notes |
CANSLIM.net Company Profile |
SEC |
Zacks Reports |
StockTalk |
News |
Chart |
Request a new note
C
A N
S L
I M
|
CRM
-
NYSE
Salesforce.Com Inc
INTERNET - Internet Software and Services
|
$111.48
|
+1.64
1.49% |
$112.20
|
3,013,492
118.91% of 50 DAV
50 DAV is 2,534,200
|
$114.15
-2.34%
|
6/2/2010
|
$88.44
|
PP = $89.60
|
|
MB = $94.08
|
Most Recent Note - 8/27/2010 12:28:27 PM
G - It is extended from any sound base, not currently buyable under the investment system guidelines.
>>> The latest Featured Stock Update with an annotated graph appeared on 8/16/2010. Click here.
View all notes |
Alert me of new notes |
CANSLIM.net Company Profile |
SEC |
Zacks Reports |
StockTalk |
News |
Chart |
Request a new note
C
A N
S L
I M
|
EGO
-
NYSE
Eldorado Gold Corp
METALS and MINING - Gold
|
$19.63
|
+0.41
2.13% |
$19.63
|
6,494,722
156.61% of 50 DAV
50 DAV is 4,147,100
|
$19.48
0.77%
|
8/19/2010
|
$18.25
|
PP = $19.17
|
|
MB = $20.13
|
Most Recent Note - 8/27/2010 4:36:54 PM
Y - Closed near the session high today with a 3rd consecutive gain backed by above average volume for the Canada-based mining firm. It triggered a technical buy signal this week, but keep in mind that 3 out of 4 stocks go the direction of the major averages and the M criteria argues against new buying efforts until a follow-through day confirms a new rally.
>>> The latest Featured Stock Update with an annotated graph appeared on 8/19/2010. Click here.
View all notes |
Alert me of new notes |
CANSLIM.net Company Profile |
SEC |
Zacks Reports |
StockTalk |
News |
Chart |
Request a new note
C
A N
S L
I M
|
Symbol/Exchange
Company Name
Industry Group |
PRICE |
CHANGE
(%Change) |
Day High |
Volume
(% DAV)
(% 50 day avg vol) |
52 Wk Hi
% From Hi |
Featured
Date |
Price
Featured |
Pivot Featured |
|
Max Buy |
FFIV
-
NASDAQ
F 5 Networks Inc
INTERNET - Internet Software and Services
|
$89.02
|
+1.36
1.55% |
$89.89
|
1,203,585
70.75% of 50 DAV
50 DAV is 1,701,200
|
$92.70
-3.97%
|
6/16/2010
|
$74.50
|
PP = $74.10
|
|
MB = $77.81
|
Most Recent Note - 8/27/2010 4:44:52 PM
G - Consolidating in an orderly fashion, its 50 DMA and recent low coincide near $80, defining support.
>>> The latest Featured Stock Update with an annotated graph appeared on 8/4/2010. Click here.
View all notes |
Alert me of new notes |
CANSLIM.net Company Profile |
SEC |
Zacks Reports |
StockTalk |
News |
Chart |
Request a new note
C
A N
S L
I M
|
FOSL
-
NASDAQ
Fossil Inc
CONSUMER DURABLES - Recreational Goods, Other
|
$46.01
|
+1.16
2.59% |
$46.30
|
1,064,147
125.77% of 50 DAV
50 DAV is 846,100
|
$46.30
-0.63%
|
8/10/2010
|
$45.54
|
PP = $42.69
|
|
MB = $44.82
|
Most Recent Note - 8/27/2010 4:48:02 PM
G - New high close today as it posted a 6th consecutive gain with volume increasing. Color code is changed to green as it rose above is "max buy" level.
>>> The latest Featured Stock Update with an annotated graph appeared on 8/11/2010. Click here.
View all notes |
Alert me of new notes |
CANSLIM.net Company Profile |
SEC |
Zacks Reports |
StockTalk |
News |
Chart |
Request a new note
C
A N
S L
I M
|
GMCR
-
NASDAQ
Green Mtn Coffee Roastrs
FOOD and BEVERAGE - Processed and Packaged Goods
|
$30.58
|
+0.14
0.46% |
$30.76
|
1,652,666
70.96% of 50 DAV
50 DAV is 2,329,000
|
$33.98
-10.01%
|
8/17/2010
|
$33.62
|
PP = $33.30
|
|
MB = $34.97
|
Most Recent Note - 8/27/2010 4:50:09 PM
G - Small gain today on light volume halted its slide near its 50 DMA line. Possible handle may be forming after the previously noted cup shaped pattern.
>>> The latest Featured Stock Update with an annotated graph appeared on 8/17/2010. Click here.
View all notes |
Alert me of new notes |
CANSLIM.net Company Profile |
SEC |
Zacks Reports |
StockTalk |
News |
Chart |
Request a new note
C
A N
S L
I M
|
HS
-
NYSE
Healthspring Inc
HEALTH SERVICES - Health Care Plans
|
$20.50
|
+2.11
11.47% |
$20.52
|
1,747,027
335.19% of 50 DAV
50 DAV is 521,200
|
$20.50
0.00%
|
8/27/2010
|
$19.91
|
PP = $19.75
|
|
MB = $20.74
|
Most Recent Note - 8/27/2010 5:56:53 PM
Y - Gapped up today after announcing news that it will acquire Bravo Health for $545 million, rallying from a short flat base. After featured in the mid-day report (read here) it went on to close strong and hit a new 52-week high with more than 3 times average volume behind its gain. It found support above its 50 and 200 DMA lines during its light volume pullback following an earlier (7/29/10) breakout. The M criteria remains a concern until a follow-through day emerges. Quarterly and annual earnings comparisons have showed strong +25%. or greater increases (good C and A criteria) history.
>>> The latest Featured Stock Update with an annotated graph appeared on 8/27/2010. Click here.
View all notes |
Alert me of new notes |
CANSLIM.net Company Profile |
SEC |
Zacks Reports |
StockTalk |
News |
Chart |
Request a new note
C
A N
S L
I M
|
MELI
-
NASDAQ
Mercadolibre Inc
INTERNET - Internet Software and; Services
|
$66.38
|
+2.07
3.22% |
$66.54
|
589,988
57.36% of 50 DAV
50 DAV is 1,028,600
|
$70.95
-6.44%
|
5/13/2010
|
$54.21
|
PP = $55.85
|
|
MB = $58.64
|
Most Recent Note - 8/27/2010 6:00:52 PM
G - Rising for a second session with light volume after sinking near prior highs in the $62 area and its 50 DMA line defining chart support. Recently noted - "The pullback may be offering investors a secondary buy point, however weakened market conditions (M criteria) are a concern now arguing against new buying effort until a new follow-through day occurs."
>>> The latest Featured Stock Update with an annotated graph appeared on 8/26/2010. Click here.
View all notes |
Alert me of new notes |
CANSLIM.net Company Profile |
SEC |
Zacks Reports |
StockTalk |
News |
Chart |
Request a new note
C
A N
S L
I M
|
Symbol/Exchange
Company Name
Industry Group |
PRICE |
CHANGE
(%Change) |
Day High |
Volume
(% DAV)
(% 50 day avg vol) |
52 Wk Hi
% From Hi |
Featured
Date |
Price
Featured |
Pivot Featured |
|
Max Buy |
MRX
-
NYSE
Medicis Pharmaceut Cl A
DRUGS - Biotechnology
|
$26.93
|
+0.56
2.12% |
$27.00
|
787,838
70.39% of 50 DAV
50 DAV is 1,119,300
|
$28.15
-4.33%
|
8/12/2010
|
$26.88
|
PP = $26.71
|
|
MB = $28.05
|
Most Recent Note - 8/27/2010 6:01:56 PM
Y - Closed near the session high today with a gain on light volume. The high-ranked Medical - Ethical Drugs firm has been consolidating near prior chart highs.
>>> The latest Featured Stock Update with an annotated graph appeared on 8/12/2010. Click here.
View all notes |
Alert me of new notes |
CANSLIM.net Company Profile |
SEC |
Zacks Reports |
StockTalk |
News |
Chart |
Request a new note
C
A N
S L
I M
|
MWIV
-
NASDAQ
M W I Veterinary Supply
HEALTH SERVICES - Medical Instruments and; Supplies
|
$53.98
|
+0.91
1.71% |
$54.00
|
45,007
57.12% of 50 DAV
50 DAV is 78,800
|
$55.46
-2.67%
|
7/29/2010
|
$52.05
|
PP = $52.09
|
|
MB = $54.69
|
Most Recent Note - 8/27/2010 6:03:21 PM
Y - Quietly perched near its all-time high. Recent lows in the $46 area define an important chart support level.
>>> The latest Featured Stock Update with an annotated graph appeared on 7/30/2010. Click here.
View all notes |
Alert me of new notes |
CANSLIM.net Company Profile |
SEC |
Zacks Reports |
StockTalk |
News |
Chart |
Request a new note
C
A N
S L
I M
|
NEM
-
NYSE
Newmont Mining Corp
METALS and MINING - Gold
|
$59.95
|
+0.51
0.86% |
$60.00
|
6,278,336
81.70% of 50 DAV
50 DAV is 7,684,200
|
$63.38
-5.41%
|
6/22/2010
|
$59.60
|
PP = $59.67
|
|
MB = $62.65
|
Most Recent Note - 8/27/2010 6:05:35 PM
G - Closed at its best level in 6 weeks as a 3rd consecutive gain today with light volume helped it rise further above its 50 DMA line. Leadership in the Mining - Gold/Silver/Gems group (L criteria) is a nice reassurance.
>>> The latest Featured Stock Update with an annotated graph appeared on 8/6/2010. Click here.
View all notes |
Alert me of new notes |
CANSLIM.net Company Profile |
SEC |
Zacks Reports |
StockTalk |
News |
Chart |
Request a new note
C
A N
S L
I M
|
NEOG
-
NASDAQ
Neogen Corp
DRUGS - Diagnostic Substances
|
$29.48
|
+0.83
2.90% |
$29.59
|
88,066
107.01% of 50 DAV
50 DAV is 82,300
|
$30.39
-2.99%
|
7/22/2010
|
$27.19
|
PP = $27.87
|
|
MB = $29.26
|
Most Recent Note - 8/27/2010 6:08:05 PM
Y- Closed -3% off its all time high with a gain on average volume, rallying up from its 50 DMA line and prior highs in the $27 area defining important technical support.
>>> The latest Featured Stock Update with an annotated graph appeared on 8/20/2010. Click here.
View all notes |
Alert me of new notes |
CANSLIM.net Company Profile |
SEC |
Zacks Reports |
StockTalk |
News |
Chart |
Request a new note
C
A N
S L
I M
|
NFLX
-
NASDAQ
Netflix Inc
SPECIALTY RETAIL - Music and Video Stores
|
$126.10
|
+0.26
0.21% |
$127.57
|
3,019,126
68.21% of 50 DAV
50 DAV is 4,426,000
|
$140.90
-10.50%
|
8/10/2010
|
$124.05
|
PP = $124.00
|
|
MB = $130.20
|
Most Recent Note - 8/27/2010 6:09:49 PM
Y- Held its ground this week after pulling back near its prior high of $124 noted as an important support level to watch. Color code is changed to yellow while finding recent support near its pivot point.
>>> The latest Featured Stock Update with an annotated graph appeared on 8/10/2010. Click here.
View all notes |
Alert me of new notes |
CANSLIM.net Company Profile |
SEC |
Zacks Reports |
StockTalk |
News |
Chart |
Request a new note
C
A N
S L
I M
|
Symbol/Exchange
Company Name
Industry Group |
PRICE |
CHANGE
(%Change) |
Day High |
Volume
(% DAV)
(% 50 day avg vol) |
52 Wk Hi
% From Hi |
Featured
Date |
Price
Featured |
Pivot Featured |
|
Max Buy |
PAY
-
NYSE
Verifone Systems Inc
COMPUTER HARDWARE - Transaction Automation Systems
|
$24.52
|
+0.37
1.53% |
$24.61
|
1,016,335
93.19% of 50 DAV
50 DAV is 1,090,600
|
$25.04
-2.06%
|
8/25/2010
|
$24.30
|
PP = $23.74
|
|
MB = $24.93
|
Most Recent Note - 8/27/2010 6:15:40 PM
Y - Holding its ground at its 52-week high after blasting higher on 8/25/10 following better than expected results. For the quarter ended July 31, 2010 its earnings per share rose +38% on +24% sales revenues versus the year ago period. Recent quarters showed strong earnings and sales revenues accelerating after a streak of negative comparisons. As noted in the 8/25/10 mid-day report (read here) when rising from a cup-with-handle base - "Long ago, based on disappointing fundamental news and very weak technical action, it was dropped from the Featured Stocks list on 12/3/2007 as it gapped down for a considerable loss after the company said it would restate its earnings for the past three quarters, with the added warning that revelations of deeper problems may follow. It has rebounded impressively and is now clear of overhead supply after a powerful technical breakout with 6 times average volume, however the M criteria is now arguing against new buying efforts until a new follow-through day occurs from at least one of the major averages."
>>> The latest Featured Stock Update with an annotated graph appeared on 12/18/2008. Click here.
View all notes |
Alert me of new notes |
CANSLIM.net Company Profile |
SEC |
Zacks Reports |
StockTalk |
News |
Chart |
Request a new note
C
A N
S L
I M
|
ROVI
-
NASDAQ
Rovi Corp
COMPUTER SOFTWARE andamp; SERVICES - Security Software andamp; Services
|
$42.56
|
+0.51
1.21% |
$42.67
|
864,069
75.23% of 50 DAV
50 DAV is 1,148,600
|
$44.96
-5.34%
|
6/3/2010
|
$38.70
|
PP = $40.16
|
|
MB = $42.17
|
Most Recent Note - 8/27/2010 6:18:01 PM
G - Building a base-on-base type pattern. Testing support at its 50 DMA line this week, while prior highs in the $40 area define the next chart support.
>>> The latest Featured Stock Update with an annotated graph appeared on 8/24/2010. Click here.
View all notes |
Alert me of new notes |
CANSLIM.net Company Profile |
SEC |
Zacks Reports |
StockTalk |
News |
Chart |
Request a new note
C
A N
S L
I M
|
SHOO
-
NASDAQ
Steven Madden Limited
CONSUMER NON-DURABLES - Textile - Apparel Footwear
|
$35.89
|
+0.84
2.40% |
$35.96
|
246,629
57.45% of 50 DAV
50 DAV is 429,300
|
$40.98
-12.42%
|
8/5/2010
|
$39.55
|
PP = $41.08
|
|
MB = $43.13
|
Most Recent Note - 8/27/2010 6:18:47 PM
G - Consolidating just above its 50 DMA line. The next support is at its 200 DMA line and prior chart lows in the $30 area.
>>> The latest Featured Stock Update with an annotated graph appeared on 8/5/2010. Click here.
View all notes |
Alert me of new notes |
CANSLIM.net Company Profile |
SEC |
Zacks Reports |
StockTalk |
News |
Chart |
Request a new note
C
A N
S L
I M
|
SLW
-
NYSE
Silver Wheaton Corp
METALS and; MINING - Silver
|
$22.80
|
+0.74
3.35% |
$22.83
|
6,848,852
151.45% of 50 DAV
50 DAV is 4,522,200
|
$22.46
1.51%
|
8/25/2010
|
$21.40
|
PP = $21.99
|
|
MB = $23.09
|
Most Recent Note - 8/27/2010 6:19:46 PM
Y - Hit a new all-time high and closed near its session high today. Its gain on 8/26/10 with +69% above average volume helped it trigger a technical buy signal and close above the pivot point cited in the 8/25/10 mid-day report. The M criteria is a concern until a follow-through day emerges. 
>>> The latest Featured Stock Update with an annotated graph appeared on 8/25/2010. Click here.
View all notes |
Alert me of new notes |
CANSLIM.net Company Profile |
SEC |
Zacks Reports |
StockTalk |
News |
Chart |
Request a new note
C
A N
S L
I M
|
VIT
-
NYSE
Vanceinfo Tech Inc Ads
COMPUTER SOFTWARE and SERVICES - Business Software and Services
|
$28.55
|
+1.11
4.05% |
$28.68
|
818,730
149.76% of 50 DAV
50 DAV is 546,700
|
$28.12
1.53%
|
7/8/2010
|
$25.20
|
PP = $26.58
|
|
MB = $27.91
|
Most Recent Note - 8/27/2010 6:21:51 PM
G - Gain today with +50% above average volume helped it rally to a new all-time high and close above its "max buy" level. Color code is changed to green. No resistance is remaining due to overhead supply.
>>> The latest Featured Stock Update with an annotated graph appeared on 7/26/2010. Click here.
View all notes |
Alert me of new notes |
CANSLIM.net Company Profile |
SEC |
Zacks Reports |
StockTalk |
News |
Chart |
Request a new note
C
A N
S L
I M
|
Symbol/Exchange
Company Name
Industry Group |
PRICE |
CHANGE
(%Change) |
Day High |
Volume
(% DAV)
(% 50 day avg vol) |
52 Wk Hi
% From Hi |
Featured
Date |
Price
Featured |
Pivot Featured |
|
Max Buy |
WCRX
-
NASDAQ
Warner Chilcott Plc
DRUGS - Drug Manufacturers - Other
|
$28.58
|
+0.36
1.28% |
$28.89
|
5,727,145
356.92% of 50 DAV
50 DAV is 1,604,600
|
$30.57
-6.51%
|
8/23/2010
|
$29.54
|
PP = $29.34
|
|
MB = $30.81
|
Most Recent Note - 8/27/2010 6:24:02 PM
Y - Posted a gain today with heavy volume, yet it ended the session still below its pivot point after 2 prior losses on lighter volume. It was featured in yellow in the mid-day report on 8/23/10 (read here), rising from a cup shaped base.
>>> The latest Featured Stock Update with an annotated graph appeared on 8/23/2010. Click here.
View all notes |
Alert me of new notes |
CANSLIM.net Company Profile |
SEC |
Zacks Reports |
StockTalk |
News |
Chart |
Request a new note
C
A N
S L
I M
|
|
|
|
THESE ARE NOT BUY RECOMMENDATIONS!
Comments contained in the body of this report are technical
opinions only. The material herein has been obtained
from sources believed to be reliable and accurate, however,
its accuracy and completeness cannot be guaranteed.
This site is not an investment advisor, hence it does
not endorse or recommend any securities or other investments.
Any recommendation contained in this report may not
be suitable for all investors and it is not to be deemed
an offer or solicitation on our part with respect to
the purchase or sale of any securities. All trademarks,
service marks and trade names appearing in this report
are the property of their respective owners, and are
likewise used for identification purposes only.
This report is a service available
only to active Paid Premium Members.
You may opt-out of receiving report notifications
at any time. Questions or comments may be submitted
by writing to Premium Membership Services 665 S.E. 10 Street, Suite 201 Deerfield Beach, FL 33441-5634 or by calling 1-800-965-8307
or 954-785-1121.
|
|
|


