***Last / Change / Volume data in this table is the closing quote data***
Symbol/Exchange
Company Name
Industry Group |
PRICE |
CHANGE
(%Change) |
Day High |
Volume
(% DAV)
(% 50 day avg vol) |
52 Wk Hi
% From Hi |
Featured
Date |
Price
Featured |
Pivot Featured |
|
Max Buy |
ABV
-
NYSE
Comp De Bebidas Adr
FOOD and BEVERAGE - Beverages - Brewers
|
$106.61
|
-0.66
-0.62% |
$108.04
|
508,540
77.04% of 50 DAV
50 DAV is 660,100
|
$112.60
-5.32%
|
6/29/2010
|
$104.74
|
PP = $109.33
|
|
MB = $114.80
|
Most Recent Note - 8/23/2010 12:32:25 PM
G - This Brazil-based beverage firm is perched near its all-time high. Color code was changed to green despite its recent resilience, as fundamental concerns were raised as for the quarter ended June 30, 2010 it reported +19% earnings on +16% sales revenues, below the +25% guidelines.
>>> The latest Featured Stock Update with an annotated graph appeared on 8/18/2010. Click here.
View all notes |
Alert me of new notes |
CANSLIM.net Company Profile |
SEC |
Zacks Reports |
StockTalk |
News |
Chart |
Request a new note
C
A N
S L
I M


|
BIDU
-
NASDAQ
Baidu Inc Ads
INTERNET - Internet Information Providers
|
$76.60
|
-1.70
-2.17% |
$79.43
|
6,330,174
56.73% of 50 DAV
50 DAV is 11,159,400
|
$88.32
-13.27%
|
7/14/2010
|
$75.03
|
PP = $78.59
|
|
MB = $82.52
|
 Most Recent Note - 8/26/2010 6:20:35 PM
G - Loss today on below average volume, yet slumping under prior highs and its 50 DMA line, raising concerns.
>>> The latest Featured Stock Update with an annotated graph appeared on 8/13/2010. Click here.
View all notes |
Alert me of new notes |
CANSLIM.net Company Profile |
SEC |
Zacks Reports |
StockTalk |
News |
Chart |
Request a new note
C
A N
S L
I M
|
CACC
-
NASDAQ
Credit Acceptance Corp
FINANCIAL SERVICES - Credit Services
|
$59.03
|
-0.36
-0.61% |
$59.74
|
14,584
26.96% of 50 DAV
50 DAV is 54,100
|
$61.41
-3.88%
|
7/29/2010
|
$52.04
|
PP = $54.07
|
|
MB = $56.77
|
Most Recent Note - 8/24/2010 7:23:32 PM
G - Rebounded and closed in the upper half of its intra-day range again today. Extended from its prior base, previous resistance near $54 defines initial chart support to watch.
>>> The latest Featured Stock Update with an annotated graph appeared on 8/2/2010. Click here.
View all notes |
Alert me of new notes |
CANSLIM.net Company Profile |
SEC |
Zacks Reports |
StockTalk |
News |
Chart |
Request a new note
C
A N
S L
I M
|
CRM
-
NYSE
Salesforce.Com Inc
INTERNET - Internet Software and Services
|
$109.84
|
-2.35
-2.09% |
$113.22
|
3,396,707
134.03% of 50 DAV
50 DAV is 2,534,200
|
$114.15
-3.78%
|
6/2/2010
|
$88.44
|
PP = $89.60
|
|
MB = $94.08
|
Most Recent Note - 8/26/2010 12:30:07 PM
G - It is extended from any sound base, still holding its ground stubbornly since gapping up on 8/20/10 for a considerable gain and new all-time high.
>>> The latest Featured Stock Update with an annotated graph appeared on 8/16/2010. Click here.
View all notes |
Alert me of new notes |
CANSLIM.net Company Profile |
SEC |
Zacks Reports |
StockTalk |
News |
Chart |
Request a new note
C
A N
S L
I M
|
EGO
-
NYSE
Eldorado Gold Corp
METALS and MINING - Gold
|
$19.22
|
+0.24
1.26% |
$19.48
|
6,834,002
164.79% of 50 DAV
50 DAV is 4,147,100
|
$19.07
0.79%
|
8/19/2010
|
$18.25
|
PP = $19.17
|
|
MB = $20.13
|
Most Recent Note - 8/26/2010 12:32:37 PM
Y - Gapped up today and rallied above its pivot point after a solid gain with +48% above average volume on the prior session for this Canada-based mining firm. EGO was featured in the 8/19/10 mid-day report with a pivot point based on its 52-week high plus ten cents.
>>> The latest Featured Stock Update with an annotated graph appeared on 8/19/2010. Click here.
View all notes |
Alert me of new notes |
CANSLIM.net Company Profile |
SEC |
Zacks Reports |
StockTalk |
News |
Chart |
Request a new note
C
A N
S L
I M
|
Symbol/Exchange
Company Name
Industry Group |
PRICE |
CHANGE
(%Change) |
Day High |
Volume
(% DAV)
(% 50 day avg vol) |
52 Wk Hi
% From Hi |
Featured
Date |
Price
Featured |
Pivot Featured |
|
Max Buy |
FFIV
-
NASDAQ
F 5 Networks Inc
INTERNET - Internet Software and Services
|
$87.66
|
+0.77
0.89% |
$89.51
|
1,217,029
71.54% of 50 DAV
50 DAV is 1,701,200
|
$92.70
-5.44%
|
6/16/2010
|
$74.50
|
PP = $74.10
|
|
MB = $77.81
|
Most Recent Note - 8/25/2010 5:39:58 PM
G - After a small gap down today it managed a positive reversal. Recently noted as -"extended from any sound base after recent volume-driven gains, it could go on to produce more climactic gains."
>>> The latest Featured Stock Update with an annotated graph appeared on 8/4/2010. Click here.
View all notes |
Alert me of new notes |
CANSLIM.net Company Profile |
SEC |
Zacks Reports |
StockTalk |
News |
Chart |
Request a new note
C
A N
S L
I M
|
FOSL
-
NASDAQ
Fossil Inc
CONSUMER DURABLES - Recreational Goods, Other
|
$44.85
|
+0.14
0.31% |
$45.10
|
845,446
99.92% of 50 DAV
50 DAV is 846,100
|
$46.30
-3.13%
|
8/10/2010
|
$45.54
|
PP = $42.69
|
|
MB = $44.82
|
Most Recent Note - 8/24/2010 7:27:20 PM
Y - Holding its ground in a very tight trading range since its considerable "breakaway gap" on 8/10/10 for a new 52-week high and all-time high.
>>> The latest Featured Stock Update with an annotated graph appeared on 8/11/2010. Click here.
View all notes |
Alert me of new notes |
CANSLIM.net Company Profile |
SEC |
Zacks Reports |
StockTalk |
News |
Chart |
Request a new note
C
A N
S L
I M
|
GMCR
-
NASDAQ
Green Mtn Coffee Roastrs
FOOD and BEVERAGE - Processed and Packaged Goods
|
$30.44
|
-0.67
-2.15% |
$31.20
|
2,408,227
103.40% of 50 DAV
50 DAV is 2,329,000
|
$33.98
-10.42%
|
8/17/2010
|
$33.62
|
PP = $33.30
|
|
MB = $34.97
|
Most Recent Note - 8/26/2010 6:25:46 PM
G - Down again on average volume today, pulling back near its 50 DMA line, forming a possible "handle" after the previously noted cup shaped pattern.
>>> The latest Featured Stock Update with an annotated graph appeared on 8/17/2010. Click here.
View all notes |
Alert me of new notes |
CANSLIM.net Company Profile |
SEC |
Zacks Reports |
StockTalk |
News |
Chart |
Request a new note
C
A N
S L
I M
|
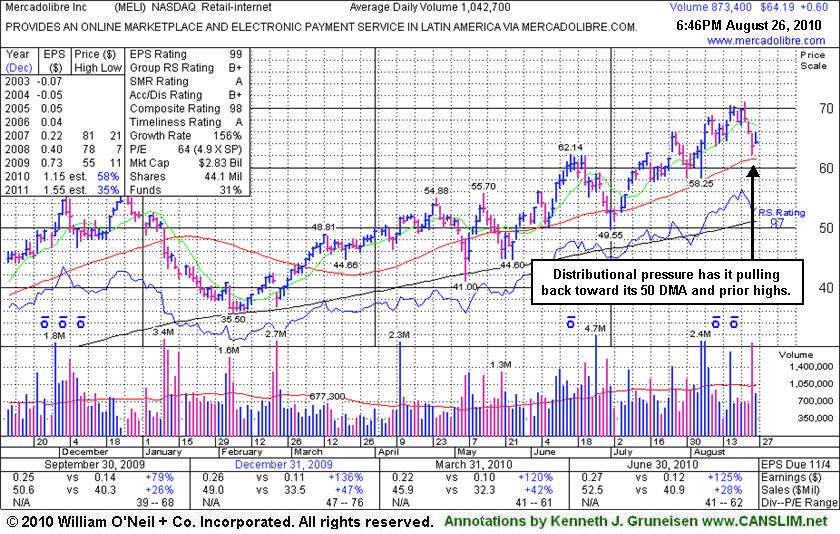
MELI
-
NASDAQ
Mercadolibre Inc
INTERNET - Internet Software and; Services
|
$64.31
|
+0.72
1.13% |
$65.76
|
884,740
86.01% of 50 DAV
50 DAV is 1,028,600
|
$70.95
-9.36%
|
5/13/2010
|
$54.21
|
PP = $55.85
|
|
MB = $58.64
|
Most Recent Note - 8/25/2010 2:17:11 PM
G - Considerable loss today with above average volume, sinking near prior highs in the $62 area and its 50 DMA line defining chart support. The pullback may be offering investors a secondary buy point, however weakened market conditions (M criteria) are a concern now arguing against new buying effort until a new follow-through day occurs.
>>> The latest Featured Stock Update with an annotated graph appeared on 8/26/2010. Click here.
View all notes |
Alert me of new notes |
CANSLIM.net Company Profile |
SEC |
Zacks Reports |
StockTalk |
News |
Chart |
Request a new note
C
A N
S L
I M
|
MRX
-
NYSE
Medicis Pharmaceut Cl A
DRUGS - Biotechnology
|
$26.37
|
-0.13
-0.49% |
$26.86
|
986,769
88.16% of 50 DAV
50 DAV is 1,119,300
|
$28.15
-6.32%
|
8/12/2010
|
$26.88
|
PP = $26.71
|
|
MB = $28.05
|
Most Recent Note - 8/25/2010 6:02:46 PM
Y - Small gain today with above average volume. The high-ranked Medical - Ethical Drugs firm is consolidating near prior chart highs.
>>> The latest Featured Stock Update with an annotated graph appeared on 8/12/2010. Click here.
View all notes |
Alert me of new notes |
CANSLIM.net Company Profile |
SEC |
Zacks Reports |
StockTalk |
News |
Chart |
Request a new note
C
A N
S L
I M
|
Symbol/Exchange
Company Name
Industry Group |
PRICE |
CHANGE
(%Change) |
Day High |
Volume
(% DAV)
(% 50 day avg vol) |
52 Wk Hi
% From Hi |
Featured
Date |
Price
Featured |
Pivot Featured |
|
Max Buy |
MWIV
-
NASDAQ
M W I Veterinary Supply
HEALTH SERVICES - Medical Instruments and; Supplies
|
$53.07
|
-1.31
-2.41% |
$55.08
|
84,766
107.57% of 50 DAV
50 DAV is 78,800
|
$55.46
-4.31%
|
7/29/2010
|
$52.05
|
PP = $52.09
|
|
MB = $54.69
|
Most Recent Note - 8/26/2010 6:28:26 PM
Y - Reversed from its all-time high and closed near today's session low. Recent lows in the $46 area define an important chart support level.
>>> The latest Featured Stock Update with an annotated graph appeared on 7/30/2010. Click here.
View all notes |
Alert me of new notes |
CANSLIM.net Company Profile |
SEC |
Zacks Reports |
StockTalk |
News |
Chart |
Request a new note
C
A N
S L
I M
|
NEM
-
NYSE
Newmont Mining Corp
METALS and MINING - Gold
|
$59.44
|
+0.70
1.19% |
$59.63
|
5,589,342
72.74% of 50 DAV
50 DAV is 7,684,200
|
$63.38
-6.22%
|
6/22/2010
|
$59.60
|
PP = $59.67
|
|
MB = $62.65
|
Most Recent Note - 8/25/2010 5:59:09 PM
G - Gain today with near average volume helped it rally to close just above its 50 DMA line again. Leadership in the Mining - Gold/Silver/Gems group (L criteria) is a nice reassurance.
>>> The latest Featured Stock Update with an annotated graph appeared on 8/6/2010. Click here.
View all notes |
Alert me of new notes |
CANSLIM.net Company Profile |
SEC |
Zacks Reports |
StockTalk |
News |
Chart |
Request a new note
C
A N
S L
I M
|
NEOG
-
NASDAQ
Neogen Corp
DRUGS - Diagnostic Substances
|
$28.65
|
-0.33
-1.14% |
$29.07
|
59,289
72.04% of 50 DAV
50 DAV is 82,300
|
$30.39
-5.73%
|
7/22/2010
|
$27.19
|
PP = $27.87
|
|
MB = $29.26
|
Most Recent Note - 8/25/2010 5:09:49 PM
Y- Solid gain today and strong close near session high on average volume, rallying up from its 50 DMA line and prior highs in the $27 area defining important technical support.
>>> The latest Featured Stock Update with an annotated graph appeared on 8/20/2010. Click here.
View all notes |
Alert me of new notes |
CANSLIM.net Company Profile |
SEC |
Zacks Reports |
StockTalk |
News |
Chart |
Request a new note
C
A N
S L
I M
|
NFLX
-
NASDAQ
Netflix Inc
SPECIALTY RETAIL - Music and Video Stores
|
$125.84
|
+1.59
1.28% |
$127.71
|
4,071,224
91.98% of 50 DAV
50 DAV is 4,426,000
|
$140.90
-10.69%
|
8/10/2010
|
$124.05
|
PP = $124.00
|
|
MB = $130.20
|
Most Recent Note - 8/25/2010 5:12:36 PM
G- Small gain today on light volume, bouncing back near its prior high of $124 noted as an important support level to watch. Color code was changed to green based on recent distributional action and its slump below its pivot point.
>>> The latest Featured Stock Update with an annotated graph appeared on 8/10/2010. Click here.
View all notes |
Alert me of new notes |
CANSLIM.net Company Profile |
SEC |
Zacks Reports |
StockTalk |
News |
Chart |
Request a new note
C
A N
S L
I M
|
PAY
-
NYSE
Verifone Systems Inc
COMPUTER HARDWARE - Transaction Automation Systems
|
$24.15
|
-0.17
-0.70% |
$24.73
|
2,178,511
199.75% of 50 DAV
50 DAV is 1,090,600
|
$25.04
-3.54%
|
8/25/2010
|
$24.30
|
PP = $23.74
|
|
MB = $24.93
|
Most Recent Note - 8/26/2010 12:45:59 PM
Y - Pulling back to today after a gap up gain for a new 52-week high on the prior session following better than expected results. For the quarter ended July 31, 2010 its earnings per share rose +38% on +24% sales revenues versus the year ago period. Recent quarters showed strong earnings and sales revenues accelerating after a streak of negative comparisons. As noted in the 8/25/10 mid-day report (read here) when rising from a cup-with-handle base - "Long ago, based on disappointing fundamental news and very weak technical action, it was dropped from the Featured Stocks list on 12/3/2007 as it gapped down for a considerable loss after the company said it would restate its earnings for the past three quarters, with the added warning that revelations of deeper problems may follow. It has rebounded impressively and is now clear of overhead supply after a powerful technical breakout with 6 times average volume, however the M criteria is now arguing against new buying efforts until a new follow-through day occurs from at least one of the major averages."
>>> The latest Featured Stock Update with an annotated graph appeared on 12/18/2008. Click here.
View all notes |
Alert me of new notes |
CANSLIM.net Company Profile |
SEC |
Zacks Reports |
StockTalk |
News |
Chart |
Request a new note
C
A N
S L
I M
|
Symbol/Exchange
Company Name
Industry Group |
PRICE |
CHANGE
(%Change) |
Day High |
Volume
(% DAV)
(% 50 day avg vol) |
52 Wk Hi
% From Hi |
Featured
Date |
Price
Featured |
Pivot Featured |
|
Max Buy |
ROVI
-
NASDAQ
Rovi Corp
COMPUTER SOFTWARE andamp; SERVICES - Security Software andamp; Services
|
$42.05
|
-0.19
-0.45% |
$42.66
|
457,790
39.86% of 50 DAV
50 DAV is 1,148,600
|
$44.96
-6.47%
|
6/3/2010
|
$38.70
|
PP = $40.16
|
|
MB = $42.17
|
Most Recent Note - 8/25/2010 5:21:34 PM
G - Positively reversed today and closed near the session high with a gain on light volume after initially gapping down under its 50 DMA line following the prior session's damaging loss with nearly 2 times average volume. Prior highs in the $40 area and its 50 DMA line define chart support.
>>> The latest Featured Stock Update with an annotated graph appeared on 8/24/2010. Click here.
View all notes |
Alert me of new notes |
CANSLIM.net Company Profile |
SEC |
Zacks Reports |
StockTalk |
News |
Chart |
Request a new note
C
A N
S L
I M
|
SHOO
-
NASDAQ
Steven Madden Limited
CONSUMER NON-DURABLES - Textile - Apparel Footwear
|
$35.05
|
-0.45
-1.27% |
$35.73
|
310,133
72.24% of 50 DAV
50 DAV is 429,300
|
$40.98
-14.47%
|
8/5/2010
|
$39.55
|
PP = $41.08
|
|
MB = $43.13
|
Most Recent Note - 8/25/2010 5:44:38 PM
G - Posted a gain today on lighter volume to close just above its 50 DMA line. The next support is at its 200 DMA line and prior chart lows in the $30 area.
>>> The latest Featured Stock Update with an annotated graph appeared on 8/5/2010. Click here.
View all notes |
Alert me of new notes |
CANSLIM.net Company Profile |
SEC |
Zacks Reports |
StockTalk |
News |
Chart |
Request a new note
C
A N
S L
I M
|
SLW
-
NYSE
Silver Wheaton Corp
METALS and; MINING - Silver
|
$22.06
|
+0.57
2.65% |
$22.46
|
7,654,252
169.26% of 50 DAV
50 DAV is 4,522,200
|
$21.89
0.78%
|
8/25/2010
|
$21.40
|
PP = $21.99
|
|
MB = $23.09
|
Most Recent Note - 8/26/2010 1:01:47 PM
Y - Gapped up today, rallying to a new all-time high above the pivot point cited in the 8/25/10 mid-day report. Detailed analysis was included in the Featured Stock Update section of yesterday's After Market Update. It was noted - "No overhead supply remains to hinder its upward progress, yet the $21 area has been a stubborn resistance level. This Canada-based firm in the Mining - Gold/Silver/Gems industry had a downward turn in FY '08 earnings (A criteria has been noted as a concern). Current leadership in the group (L criteria) is helping most firms in the group show strength. Its 3 latest quarterly comparisons showed solid sales and earnings increases (good criteria) after 4 prior reports with negative comparisons versus the year ago period." 
>>> The latest Featured Stock Update with an annotated graph appeared on 8/25/2010. Click here.
View all notes |
Alert me of new notes |
CANSLIM.net Company Profile |
SEC |
Zacks Reports |
StockTalk |
News |
Chart |
Request a new note
C
A N
S L
I M
|
VIT
-
NYSE
Vanceinfo Tech Inc Ads
COMPUTER SOFTWARE and SERVICES - Business Software and Services
|
$27.44
|
+0.69
2.58% |
$27.61
|
479,249
87.66% of 50 DAV
50 DAV is 546,700
|
$28.12
-2.42%
|
7/8/2010
|
$25.20
|
PP = $26.58
|
|
MB = $27.91
|
Most Recent Note - 8/26/2010 6:31:05 PM
Y - Gain today on light volume time after enduring recent distributional pressure. Still perched near all-time highs with no resistance remaining due to overhead supply. Found support near its 50 DMA line last week after enduring distributional pressure.
>>> The latest Featured Stock Update with an annotated graph appeared on 7/26/2010. Click here.
View all notes |
Alert me of new notes |
CANSLIM.net Company Profile |
SEC |
Zacks Reports |
StockTalk |
News |
Chart |
Request a new note
C
A N
S L
I M
|
WCRX
-
NASDAQ
Warner Chilcott Plc
DRUGS - Drug Manufacturers - Other
|
$28.22
|
-0.38
-1.33% |
$28.96
|
1,670,791
104.13% of 50 DAV
50 DAV is 1,604,600
|
$30.57
-7.69%
|
8/23/2010
|
$29.54
|
PP = $29.34
|
|
MB = $30.81
|
Most Recent Note - 8/25/2010 5:55:27 PM
Y - Loss today with above average volume led to a close below its pivot point. It was featured in yellow in the mid-day report on 8/23/10 (read here), rising from a cup shaped base formed since it was noted in the 5/06/10 mid-day report - "Earnings and sales revenues history has been below guidelines of the fact-based system, yet showed drastic increases in the quarter ended Dec 31, 2009. It encountered stubborn resistance in the $29 area since the high-ranked firm hailing from the Medical - Ethical Drugs industry was noted in a handful of Q4 2009 mid-day reports after announcing plans to buy Procter & Gamble Co's prescription drug business in a deal first announced 8/24/09." (Correction notice: Dec '10 references in prior notes should have been Dec '09)
>>> The latest Featured Stock Update with an annotated graph appeared on 8/23/2010. Click here.
View all notes |
Alert me of new notes |
CANSLIM.net Company Profile |
SEC |
Zacks Reports |
StockTalk |
News |
Chart |
Request a new note
C
A N
S L
I M
|
Symbol/Exchange
Company Name
Industry Group |
PRICE |
CHANGE
(%Change) |
Day High |
Volume
(% DAV)
(% 50 day avg vol) |
52 Wk Hi
% From Hi |
Featured
Date |
Price
Featured |
Pivot Featured |
|
Max Buy |