You are not logged in.
This means you
CAN ONLY VIEW reports that were published prior to Monday, April 14, 2025.
You
MUST UPGRADE YOUR MEMBERSHIP if you want to see any current reports.
AFTER MARKET UPDATE - WEDNESDAY, AUGUST 26TH, 2009
Previous After Market Report Next After Market Report >>>
|
|
|
|
DOW |
+4.23 |
9,543.52 |
+0.04% |
|
Volume |
1,052,065,130 |
-8% |
|
Volume |
2,094,705,080 |
+5% |
|
NASDAQ |
+0.20 |
2,024.43 |
+0.01% |
|
Advancers |
1,433 |
46% |
|
Advancers |
1,417 |
50% |
|
S&P 500 |
+0.12 |
1,028.12 |
+0.01% |
|
Decliners |
1,557 |
50% |
|
Decliners |
1,280 |
45% |
|
Russell 2000 |
+0.80 |
584.02 |
+0.14% |
|
52 Wk Highs |
91 |
|
|
52 Wk Highs |
60 |
|
|
S&P 600 |
-0.18 |
308.29 |
-0.06% |
|
52 Wk Lows |
2 |
|
|
52 Wk Lows |
7 |
|
|
 |
Session Marked By Fewer New Highs and an Even Mix of Advancers/Decliners
Adam Sarhan, Contributing Writer,
The major averages ended modestly higher and continued the week's trading in an unusually tight range. Decliners led advancers narrowly on the NYSE, yet advancers narrowly outnumbered decliners on the Nasdaq exchange. Volume totals were reported mixed, lower on the NYSE and higher on the Nasdaq versus the prior session. There were 23 high-ranked companies from the CANSLIM.net Leaders List that made a new 52-week high and appeared on the CANSLIM.net BreakOuts Page, lower than the 31 issues that appeared on the prior session. New 52-week highs solidly outnumbered new 52-week lows on both exchanges while new lows were in the single digits again.
Before Wednesday's opening bell the government reported that durable goods rose +4.9% last month but the core component which strips out the highly volatile non-defense component (mainly transportation), slid -0.3%. The smaller than expected rise in core orders left many investors questioning the underlying health of the economy. Even a stronger than expected housing report failed to offset this concern. The Commerce Department said that new home sales jumped +9.6% in July which was the largest gain in four years to an annual rate of +433,000. The stronger than expected housing report reinforces our notion that the bear market in housing is over. This conclusion is made by studying the price/volume action in the housing stocks. Even though technically there action might be impressive one would need to see their fundamentals improve markedly before these stocks meet the guidelines of this powerful investment system.
Leadership is an important component of any healthy and sustained rally, and at this point the list of leading high-ranked stocks is narrow, but they are holding up well. Stocks such as Aeropostale Inc. (ARO -1.44%) triggered a fresh technical buy signal late last week and appeared in yellow in the CANSLIM.net Mid Day Breakouts Report on Friday August 21, 2009 (here) with the following note: "Y - This high-ranked leader in the Retail - Clothing/shoe group gapped up and hit a new all-time high today, rising from a flat base pattern. It has a good annual earnings history (the A criteria), and the 2 latest quarterly comparisons showed +81% and +84% earnings increases, well above the investment system's +25% guideline." At the time the stock was trading between its $38.84 pivot point and $40.78 max buy price, which is the ideal time to accumulate a position under the guidelines of the investment system. Other leading stocks are acting well as they quietly pause to consolidate their recent moves above their respective moving averages or near prior chart highs. Remember there is no reason to force a trade, instead remain patient and wait for an expansion in leadership before accumulating any new positions or adding to current winners. PICTURED: The Nasdaq Composite Index has been closing in a very tight range all week.
|
|
|
 |
Tech Sector Serves Up Best Gains
Kenneth J. Gruneisen - Passed the CAN SLIM® Master's Exam
The Biotechnology Index ($BTK +3.13%) posted a standout gain while the Semiconductor Index ($SOX +0.82%) and Networking Index ($NWX +1.06%) rose modestly and the Internet Index ($IIX -0.06%) lagged the other tech sector indices. The Retail Index ($RLX +0.69%) tacked on a small gain, meanwhile the influential financial group was quiet as the Broker/Dealer Index ($XBD -0.18%) and Bank Index ($BKX -0.13%) edged lower. Defensive areas were no safe haven as the Gold & Silver Index ($XAU -1.27%) and Healthcare Index ($HMO -0.83%) lost ground. The Integrated Oil Index ($XOI +0.65%) posted a small gain while the Oil Services Index ($OSX -0.07%) ended essentially flat.
Charts courtesy www.stockcharts.com
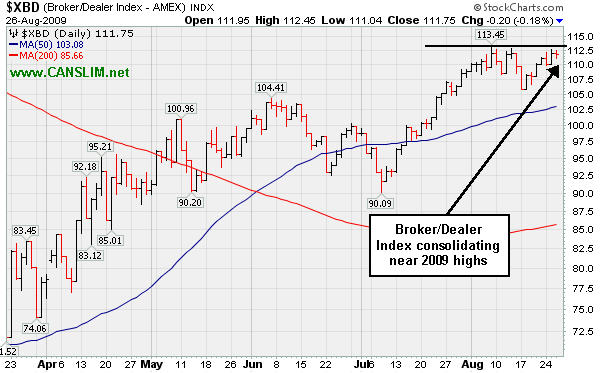
PICTURED: The Broker/Dealer Index is consolidating just shy of its 2009 highs.
| Oil Services |
$OSX |
178.23 |
-0.13 |
-0.07% |
+46.82% |
| Healthcare |
$HMO |
1,224.37 |
-10.26 |
-0.83% |
+27.51% |
| Integrated Oil |
$XOI |
994.98 |
+6.46 |
+0.65% |
+1.56% |
| Semiconductor |
$SOX |
302.99 |
+2.46 |
+0.82% |
+42.81% |
| Networking |
$NWX |
214.24 |
+2.24 |
+1.06% |
+48.89% |
| Internet |
$IIX |
204.38 |
-0.13 |
-0.06% |
+52.78% |
| Broker/Dealer |
$XBD |
111.75 |
-0.20 |
-0.18% |
+44.25% |
| Retail |
$RLX |
369.63 |
+2.54 |
+0.69% |
+32.36% |
| Gold & Silver |
$XAU |
145.07 |
-1.87 |
-1.27% |
+17.13% |
| Bank |
$BKX |
46.59 |
-0.06 |
-0.13% |
+5.12% |
| Biotech |
$BTK |
937.35 |
+28.47 |
+3.13% |
+44.84% |
|
|
|
 |
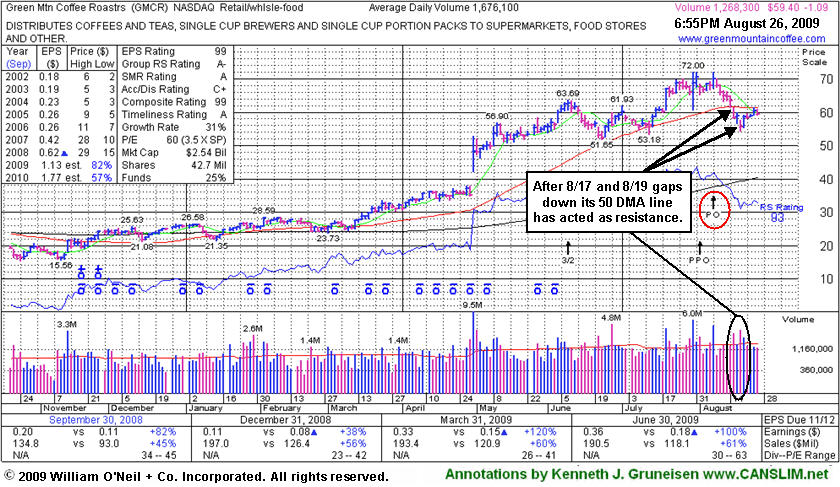
Coffee Stock Cooling Off Since Share Offering Recently Completed
Kenneth J. Gruneisen - Passed the CAN SLIM® Master's Exam
Green Mountain Coffee Roasters (GMCR -1.09 or -1.84% to $59.40) has been cooling off, and its outlook is increasingly questionable the longer it stays trading under its 50-day moving average (DMA) line which is now downward sloping and a source of near-term technical resistance. The next support is at prior chart lows in the $54-53 area, where violations would trigger additional sell signals and raise more serious concerns. As previously noted, "its gap down and considerable loss on 8/17/09 on heavy volume triggered technical sell signals." Sell signals were noted since the stock's last appearance in this section under the headline "Increase In Share Supply May Be A Hindrance" on 8/14/2009 when it was observed that, "Strong leaders tend to keep on leading, however those who are watching for early sell signals should look out for a violation of the multi-month upward trendline, any subsequent deterioration under prior highs in the $62-63 area, or a violation of its 50-day moving average (DMA) line (now $61.68). If you have 'force fed' your winners over time, accumulating at multiple buy points, always be disciplined about limiting losses by selling any higher priced shares you may have bought if the stock falls more than -7% from the price you paid for them. You might decide to hold shares owned at a lower cost basis, but be prompt to lock in profits whenever clear technical sell signals occur."
Bank of America Merrill Lynch was the "sole" book-running manager of the recent offering, with Canaccord Adams "co-lead manager." ; William Blair & Co, SunTrust Robinson Humphrey, and Janney Montgomery Scott were co-managers (see here). Numerous high-ranked leaders have taken advantage of investment bankers' eagerness to raise capital for publicly traded companies, and it is admirable to see these large financial institutions actually underwriting deals that raise money for those in need other than themselves. Investors have reasons to be a bit cynical and skeptical, especially when companies that are generating record revenue and earnings are "in need" of additional working capital.
Often times, new share offerings can hinder the upward price progress in companies for the near term, and GMCR has been sputtering ever since it completed an offering of 5 million common shares. Do not be confused by the 3:2 stock split effective 6/09/09. That also had the effect of increasing the number of GMCR shares. The supply (the S criteria) of outstanding shares now sits at 42.7 million shares, up from 24.6 million shares at the beginning of the year when it was featured in the January 2009 issue of CANSLIM.net News. That is a +73.5% increase in total shares outstanding! GMCR has traded as much as +176.28% since appearing with an annotated graph under the headline "It May Soon Be Time To Go Green" in the January 2009 CANSLIM.net News (read here).
|
|
|
Color Codes Explained :
Y - Better candidates highlighted by our
staff of experts.
G - Previously featured
in past reports as yellow but may no longer be buyable under the
guidelines.
***Last / Change / Volume quote data in this table corresponds with the timestamp on the note***
Symbol/Exchange
Company Name
Industry Group |
Last |
Chg. |
Vol
% DAV |
Date Featured |
Price Featured |
Latest Pivot Point
Featured |
Status |
| Latest Max Buy Price |
ARO
- NYSE
Aeropostale Inc
RETAIL - Apparel Stores
|
$40.30
|
-0.59
|
3,663,972
120% DAV
3,055,100
|
8/21/2009
(Date
Featured) |
$39.21
(Price
Featured) |
PP = $38.84 |
Y |
| MB = $40.78 |
Most Recent Note - 8/26/2009 6:15:08 PM
Y - Negatively reversed today after hitting a new high. This high-ranked leader in the Retail - Clothing/shoe group gapped up and hit a new all-time high on 8/21/09, rising from a flat base pattern triggering a technical buy signal. It was featured in yellow with new pivot point and max buy levels noted in the 8/21/09 Mid-Day BreakOuts Report (read here). It has a good annual earnings history (the A criteria), and the 2 latest quarterly comparisons showed +81% and +84% earnings increases, well above the investment system's +25% guideline.
>>> The latest Featured Stock Update with an annotated graph appeared on 8/21/2009. click here.
|
|
C
A
S
I |
News |
Chart |
SEC
View all notes Alert
me of new notes
Company
Profile
|
CPLA
- NASDAQ
Capella Education Co
DIVERSIFIED SERVICES - Education and Training Services
|
$64.11
|
-0.98
|
158,506
79% DAV
200,700
|
7/9/2009
(Date
Featured) |
$59.69
(Price
Featured) |
PP = $62.06 |
Y |
| MB = $65.16 |
Most Recent Note - 8/26/2009 6:16:25 PM
Y - Consolidating in a tight range on light volume near its 52-week high and "max buy" level. The Commercial Services-Schools Group has shown some leadership but has low ranks, and CPLA's Relative Strength rank has slumped to 54, under the 80+ guideline. Its small supply of only 13.9 million shares in the float could contribute to greater price volatility in the event of institutional accumulation or distribution. The number of top-rated funds owning an interest rose from 91 in Sept '08, to 137 as of June '09, which is reassuring with respect to the I criteria. It has a very good earnings history that satisfies the C & A criteria, while recent quarters showed steady sales revenues increases in the +17-18% range.
>>> The latest Featured Stock Update with an annotated graph appeared on 8/19/2009. click here.
|
|
C
A
S
I |
News |
Chart |
SEC
View all notes Alert
me of new notes
Company
Profile
|
CRM
- NYSE
Salesforce.com Inc
INTERNET - Internet Software & Services
|
$52.87
|
+0.57
|
1,424,693
75% DAV
1,911,700
|
8/16/2009
(Date
Featured) |
$47.12
(Price
Featured) |
PP = $45.59 |
Y |
| MB = $47.87 |
Most Recent Note - 8/26/2009 6:17:27 PM
Y - Still holding its ground stubbornly since its "breakaway gap" for a considerable gain on 8/21/09 with more than 5 times average volume. The stock's exceptional action was discussed further in the "Ken's Mailbag" Q&A with a member in the 8/21/09 After Market Update (read here). A Stock Bulletin was published with detailed analysis and an annotated graph on 8/16/09 (read here).
>>> The latest Featured Stock Update with an annotated graph appeared on 8/16/2009. click here.
|
|
C
A
S
I |
News |
Chart |
SEC
View all notes Alert
me of new notes
Company
Profile
|
GMCR
- NASDAQ
Green Mtn Coffee Roastrs
FOOD & BEVERAGE - Processed & Packaged Goods
|
$59.40
|
-1.09
|
1,281,575
76% DAV
1,676,100
|
7/17/2009
(Date
Featured) |
$60.15
(Price
Featured) |
PP = $63.79 |
G |
| MB = $66.98 |
Most Recent Note - 8/26/2009 6:19:55 PM
G - Its outlook is increasingly questionable the longer it stays trading under its 50 DMA line which is now downward sloping and a source of technical resistance. The next support is at prior chart lows in the $54-53 area. As previously noted, "its gap down and considerable loss on 8/17/09 on heavy volume triggered technical sell signals." GMCR traded up more than +168% since appearing with an annotated graph under the headline "It May Soon Be Time To Go Green" when featured in the January 2009 CANSLIM.net News (read here).
>>> The latest Featured Stock Update with an annotated graph appeared on 8/26/2009. click here.
|
|
C
A
S
I |
News |
Chart |
SEC
View all notes Alert
me of new notes
Company
Profile
|
LFT
-
|
$26.00
|
-1.71
|
765,286
96% DAV
796,900
|
8/10/2009
(Date
Featured) |
$31.49
(Price
Featured) |
PP = $30.57 |
G |
| MB = $32.10 |
Most Recent Note - 8/26/2009 6:22:25 PM
G - Considerable loss on average volume today led to a violation of its 50 DMA line again after a small gap down. Recently noted "substantial losses on heavy volume indicative of distributional pressure."
>>> The latest Featured Stock Update with an annotated graph appeared on 8/25/2009. click here.
|
|
C
A
S
I |
News |
Chart |
SEC
View all notes Alert
me of new notes
Company
Profile
|
NTES
- NASDAQ
Netease Inc Adr
INTERNET - Internet Information Providers
|
$42.82
|
+0.24
|
1,211,415
52% DAV
2,309,700
|
7/17/2009
(Date
Featured) |
$39.29
(Price
Featured) |
PP = $38.74 |
G |
| MB = $40.68 |
Most Recent Note - 8/26/2009 6:23:38 PM
G - Volume has been drying up while consolidating above support at its 50 DMA line and above prior chart highs in the $38 area. As previously noted, "a 8/13/09 gap down for a considerable loss on nearly 4 times average volume triggered a technical sell signal."
>>> The latest Featured Stock Update with an annotated graph appeared on 8/13/2009. click here.
|
|
C
A
S
I |
News |
Chart |
SEC
View all notes Alert
me of new notes
Company
Profile
|
NVEC
- NASDAQ
N V E Corp
ELECTRONICS - Semiconductor - Specialized
|
$55.32
|
-0.77
|
48,351
50% DAV
96,500
|
8/26/2009
(Date
Featured) |
$55.32
(Price
Featured) |
PP = $57.60 |
Y |
| MB = $60.48 |
Most Recent Note - 8/26/2009 6:28:08 PM
Y - Consolidation continues in close striking range of all-time highs. Basing for nearly 5 weeks above important initial support at its 50 DMA line and prior chart highs. Color code is changed to yellow with new pivot point and max buy prices noted. Quarterly sales revenues in the 6 million dollar range are still rather minuscule, leaving concerns.
>>> The latest Featured Stock Update with an annotated graph appeared on 8/18/2009. click here.
|
|
C
A
S
I |
News |
Chart |
SEC
View all notes Alert
me of new notes
Company
Profile
|
PEGA
- NASDAQ
Pegasystems Inc
COMPUTER SOFTWARE & SERVICES - Business Software & Services
|
$32.79
|
-0.18
|
342,082
96% DAV
354,900
|
7/29/2009
(Date
Featured) |
$27.53
(Price
Featured) |
PP = $27.49 |
G |
| MB = $28.86 |
Most Recent Note - 8/26/2009 6:47:09 PM
G - Paused today, perched near all-time highs. Ended a 6 session winning streak since holding ground above its 50 DMA line, a streak that included a big gap up on 8/24/09 for a considerable gain heavy volume. Color code was changed to green based on its distance above its latest pivot point and max buy level.
>>> The latest Featured Stock Update with an annotated graph appeared on 8/24/2009. click here.
|
|
C
A
S
I |
News |
Chart |
SEC
View all notes Alert
me of new notes
Company
Profile
|
UTA
-
|
$12.00
|
-0.45
|
357,038
64% DAV
559,500
|
7/28/2009
(Date
Featured) |
$12.87
(Price
Featured) |
PP = $12.70 |
G |
| MB = $13.34 |
Most Recent Note - 8/26/2009 6:47:53 PM
G - Volume is drying up while consolidating toward support at its 50 DMA line and prior chart highs. A negative reversal on 8/13/09 for a loss on very heavy volume was noted as a clear sign of worrisome distributional pressure. Strong action prompted it to be featured in yellow with pivot point and max buy levels noted in the 7/28/09 mid-day breakouts report (read here), with additional analysis included in the after market update (read here).
>>> The latest Featured Stock Update with an annotated graph appeared on 8/20/2009. click here.
|
|
C
A
S
I |
News |
Chart |
SEC
View all notes Alert
me of new notes
Company
Profile
|
|
|
|
THESE ARE NOT BUY RECOMMENDATIONS!
Comments contained in the body of this report are technical
opinions only. The material herein has been obtained
from sources believed to be reliable and accurate, however,
its accuracy and completeness cannot be guaranteed.
This site is not an investment advisor, hence it does
not endorse or recommend any securities or other investments.
Any recommendation contained in this report may not
be suitable for all investors and it is not to be deemed
an offer or solicitation on our part with respect to
the purchase or sale of any securities. All trademarks,
service marks and trade names appearing in this report
are the property of their respective owners, and are
likewise used for identification purposes only.
This report is a service available
only to active Paid Premium Members.
You may opt-out of receiving report notifications
at any time. Questions or comments may be submitted
by writing to Premium Membership Services 665 S.E. 10 Street, Suite 201 Deerfield Beach, FL 33441-5634 or by calling 1-800-965-8307
or 954-785-1121.
|
|
|


