You are not logged in.
This means you
CAN ONLY VIEW reports that were published prior to Monday, April 14, 2025.
You
MUST UPGRADE YOUR MEMBERSHIP if you want to see any current reports.
AFTER MARKET UPDATE - MONDAY, AUGUST 25TH, 2014
Previous After Market Report Next After Market Report >>>
|
|
|
|
DOW |
+75.65 |
17,076.87 |
+0.44% |
|
Volume |
482,247,530 |
-5% |
|
Volume |
1,280,932,450 |
+5% |
|
NASDAQ |
+18.80 |
4,557.35 |
+0.41% |
|
Advancers |
1,876 |
59% |
|
Advancers |
1,632 |
57% |
|
S&P 500 |
+9.52 |
1,997.92 |
+0.48% |
|
Decliners |
1,175 |
37% |
|
Decliners |
1,152 |
40% |
|
Russell 2000 |
+4.88 |
1,165.22 |
+0.42% |
|
52 Wk Highs |
170 |
|
|
52 Wk Highs |
111 |
|
|
S&P 600 |
+0.71 |
668.42 |
+0.11% |
|
52 Wk Lows |
20 |
|
|
52 Wk Lows |
27 |
|
|
 |
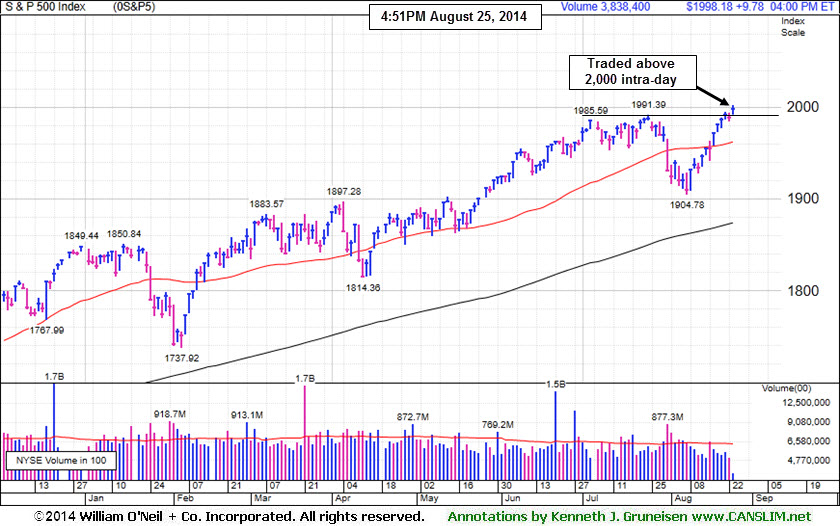
Indices' Gains Helped S&P 500 Index Hit 2,000 Level
Kenneth J. Gruneisen - Passed the CAN SLIM® Master's Exam
The major averages posted unanimous gains on Monday. The volume totals were mixed, lighter on the NYSE and higher on the Nasdaq exchange. Advancers led decliners by a 3-2 margin on the NYSE and on the NASDAQ exchange. There were 68 high-ranked companies from the CANSLIM.net Leaders List that made new 52-week highs and appeared on the CANSLIM.net BreakOuts Page, up considerably from the prior session total of 38 stocks. New 52-week highs swelled and outnumbered new 52-week lows on the NYSE and on the Nasdaq exchange. There were gains for 8 of the 12 of the high-ranked companies currently included on the Featured Stocks Page. The improved action in the broader market (M criteria) has been considered significant enough to shift back to a "confirmed uptrend" while leadership (stocks hitting new 52-week highs) has remained healthy. Remember that disciplined investors buy stocks with superior fundamentals only after they have triggered a proper technical buy signal.
PICTURED: The benchmark S&P 500 Index traded intra-day above 2,000 for the first time while finishing at a new record high.
Stocks rose on Monday. The Dow was up 76 points to 17,076. The NASDAQ Composite climbed 19 points to 4,557.
The major averages gained following a round of M&A news. InterMune (ITMN +35.41%) surged on Roche (RHHBY +0.69%) agreeing to buy the biotech company for $8.3 billion. Burger King Worldwide (BKW +19.51%) after saying it was in talks to acquire Canadian donut shop Tim Hortons Inc (THI +18.91%).
The market advance was also attributed to comments by ECB President Mario Draghi suggesting European policy makers are prepared to provide additional stimulus measures to bolster growth. On the U.S economic front, new home sales unexpectedly fell -2.4% in July versus a projected +5.8% increase. Separate releases revealed service sector activity slowed while manufacturing improved in August.
Financials were the best performing sector on the session. Goldman Sachs (GS +1.37%) rose after reaching a $1.2 billion settlement with the Federal Housing Finance Authority over the sale of mortgage backed securities between 2005 and 2007. Homebuilder D.R. Horton (DHI -1.14%) slipped following the weaker-than-expected new home sales report.
Treasuries were mixed. The 10-year note rose 5/32 to yield 2.38%. In commodity trading, gold slipped -0.1% to $1,278.40 an ounce. West Texas Intermediate crude declined -0.3% to $93.42 a barrel.
The CANSLIM.net Featured Stocks Page shows the most action-worthy candidates and their latest notes and a Headline Link directs members to the latest detailed analysis with data-packed graphs annotated by a Certified expert along with links to additional resources. The Premium Member Homepage includes "dynamic archives" to all prior pay reports published.
|
 Kenneth J. Gruneisen started out as a licensed stockbroker in August 1987, a couple of months prior to the historic stock market crash that took the Dow Jones Industrial Average down -22.6% in a single day. He has published daily fact-based fundamental and technical analysis on high-ranked stocks online for two decades. Through FACTBASEDINVESTING.COM, Kenneth provides educational articles, news, market commentary, and other information regarding proven investment systems that work in good times and bad.
Comments contained in the body of this report are technical opinions only and are not necessarily those of Gruneisen Growth Corp. The material herein has been obtained from sources believed to be reliable and accurate, however, its accuracy and completeness cannot be guaranteed. Our firm, employees, and customers may effect transactions, including transactions contrary to any recommendation herein, or have positions in the securities mentioned herein or options with respect thereto. Any recommendation contained in this report may not be suitable for all investors and it is not to be deemed an offer or solicitation on our part with respect to the purchase or sale of any securities. |
|
 |
Biotech, Retail, Financial, and Energy-Linked Indexes Led Gainers
Kenneth J. Gruneisen - Passed the CAN SLIM® Master's Exam
The Biotechnology Index ($BTK +4.07%) led the tech sector while the Networking Index ($NWX +0.14%) posted a small gain and the Semiconductor Index ($SOX -0.39%) edged lower. The Retail Index ($RLX +0.32%) edged higher and the Broker/Dealer Index ($XBD +1.03%) was also a positive influence as it rose while the Bank Index ($BKX +0.86%) posted a smaller gain. Energy-related shares rose as the Oil Services Index ($OSX +0.98%) and the Integrated Oil Index ($XOI +1.04%) posted solid gains. The Gold & Silver Index ($XAU -1.38%) lost ground and was clearly a laggard on the widely positive session.
Charts courtesy www.stockcharts.com
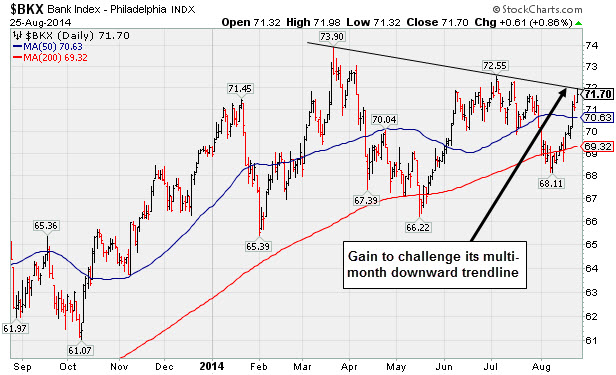
PICTURED: The Bank Index ($BKX +0.86%) posted a gain that helped it challenge a multi-month downward trendline.
| Oil Services |
$OSX |
289.98 |
+2.82 |
+0.98% |
+3.18% |
| Integrated Oil |
$XOI |
1,673.66 |
+17.27 |
+1.04% |
+11.34% |
| Semiconductor |
$SOX |
637.25 |
-2.47 |
-0.39% |
+19.11% |
| Networking |
$NWX |
332.53 |
+0.45 |
+0.14% |
+2.65% |
| Broker/Dealer |
$XBD |
168.37 |
+1.72 |
+1.03% |
+4.86% |
| Retail |
$RLX |
952.01 |
+3.06 |
+0.32% |
+1.30% |
| Gold & Silver |
$XAU |
98.08 |
-1.37 |
-1.38% |
+16.55% |
| Bank |
$BKX |
71.70 |
+0.61 |
+0.86% |
+3.52% |
| Biotech |
$BTK |
3,072.42 |
+120.20 |
+4.07% |
+31.84% |
|
|
|
 |
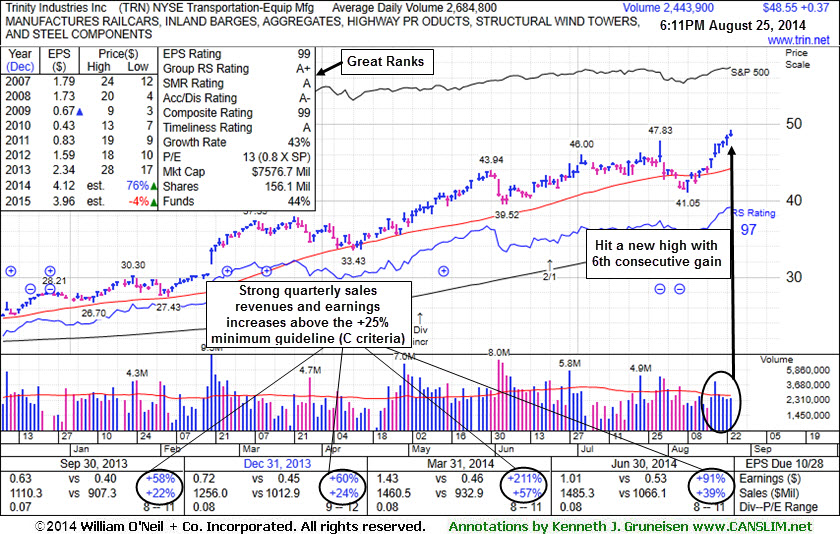
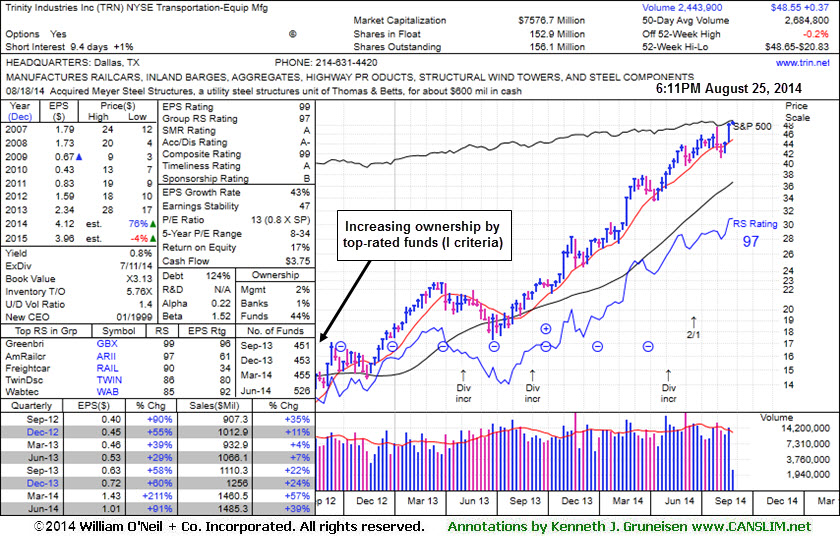
Rallying Into New High Territory Without Forming New Base
Kenneth J. Gruneisen - Passed the CAN SLIM® Master's Exam
Trinity Industries Inc (TRN +$0.37 or +0.77% to $48.55) hit another new 52-week high with today's 6th consecutive gain. It has not formed a sound base. The high-ranked Transportation - Equipment Manufacturing firm was last shown in this FSU section on 7/28/14 with annotated graphs under the headline, "Earnings News Due Following Tuesday's Close". It reported earnings +91% on +39% sales revenues for the Jun '14 quarter, continuing its streak of strong quarterly earnings increases above the +25% minimum earnings guideline (C criteria). Annual earnings (A criteria) have improved following a downturn in FY '08-10.
TRN traded up as much as +30.1% since first highlighted in yellow in the 4/30/14 mid-day report report (read here). Disciplined investors avoid chasing stocks extended more than +5% above prior highs and they always limit losses by selling any stock that falls more than -7% from their purchase price.
Its 50-day moving average (DMA) line ($44.16) defines near-term support to watch. Subsequent deterioration below that important short-term average would raise concerns and trigger technical sell signals.
The number of top-rated funds owning its shares rose from 455 in Sep '13 to 526 in Jun '14, a reassuring sign concerning the I criteria. Its supply of shares outstanding (S criteria) was doubled as a 2:1 split was effective as of 6/20/14.
|
|
|
Color Codes Explained :
Y - Better candidates highlighted by our
staff of experts.
G - Previously featured
in past reports as yellow but may no longer be buyable under the
guidelines.
***Last / Change / Volume data in this table is the closing quote data***
Symbol/Exchange
Company Name
Industry Group |
PRICE |
CHANGE
(%Change) |
Day High |
Volume
(% DAV)
(% 50 day avg vol) |
52 Wk Hi
% From Hi |
Featured
Date |
Price
Featured |
Pivot Featured |
|
Max Buy |
ACT
-
NYSE
Actavis plc
Medical-Generic Drugs
|
$226.61
|
-0.70
-0.31% |
$229.61
|
1,049,413
40.98% of 50 DAV
50 DAV is 2,561,000
|
$230.77
-1.80%
|
6/20/2014
|
$216.53
|
PP = $230.87
|
|
MB = $242.41
|
 Most Recent Note - 8/25/2014 3:28:03 PM
Y - Color code is changed to yellow while no new pivot point has been cited. Perched near its 52-week high today following 9 consecutive gains on light to average volume
>>> FEATURED STOCK ARTICLE : Enduring Distributional Pressure While Sputtering Near 50-Day Average - 8/5/2014
View all notes |
Set NEW NOTE alert |
CANSLIM.net Company Profile |
SEC
News |
Chart |
Request a new note
C
A N
S L
I M


|
AFSI
-
NASDAQ
Amtrust Financial Svcs
INSURANCE - Property and; Casualty Insurance
|
$44.62
|
+0.74
1.69% |
$44.79
|
517,415
107.79% of 50 DAV
50 DAV is 480,000
|
$47.10
-5.27%
|
5/21/2014
|
$44.85
|
PP = $44.85
|
|
MB = $47.09
|
Most Recent Note - 8/22/2014 5:59:19 PM
G - Consolidating above support at its 50 DMA line, still only -6.8% off its 52-week high, however its Relative Strength Rating has slumped to 66, well below the 80+ minimum for buy candidates. Faces resistance due to overhead supply up through the $47 level.
>>> FEATURED STOCK ARTICLE : Relative Strength Rating Slumped While Building Longer Base - 8/18/2014
View all notes |
Set NEW NOTE alert |
CANSLIM.net Company Profile |
SEC
News |
Chart |
Request a new note
C
A N
S L
I M
|
BITA
-
NYSE
Bitauto Hldgs Ltd Ads
Internet-Content
|
$91.06
|
+9.35
11.44% |
$92.00
|
3,770,311
336.33% of 50 DAV
50 DAV is 1,121,000
|
$84.99
7.14%
|
6/26/2014
|
$46.20
|
PP = $47.03
|
|
MB = $49.38
|
Most Recent Note - 8/25/2014 12:03:03 PM
G - Trading up considerably today with a big gain on heavy volume. Has the look of a "climax run" yet it is very extended from its prior base. Its 50 DMA line ($57.47) defines important near-term support to watch on pullbacks.
>>> FEATURED STOCK ARTICLE : Perched at High After 3 Consecutive Volume-Driven Gains - 8/8/2014
View all notes |
Set NEW NOTE alert |
CANSLIM.net Company Profile |
SEC
News |
Chart |
Request a new note
C
A N
S L
I M
|
EQM
-
NYSE
E Q T Midstream Partners
ENERGY - Oil and Gas Pipelines
|
$93.50
|
+1.32
1.43% |
$94.75
|
136,562
40.52% of 50 DAV
50 DAV is 337,000
|
$102.51
-8.79%
|
12/12/2013
|
$53.17
|
PP = $56.51
|
|
MB = $59.34
|
Most Recent Note - 8/25/2014 3:29:15 PM
G - Rebounding above its 50 DMA line today helping its technical stance improve. Reported earnings +37% on +21% sales revenues for the Jun '14 quarter, an improvement after 2 sub par quarterly earnings comparisons.
>>> FEATURED STOCK ARTICLE : Following 50-Day Moving Average Violation Gains Lacked Volume - 8/7/2014
View all notes |
Set NEW NOTE alert |
CANSLIM.net Company Profile |
SEC
News |
Chart |
Request a new note
C
A N
S L
I M
|
FB
-
NASDAQ
Facebook Inc Cl A
INTERNET
|
$75.02
|
+0.45
0.60% |
$75.28
|
19,684,811
50.39% of 50 DAV
50 DAV is 39,062,000
|
$76.74
-2.24%
|
7/24/2014
|
$76.00
|
PP = $72.69
|
|
MB = $76.32
|
Most Recent Note - 8/25/2014 3:30:40 PM
Y - Volume totals have cooled while consolidating in a tight range, stubbornly holding its ground since gapping up on 7/24/14. Prior highs in the $72 area define initial support above its 50 DMA line ($69.93).
>>> FEATURED STOCK ARTICLE : Making Limited Headway But Holding Ground Since Gap Up - 8/20/2014
View all notes |
Set NEW NOTE alert |
CANSLIM.net Company Profile |
SEC
News |
Chart |
Request a new note
C
A N
S L
I M
|
Symbol/Exchange
Company Name
Industry Group |
PRICE |
CHANGE
(%Change) |
Day High |
Volume
(% DAV)
(% 50 day avg vol) |
52 Wk Hi
% From Hi |
Featured
Date |
Price
Featured |
Pivot Featured |
|
Max Buy |
PANW
-
NYSE
Palo Alto Networks
Computer Sftwr-Security
|
$84.57
|
-0.44
-0.52% |
$85.97
|
519,257
37.41% of 50 DAV
50 DAV is 1,388,000
|
$87.79
-3.67%
|
7/30/2014
|
$84.21
|
PP = $85.88
|
|
MB = $90.17
|
Most Recent Note - 8/25/2014 3:35:58 PM
Y - Quietly hovering near its 52-week high, stubbornly holding its ground. Volume should be at least +40% above average behind gains above a stock's pivot point to trigger a proper technical buy signal. Its 50 DMA line ($81.02) defines important near-term support.
>>> FEATURED STOCK ARTICLE : Building on New Base Pattern Above 50-Day Average - 8/11/2014
View all notes |
Set NEW NOTE alert |
CANSLIM.net Company Profile |
SEC
News |
Chart |
Request a new note
C
A N
S L
I M
|
STRT
-
NASDAQ
Strattec Security Corp
AUTOMOTIVE - Auto Parts
|
$75.35
|
+2.10
2.87% |
$78.00
|
24,893
85.84% of 50 DAV
50 DAV is 29,000
|
$77.83
-3.19%
|
8/22/2014
|
$71.47
|
PP = $73.97
|
|
MB = $77.67
|
Most Recent Note - 8/25/2014 3:24:59 PM
Y - Rallied above its pivot point but volume thus far is below average today. Gains should be backed by volume at least +40% above average to trigger a proper technical buy signal. Highlighted in yellow with pivot point based on its 6/06/14 high plus 10 cents in the 8/22/14 mid-day report (read here). See the latest FSU analysis for more details and annotated graphs.
>>> FEATURED STOCK ARTICLE : Small Supply of Shares and Perched Near All-Time Highs - 8/22/2014
View all notes |
Set NEW NOTE alert |
CANSLIM.net Company Profile |
SEC
News |
Chart |
Request a new note
C
A N
S L
I M
|
TARO
-
NYSE
Taro Pharmaceutical Inds
DRUGS - Drug Manufacturers - Other
|
$161.22
|
-0.26
-0.16% |
$164.00
|
71,172
93.65% of 50 DAV
50 DAV is 76,000
|
$161.93
-0.44%
|
7/30/2014
|
$144.24
|
PP = $149.99
|
|
MB = $157.49
|
Most Recent Note - 8/22/2014 5:55:47 PM
G - Rallied for a new 52-week high with today's volume-driven gain. Recently reported earnings for the Jun '14 quarter below the +25% minimum earnings guideline (C criteria) raising fundamental concerns.
>>> FEATURED STOCK ARTICLE : Still Building on an Advanced Base Pattern - 8/6/2014
View all notes |
Set NEW NOTE alert |
CANSLIM.net Company Profile |
SEC
News |
Chart |
Request a new note
C
A N
S L
I M
|
TRN
-
NYSE
Trinity Industries Inc
TRANSPORTATION - Railroads
|
$48.55
|
+0.37
0.77% |
$49.17
|
2,443,982
91.06% of 50 DAV
50 DAV is 2,684,000
|
$48.65
-0.21%
|
4/30/2014
|
$37.79
|
PP = $38.03
|
|
MB = $39.93
|
Most Recent Note - 8/25/2014 3:32:30 PM
G - Hitting another new 52-week high with today's 6th consecutive gain. It has not formed a sound base.
>>> FEATURED STOCK ARTICLE : Rallying Into New High Territory Without Forming New Base - 8/25/2014
View all notes |
Set NEW NOTE alert |
CANSLIM.net Company Profile |
SEC
News |
Chart |
Request a new note
C
A N
S L
I M
|
UA
-
NYSE
Under Armour Inc Cl A
CONSUMER NON-DURABLES - Textile - Apparel Clothing
|
$70.55
|
-0.07
-0.10% |
$71.39
|
1,199,516
49.88% of 50 DAV
50 DAV is 2,405,000
|
$71.79
-1.73%
|
7/10/2014
|
$58.50
|
PP = $60.79
|
|
MB = $63.83
|
Most Recent Note - 8/25/2014 3:33:55 PM
G - Stubbornly holding its ground near its all-time high and no resistance remains due to overhead supply. Recently reported earnings +0% on +34% sales revenues for the Jun '14 quarter, below the +25% minimum earnings guideline (C criteria), yet the company raised its guidance.
>>> FEATURED STOCK ARTICLE : Bullish Action Despite Latest Earnings Below +25% Minimum Guideline - 7/30/2014
View all notes |
Set NEW NOTE alert |
CANSLIM.net Company Profile |
SEC
News |
Chart |
Request a new note
C
A N
S L
I M
|
Symbol/Exchange
Company Name
Industry Group |
PRICE |
CHANGE
(%Change) |
Day High |
Volume
(% DAV)
(% 50 day avg vol) |
52 Wk Hi
% From Hi |
Featured
Date |
Price
Featured |
Pivot Featured |
|
Max Buy |
WLK
-
NYSE
Westlake Chemical Corp
CHEMICALS - Specialty Chemicals
|
$94.97
|
+1.41
1.51% |
$95.36
|
348,275
67.50% of 50 DAV
50 DAV is 516,000
|
$94.01
1.02%
|
4/29/2014
|
$72.79
|
PP = $69.31
|
|
MB = $72.78
|
Most Recent Note - 8/21/2014 6:00:18 PM
G - Technical strength has continued despite having reported earnings +11% on +6% sales revenues for the Jun '14 quarter, below the +25% minimum earnings guideline (C criteria), raising fundamental concerns. Hit a new 52-week high with today's 6th consecutive gain. Its 50 DMA line defines support where a subsequent violation would raise greater concerns and trigger a technical sell signal. See the latest FSU analysis for more details and new annotated graphs.
>>> FEATURED STOCK ARTICLE : Technically Strong Despite Fundamental Concerns Raised By Most Current Quarterly Earnings - 8/21/2014
View all notes |
Set NEW NOTE alert |
CANSLIM.net Company Profile |
SEC
News |
Chart |
Request a new note
C
A N
S L
I M
|
YY
-
NASDAQ
YY Inc Ads
INTERNET - Internet Service Providers
|
$88.42
|
+0.91
1.04% |
$89.85
|
1,327,188
90.35% of 50 DAV
50 DAV is 1,469,000
|
$90.93
-2.76%
|
8/19/2014
|
$85.81
|
PP = $91.03
|
|
MB = $95.58
|
Most Recent Note - 8/21/2014 6:03:23 PM
Y - Volume totals have been cooling while consolidating near its 52-week high. Finished weak when highlighted in yellow in the 8/19/14 mid-day report (read here). The Chinese Internet - Content firm needs subsequent volume-driven gains for new highs to trigger a new technical buy signal. See the latest FSU analysis for more details and annotated graphs.
>>> FEATURED STOCK ARTICLE : Encountered Distributional Peressure Near Prior High - 8/19/2014
View all notes |
Set NEW NOTE alert |
CANSLIM.net Company Profile |
SEC
News |
Chart |
Request a new note
C
A N
S L
I M
|
|
|
|
THESE ARE NOT BUY RECOMMENDATIONS!
Comments contained in the body of this report are technical
opinions only. The material herein has been obtained
from sources believed to be reliable and accurate, however,
its accuracy and completeness cannot be guaranteed.
This site is not an investment advisor, hence it does
not endorse or recommend any securities or other investments.
Any recommendation contained in this report may not
be suitable for all investors and it is not to be deemed
an offer or solicitation on our part with respect to
the purchase or sale of any securities. All trademarks,
service marks and trade names appearing in this report
are the property of their respective owners, and are
likewise used for identification purposes only.
This report is a service available
only to active Paid Premium Members.
You may opt-out of receiving report notifications
at any time. Questions or comments may be submitted
by writing to Premium Membership Services 665 S.E. 10 Street, Suite 201 Deerfield Beach, FL 33441-5634 or by calling 1-800-965-8307
or 954-785-1121.
|
|
|