You are not logged in.
This means you
CAN ONLY VIEW reports that were published prior to Monday, April 14, 2025.
You
MUST UPGRADE YOUR MEMBERSHIP if you want to see any current reports.
AFTER MARKET UPDATE - THURSDAY, AUGUST 25TH, 2011
Previous After Market Report Next After Market Report >>>
|
|
|
|
DOW |
-180.43 |
11,140.28 |
-1.59% |
|
Volume |
1,209,946,270 |
+9% |
|
Volume |
1,761,139,080 |
-4% |
|
NASDAQ |
-48.06 |
2,419.63 |
-1.95% |
|
Advancers |
731 |
23% |
|
Advancers |
504 |
19% |
|
S&P 500 |
-18.74 |
1,158.86 |
-1.59% |
|
Decliners |
2,316 |
74% |
|
Decliners |
2,070 |
78% |
|
Russell 2000 |
-18.11 |
674.46 |
-2.61% |
|
52 Wk Highs |
14 |
|
|
52 Wk Highs |
8 |
|
|
S&P 600 |
-9.51 |
369.56 |
-2.51% |
|
52 Wk Lows |
53 |
|
|
52 Wk Lows |
65 |
|
|
 |
Major Averages Trade With Cautious Tone
Kenneth J. Gruneisen - Passed the CAN SLIM® Master's Exam
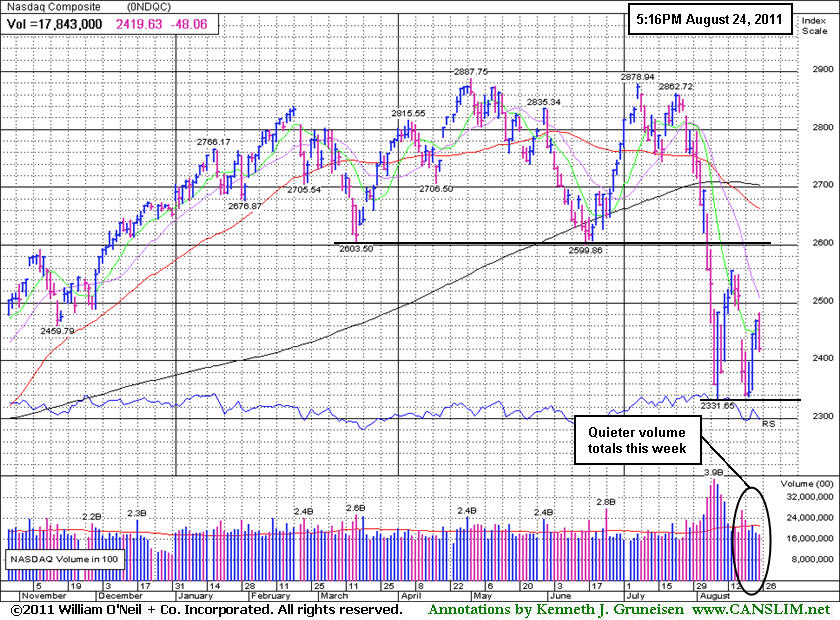
Concerns over Europe and caution ahead of the Bernanke speech led to a weak performance as the Dow Jones Industrial Average, S&P 500 Index, and Nasdaq Composite Index broke a streak of 3 straight gains and closed with unanimous losses on Thursday. Volume totals were reported mixed, higher on the NYSE and lower on the Nasdaq exchange. Breadth was clearly negative as decliners led advancers by 3-1 on the NYSE and 4-1 on the Nasdaq exchange. On the NYSE and on the Nasdaq exchange new 52-week lows totals still solidly outnumbered the new 52-week highs totals. There only were 6 high-ranked companies from the CANSLIM.net Leaders List that made new 52-week highs and appeared on the CANSLIM.net BreakOuts Page, down from the prior session total of 9 stocks. Any sustainable rally requires a healthy crop of strong leaders hitting new 52-week highs, so it will be crucial for leadership to expand if the new "confirmed uptrend" is going to make any meaningful headway. There were losses for all of the 6 high-ranked leaders currently included on the Featured Stocks Page.
Rumors over a credit downgrade proved to be false as the major credit agencies affirmed Germany's rating. The German market dropped over 4% earlier before cutting that loss to -1.7%. Traders sold German equity futures to hedge their investments before France, Italy and Spain extended curbs on short selling. The markets were re-thinking hopes that Fed Chairman Bernanke will make a major pronouncement at Friday's symposium in Wyoming. Some analysts say Bernanke may be reluctant to announce another round of Fed bond purchases because of rising inflation. Meanwhile, a new economic report suggested the jobs market remains soft. Initial jobless claims rose to 417,000, above estimates for 405,000.
Allstate Corp (ALL -3.02%) and other insurance stocks fell as Hurricane Irene threatened the U.S. east coast. Financial stocks got an early bounce from Warren Buffett. The Chairman of Berkshire Hathaway announced a $5 billion investment in Bank of America Corp (BAC +9.44%). Apple Inc (AAPL -0.65%) held up well after Steve Jobs announced his resignation as chief executive for health reasons. AOL Inc (AOL +8.82%) rallied on a report that a deal may be in the works.
The market environment (M criteria) was labeled as back in a "confirmed uptrend" in the newspaper after Tuesday's big gains on higher volume. However, one shortcoming to the follow-through day (FTD) which we previously noted is the dearth of leadership (few stocks hitting new 52-week highs) which suggests that there may not be a healthy crop of leaders showing sufficient strength to allow the major averages to sustain a meaningful advance. The indices also remain well below their respective 200-day moving average (DMA) lines, and to be considered truly "healthy" they would need to rebound above their long-term averages.
The August 2011 issue of CANSLIM.net News is now available (click here). Links to all prior reports are available on the Premium Member Homepage.
PICTURED: The Nasdaq Composite Index has been trading quieter volume in the past week while keeping its rally alive and avoiding undercutting its August 9th low..
|
 Kenneth J. Gruneisen started out as a licensed stockbroker in August 1987, a couple of months prior to the historic stock market crash that took the Dow Jones Industrial Average down -22.6% in a single day. He has published daily fact-based fundamental and technical analysis on high-ranked stocks online for two decades. Through FACTBASEDINVESTING.COM, Kenneth provides educational articles, news, market commentary, and other information regarding proven investment systems that work in good times and bad.
Comments contained in the body of this report are technical opinions only and are not necessarily those of Gruneisen Growth Corp. The material herein has been obtained from sources believed to be reliable and accurate, however, its accuracy and completeness cannot be guaranteed. Our firm, employees, and customers may effect transactions, including transactions contrary to any recommendation herein, or have positions in the securities mentioned herein or options with respect thereto. Any recommendation contained in this report may not be suitable for all investors and it is not to be deemed an offer or solicitation on our part with respect to the purchase or sale of any securities. |
|
 |
Tech Sector Leads Broad Based Retreat
Kenneth J. Gruneisen - Passed the CAN SLIM® Master's Exam
The tech sector had a negative bias as the Networking Index ($NWX -3.23%), Semiconductor Index ($SOX -2.71%), Biotechnology Index ($BTK -2.27%), and Internet Index ($IIX -1.85%) suffered unanimous losses. The Healthcare Index ($HMO -2.27%) sank, and weakness in energy-related shares pressured the Integrated Oil Index ($XOI -2.35%) and Oil Services Index ($OSX -2.24%) lower. The Retail Index ($RLX -1.61%) and weak financial shares weighed on the major averages. The Broker/Dealer Index ($XBD -1.92%) fell, and the Bank Index ($BKX -0.21%) even closed with a small loss despite early gains in bank stocks in response to Buffett's confidence shown. Meanwhile, the Gold & Silver Index ($XAU +1.66%) was a standout gainer.
Charts courtesy www.stockcharts.com
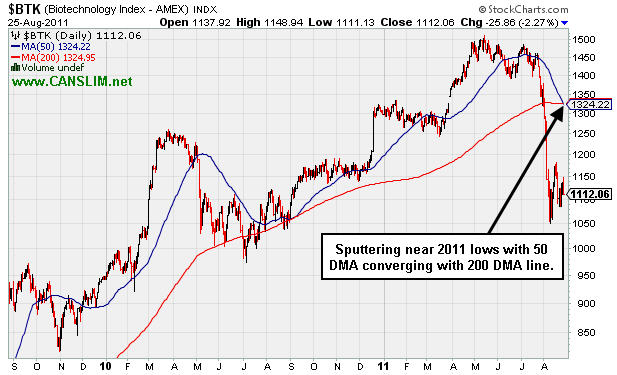
PICTURED: The Biotechnology Index ($BTK -2.27%) is sputtering near its 2011 low with its 50-day moving average (DMA) line now converging with its 200 DMA line.
| Oil Services |
$OSX |
218.17 |
-5.00 |
-2.24% |
-10.99% |
| Healthcare |
$HMO |
1,931.61 |
-44.84 |
-2.27% |
+14.16% |
| Integrated Oil |
$XOI |
1,097.72 |
-26.46 |
-2.35% |
-9.52% |
| Semiconductor |
$SOX |
336.33 |
-9.36 |
-2.71% |
-18.33% |
| Networking |
$NWX |
220.26 |
-7.35 |
-3.23% |
-21.49% |
| Internet |
$IIX |
264.67 |
-4.97 |
-1.85% |
-13.99% |
| Broker/Dealer |
$XBD |
86.89 |
-1.70 |
-1.92% |
-28.50% |
| Retail |
$RLX |
487.71 |
-8.10 |
-1.63% |
-4.07% |
| Gold & Silver |
$XAU |
210.93 |
+3.45 |
+1.66% |
-6.91% |
| Bank |
$BKX |
37.62 |
-0.11 |
-0.29% |
-27.94% |
| Biotech |
$BTK |
1,112.06 |
-25.86 |
-2.27% |
-14.30% |
|
|
|
 |
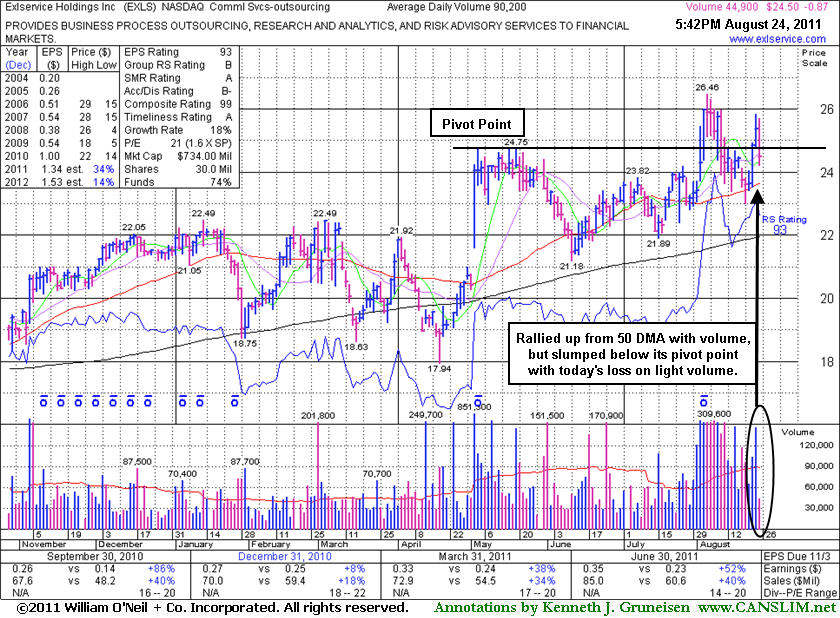
Volume Light on Pullback Below Pivot Point
Kenneth J. Gruneisen - Passed the CAN SLIM® Master's Exam
Exlservice Holdings Inc (EXLS -$0.87 or -3.43% to $24.50) slumped back under its pivot point again today with a loss on lighter than average volume. The recent low ($23.01 on 8/19/11) and its 50-day moving average (DMA) line define important support to watch above its 200 DMA line. It found prompt support and rallied from its 50 DMA line with volume-driven gains since last shown in this FSU section on 8/15/11 with an annotated graph under the headline, "Slump Below Prior High Closes Raises Concerns". Its Accumulation/Distribution rating also improved from C- to B- since its last FSU appearance. No resistance remains due to overhead supply. Tuesday's big gains for the broader market (M criteria) support investors making new buying efforts, although the new rally was confirmed by a follow-through day with only scant new leadership.
It reported earnings +52% on +40% sales revenues for the quarter ended June 30, 2011 versus the year ago period. Quarterly comparisons (C criteria) have shown mostly impressive sales and earnings increases. Downturn in its FY '08 earnings was previously noted as a small flaw with respect to the A criteria of the fact-based investment system.
|
|
|
Color Codes Explained :
Y - Better candidates highlighted by our
staff of experts.
G - Previously featured
in past reports as yellow but may no longer be buyable under the
guidelines.
***Last / Change / Volume data in this table is the closing quote data***
Symbol/Exchange
Company Name
Industry Group |
PRICE |
CHANGE
(%Change) |
Day High |
Volume
(% DAV)
(% 50 day avg vol) |
52 Wk Hi
% From Hi |
Featured
Date |
Price
Featured |
Pivot Featured |
|
Max Buy |
EXLS
-
NASDAQ
Exlservice Holdings Inc
DIVERSIFIED SERVICES - Business/Management Services
|
$24.50
|
-0.87
-3.43% |
$25.71
|
54,192
60.08% of 50 DAV
50 DAV is 90,200
|
$26.46
-7.41%
|
8/2/2011
|
$24.85
|
PP = $24.85
|
|
MB = $26.09
|
 Most Recent Note - 8/25/2011 1:05:06 PM
Y - Consolidating back under its pivot point again today, slumping -7.9% off its 52-week high. Recent low ($23.01 on 8/19/11) and 50 DMA line define important support to watch above its 200 DMA line.
>>> The latest Featured Stock Update with an annotated graph appeared on 8/25/2011. Click here.
View all notes |
Alert me of new notes |
CANSLIM.net Company Profile |
SEC |
Zacks Reports |
StockTalk |
News |
Chart |
Request a new note
C
A N
S L
I M


|
FCFS
-
NASDAQ
First Cash Financial Svs
SPECIALTY RETAIL - Specialty Retail, Other
|
$43.44
|
-0.41
-0.94% |
$44.71
|
325,425
103.11% of 50 DAV
50 DAV is 315,600
|
$47.80
-9.12%
|
5/31/2011
|
$42.00
|
PP = $40.23
|
|
MB = $42.24
|
Most Recent Note - 8/24/2011 12:23:37 PM
G - Off today's earlier highs and slipping into the red. Recently finding support near its 50 DMA line. Prior chart lows near $37-38 define support to watch.
>>> The latest Featured Stock Update with an annotated graph appeared on 8/22/2011. Click here.
View all notes |
Alert me of new notes |
CANSLIM.net Company Profile |
SEC |
Zacks Reports |
StockTalk |
News |
Chart |
Request a new note
C
A N
S L
I M
|
JCOM
-
NASDAQ
J 2 Global Communication
INTERNET - Internet Software and Services
|
$29.17
|
-0.91
-3.03% |
$30.68
|
368,491
110.82% of 50 DAV
50 DAV is 332,500
|
$31.72
-8.04%
|
8/8/2011
|
$30.38
|
PP = $29.31
|
|
MB = $30.78
|
Most Recent Note - 8/25/2011 1:07:31 PM
G - Reversed into the red after opening higher today. Gains this week helped it approach its 8/03/11 high, and little resistance remains due to overhead supply.
>>> The latest Featured Stock Update with an annotated graph appeared on 8/19/2011. Click here.
View all notes |
Alert me of new notes |
CANSLIM.net Company Profile |
SEC |
Zacks Reports |
StockTalk |
News |
Chart |
Request a new note
C
A N
S L
I M
|
MA
-
NYSE
Mastercard Inc Cl A
DIVERSIFIED SERVICES - Business/Management Services
|
$322.86
|
-2.34
-0.72% |
$329.49
|
826,292
55.28% of 50 DAV
50 DAV is 1,494,800
|
$340.42
-5.16%
|
8/3/2011
|
$324.82
|
PP = $322.38
|
|
MB = $338.50
|
Most Recent Note - 8/24/2011 6:09:04 PM
Y - Posted a 3rd consecutive gain on lighter than average volume today and finished -4.5% off its 8/03/11 all-time high. Recently found support near its 50 DMA line.
>>> The latest Featured Stock Update with an annotated graph appeared on 8/16/2011. Click here.
View all notes |
Alert me of new notes |
CANSLIM.net Company Profile |
SEC |
Zacks Reports |
StockTalk |
News |
Chart |
Request a new note
C
A N
S L
I M
|
MG
-
NYSE
Mistras Group Inc
DIVERSIFIED SERVICES - Bulding and Faci;ity Management Services
|
$19.33
|
-0.06
-0.31% |
$19.82
|
356,662
242.63% of 50 DAV
50 DAV is 147,000
|
$20.10
-3.83%
|
8/10/2011
|
$17.89
|
PP = $17.58
|
|
MB = $18.46
|
Most Recent Note - 8/25/2011 12:30:30 PM
G - Hovering near its all-time high with no resistance remaining due to overhead supply. Previous resistance in the $17-18 area defined important chart support after encountering mild distributional pressure. See the latest FSU analysis for more details and a new annotated graph.
>>> The latest Featured Stock Update with an annotated graph appeared on 8/24/2011. Click here.
View all notes |
Alert me of new notes |
CANSLIM.net Company Profile |
SEC |
Zacks Reports |
StockTalk |
News |
Chart |
Request a new note
C
A N
S L
I M
|
Symbol/Exchange
Company Name
Industry Group |
PRICE |
CHANGE
(%Change) |
Day High |
Volume
(% DAV)
(% 50 day avg vol) |
52 Wk Hi
% From Hi |
Featured
Date |
Price
Featured |
Pivot Featured |
|
Max Buy |
MKTX
-
NASDAQ
Marketaxess Holdings Inc
FINANCIAL SERVICES - Investment Brokerage - Nationa
|
$28.51
|
-1.02
-3.45% |
$29.94
|
236,419
97.61% of 50 DAV
50 DAV is 242,200
|
$30.25
-5.75%
|
7/29/2011
|
$25.87
|
PP = $26.35
|
|
MB = $27.67
|
Most Recent Note - 8/25/2011 1:09:34 PM
G - Reversed into the red after earlier gains today. Extended from its prior base. See the latest FSU analysis for more details and a new annotated graph.
>>> The latest Featured Stock Update with an annotated graph appeared on 8/23/2011. Click here.
View all notes |
Alert me of new notes |
CANSLIM.net Company Profile |
SEC |
Zacks Reports |
StockTalk |
News |
Chart |
Request a new note
C
A N
S L
I M
|
|
|
|
THESE ARE NOT BUY RECOMMENDATIONS!
Comments contained in the body of this report are technical
opinions only. The material herein has been obtained
from sources believed to be reliable and accurate, however,
its accuracy and completeness cannot be guaranteed.
This site is not an investment advisor, hence it does
not endorse or recommend any securities or other investments.
Any recommendation contained in this report may not
be suitable for all investors and it is not to be deemed
an offer or solicitation on our part with respect to
the purchase or sale of any securities. All trademarks,
service marks and trade names appearing in this report
are the property of their respective owners, and are
likewise used for identification purposes only.
This report is a service available
only to active Paid Premium Members.
You may opt-out of receiving report notifications
at any time. Questions or comments may be submitted
by writing to Premium Membership Services 665 S.E. 10 Street, Suite 201 Deerfield Beach, FL 33441-5634 or by calling 1-800-965-8307
or 954-785-1121.
|
|
|

