You are not logged in.
This means you
CAN ONLY VIEW reports that were published prior to Monday, April 14, 2025.
You
MUST UPGRADE YOUR MEMBERSHIP if you want to see any current reports.
AFTER MARKET UPDATE - WEDNESDAY, AUGUST 25TH, 2010
Previous After Market Report Next After Market Report >>>
|
|
|
|
DOW |
+19.61 |
10,060.06 |
+0.20% |
|
Volume |
1,114,157,239 |
-5% |
|
Volume |
2,031,579,904 |
-6% |
|
NASDAQ |
+17.78 |
2,141.54 |
+0.84% |
|
Advancers |
1,832 |
59% |
|
Advancers |
1,676 |
61% |
|
S&P 500 |
+3.46 |
1,055.33 |
+0.33% |
|
Decliners |
1,167 |
37% |
|
Decliners |
977 |
35% |
|
Russell 2000 |
+9.27 |
604.86 |
+1.56% |
|
52 Wk Highs |
103 |
|
|
52 Wk Highs |
14 |
|
|
S&P 600 |
+4.49 |
324.12 |
+1.40% |
|
52 Wk Lows |
158 |
|
|
52 Wk Lows |
194 |
|
|
 |
Major Averages Halt Slide With Lighter Volume Behind Gains
Adam Sarhan, Contributing Writer,
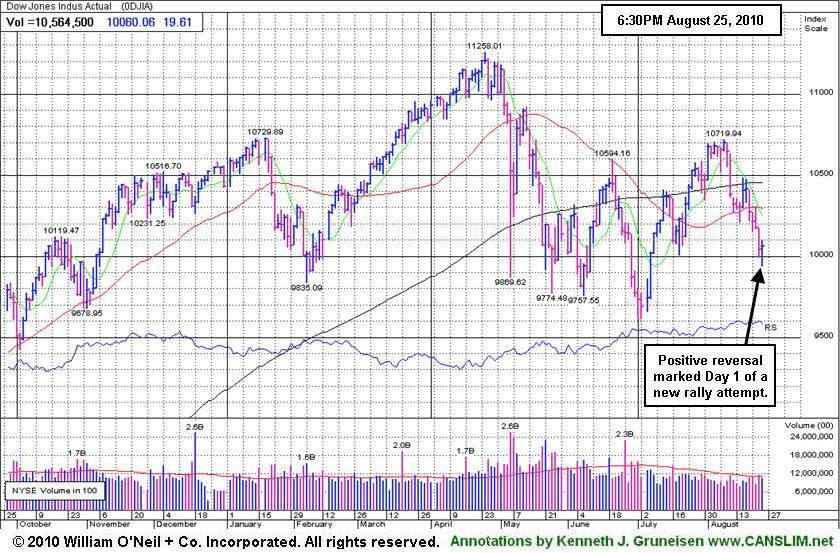
The major averages ended higher which marked Day 1 of a new rally attempt as the market snapped a four day losing streak. Volume reported on the NYSE and the Nasdaq exchange fell on Wednesday compared to Tuesday's levels which suggested that large institutions were not aggressively buying stocks. Advancers led decliners by approximately a 3-to-2 ratio on the NYSE and on the Nasdaq exchange. New 52-week lows outnumbered new 52-week highs on the NYSE and on the Nasdaq exchange. There were 6 high-ranked companies from the CANSLIM.net Leaders List made a new 52-week high and appeared on the CANSLIM.net BreakOuts Page, the same number that appeared on the prior session.
Stocks opened lower after new home sales plunged to a record low and durable goods orders fell short of analyst estimates. The Commerce Department said new home sales unexpectedly slid last month to the lowest level on record which suggests the housing market remains very weak. Sales fell -12% from June to an annual pace of 276,000, the lowest level since data began in 1963! The report also showed that the median home price fell to $204,000 which was the lowest reading since late 2003. Meanwhile, durable goods orders, which are goods that are made to last at least three years, rose less than forecast in July. Durable goods orders rose +0.3%, which fell short of the +3% gain analysts had expected. Excluding transportation equipment, demand unexpectedly plunged -3.8% which is the largest monthly decline since January 2009.
Wednesday marked Day 1 of a new rally attempt which means that the earliest a possible follow-through day (FTD) could emerge will be Monday. However, if at anytime, Wednesday's lows are breached then the day count will be reset. The technical action in the major averages and the latest round of economic data bodes poorly for the market and the global recovery. Currently, resistance for the the major averages are their 50 DMA lines, then their longer term 200 DMA lines while support remains July's lows. It is also disconcerting to see weakness in the financial group while action in leading stocks has been questionable as evidenced by the dearth of high-ranked leaders breaking out of sound bases. Monday's negative reversal coupled with Tuesday's ugly distribution day effectively ended the latest rally attempt. This emphasizes the importance of remaining cautious until the rally is back in a confirmed uptrend. Put simply, we can expect this sideways/choppy action to continue until the market breaks out above resistance or below support. The first scenario will have bullish ramifications while the second will be clearly bearish. Trade accordingly.
The Market Is In A Correction, Does Your Broker Know?
Our skilled team of portfolio managers knows how to follow the rules of this fact-based investment system. We do not follow opinion or the "conviction list" of some large Wall Street institution which would have us fully invested even during horrific bear markets. Instead, we remain fluid and only buy the best stocks when they are triggering proper technical buy signals. If you are not completely satisfied with the way your portfolio is being managed, Click here to submit your inquiry. *Accounts over $250,000 please. ** Serious inquires only.
PICTURED: The Dow Jones Industrial Average managed a positive reversal today and halted a 4 session losing streak, marking Day 1 of a new rally attempt.
|
|
|
 |
Retail, Tech, and Defensive Groups Rise While Financials Lag
Kenneth J. Gruneisen - Passed the CAN SLIM® Master's Exam
The Retail Index ($RLX +1.37%) and the tech sector traded higher as the Networking Index ($NWX +0.79%), Internet Index ($IIX +0.85%), Semiconductor Index ($SOX +0.97%), and Biotechnology Index ($BTK +1.91%) finished with unanimous gains. Defensive area also were on the rise as the Healthcare Index ($HMO +2.41%) and Gold & Silver Index ($XAU +2.44%) posted solid gains. Meanwhile, the financial group continued foundering as the Bank Index ($BKX -0.41%) and Broker/Dealer Index ($XBD -0.22%) finished with small losses on Wednesday. Energy related shares also lagged as the Oil Services Index ($OSX -0.59%) and Integrated Oil Index ($XOI -0.14%) edged lower.
Charts courtesy www.stockcharts.com
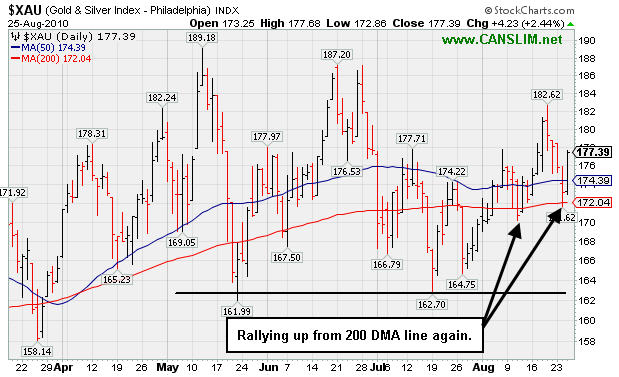
PICTURED: The Gold & Silver Index ($XAU +2.44%) rallied up from its 200-day moving average (DMA) line again. It has not enjoyed a productive year, despite its appeal as a "safe haven" area in times of economic uncertainty. However, there are a few high-ranked leaders hailing from the Mining - Gold/Silver/Gems industry group which are currently included on the Featured Stocks page based on fundamental and technical strength. They are ideal candidates for investors' watch lists in the event the broader market resumes its rally and only if they produce bullish breakouts confirming they are attracting great institutional (I criteria) demand capable of leading to a sustained advance. Meanwhile, patience and good discipline are critical.
| Oil Services |
$OSX |
171.41 |
-1.01 |
-0.59% |
-12.06% |
| Healthcare |
$HMO |
1,467.70 |
+34.47 |
+2.41% |
-0.36% |
| Integrated Oil |
$XOI |
930.15 |
-1.27 |
-0.14% |
-12.92% |
| Semiconductor |
$SOX |
321.50 |
+3.09 |
+0.97% |
-10.67% |
| Networking |
$NWX |
226.05 |
+1.78 |
+0.79% |
-2.17% |
| Internet |
$IIX |
246.14 |
+2.09 |
+0.86% |
+5.25% |
| Broker/Dealer |
$XBD |
100.55 |
-0.22 |
-0.22% |
-12.61% |
| Retail |
$RLX |
405.20 |
+5.48 |
+1.37% |
-1.44% |
| Gold & Silver |
$XAU |
177.39 |
+4.23 |
+2.44% |
+5.43% |
| Bank |
$BKX |
43.41 |
-0.18 |
-0.41% |
+1.64% |
| Biotech |
$BTK |
1,065.92 |
+20.03 |
+1.92% |
+13.14% |
|
|
|
 |
Another High-Ranked Mining Firm Perched Near Highs
Kenneth J. Gruneisen - Passed the CAN SLIM® Master's Exam
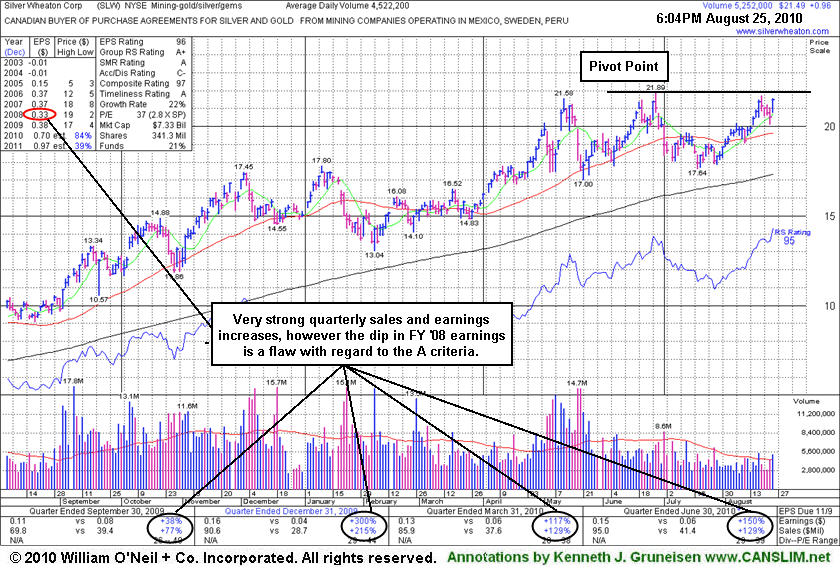
Silver Wheaton Corp (SLW +$0.96 or +4.68% to $21.49) is perched near its all-time high, no overhead supply remains to hinder its upward progress, yet the $21 area has been a stubborn resistance level a couple of times earlier this year. This Canada-based firm in the Mining - Gold/Silver/Gems industry had a downward turn in FY '08 earnings (A criteria has been noted as a concern, see red circle). Its 3 latest quarterly comparisons showed solid sales and earnings increases (good criteria) after 4 prior reports with negative comparisons versus the year ago period. It was featured in today's mid-day report (read here). Disciplined investors resist the urge to get in early and would wait to see a technical breakout with at least +50% above average volume to confirm that it is under heavy institutional (I criteria) buying demand. Additionally, keep in mind that the M criteria is now arguing against new buying efforts until a new follow-through day occurs from at least one of the major averages.
There are a few high-ranked leaders hailing from the Mining - Gold/Silver/Gems industry group which are currently included on the Featured Stocks page based on fundamental and technical strength. Current leadership in the group (L criteria) is helping most firms in the group show strength. They are ideal candidates for investors' watch lists in the event the broader market resumes its rally and only if they produce bullish breakouts confirming they are attracting great institutional (I criteria) demand capable of leading to a sustained advance. Meanwhile, patience and good discipline are critical.
|
|
|
Color Codes Explained :
Y - Better candidates highlighted by our
staff of experts.
G - Previously featured
in past reports as yellow but may no longer be buyable under the
guidelines.
***Last / Change / Volume data in this table is the closing quote data***
Symbol/Exchange
Company Name
Industry Group |
PRICE |
CHANGE
(%Change) |
Day High |
Volume
(% DAV)
(% 50 day avg vol) |
52 Wk Hi
% From Hi |
Featured
Date |
Price
Featured |
Pivot Featured |
|
Max Buy |
ABV
-
NYSE
Comp De Bebidas Adr
FOOD and BEVERAGE - Beverages - Brewers
|
$107.27
|
-1.46
-1.34% |
$107.73
|
662,659
101.11% of 50 DAV
50 DAV is 655,400
|
$112.60
-4.73%
|
6/29/2010
|
$104.74
|
PP = $109.33
|
|
MB = $114.80
|
Most Recent Note - 8/23/2010 12:32:25 PM
G - This Brazil-based beverage firm is perched near its all-time high. Color code was changed to green despite its recent resilience, as fundamental concerns were raised as for the quarter ended June 30, 2010 it reported +19% earnings on +16% sales revenues, below the +25% guidelines.
>>> The latest Featured Stock Update with an annotated graph appeared on 8/18/2010. Click here.
View all notes |
Alert me of new notes |
CANSLIM.net Company Profile |
SEC |
Zacks Reports |
StockTalk |
News |
Chart |
Request a new note
C
A N
S L
I M


|
BIDU
-
NASDAQ
Baidu Inc Ads
INTERNET - Internet Information Providers
|
$78.30
|
+0.96
1.24% |
$78.55
|
7,712,955
69.29% of 50 DAV
50 DAV is 11,132,200
|
$88.32
-11.35%
|
7/14/2010
|
$75.03
|
PP = $78.59
|
|
MB = $82.52
|
Most Recent Note - 8/24/2010 7:19:03 PM
G - Loss today on near average volume, closing near prior highs that define technical support along with its 50 DMA line.
>>> The latest Featured Stock Update with an annotated graph appeared on 8/13/2010. Click here.
View all notes |
Alert me of new notes |
CANSLIM.net Company Profile |
SEC |
Zacks Reports |
StockTalk |
News |
Chart |
Request a new note
C
A N
S L
I M
|
CACC
-
NASDAQ
Credit Acceptance Corp
FINANCIAL SERVICES - Credit Services
|
$59.39
|
+1.06
1.82% |
$59.39
|
19,417
35.89% of 50 DAV
50 DAV is 54,100
|
$61.41
-3.29%
|
7/29/2010
|
$52.04
|
PP = $54.07
|
|
MB = $56.77
|
Most Recent Note - 8/24/2010 7:23:32 PM
G - Rebounded and closed in the upper half of its intra-day range again today. Extended from its prior base, previous resistance near $54 defines initial chart support to watch.
>>> The latest Featured Stock Update with an annotated graph appeared on 8/2/2010. Click here.
View all notes |
Alert me of new notes |
CANSLIM.net Company Profile |
SEC |
Zacks Reports |
StockTalk |
News |
Chart |
Request a new note
C
A N
S L
I M
|
CRM
-
NYSE
Salesforce.Com Inc
INTERNET - Internet Software and Services
|
$112.19
|
-1.10
-0.97% |
$113.42
|
4,596,176
186.00% of 50 DAV
50 DAV is 2,471,100
|
$114.15
-1.72%
|
6/2/2010
|
$88.44
|
PP = $89.60
|
|
MB = $94.08
|
 Most Recent Note - 8/25/2010 12:31:20 PM
G - Holding its ground stubbornly since a gap up on 8/20/10 for a considerable gain and new all-time high, now extended from any sound base.
>>> The latest Featured Stock Update with an annotated graph appeared on 8/16/2010. Click here.
View all notes |
Alert me of new notes |
CANSLIM.net Company Profile |
SEC |
Zacks Reports |
StockTalk |
News |
Chart |
Request a new note
C
A N
S L
I M
|
EGO
-
NYSE
Eldorado Gold Corp
METALS and MINING - Gold
|
$18.98
|
+1.00
5.56% |
$19.04
|
6,150,023
148.10% of 50 DAV
50 DAV is 4,152,500
|
$19.07
-0.47%
|
8/19/2010
|
$18.25
|
PP = $19.17
|
|
MB = $20.13
|
Most Recent Note - 8/25/2010 5:37:58 PM
Y - Rallied near its pivot point for a new high close today with +48% above average volume behind the solid gain. The Canada-based mining firm was featured in the 8/19/10 mid-day report (read here) in yellow with a pivot point based on its 52-week high plus ten cents.
>>> The latest Featured Stock Update with an annotated graph appeared on 8/19/2010. Click here.
View all notes |
Alert me of new notes |
CANSLIM.net Company Profile |
SEC |
Zacks Reports |
StockTalk |
News |
Chart |
Request a new note
C
A N
S L
I M
|
Symbol/Exchange
Company Name
Industry Group |
PRICE |
CHANGE
(%Change) |
Day High |
Volume
(% DAV)
(% 50 day avg vol) |
52 Wk Hi
% From Hi |
Featured
Date |
Price
Featured |
Pivot Featured |
|
Max Buy |
FFIV
-
NASDAQ
F 5 Networks Inc
INTERNET - Internet Software and Services
|
$86.89
|
+0.62
0.72% |
$86.98
|
1,692,933
99.78% of 50 DAV
50 DAV is 1,696,700
|
$92.70
-6.27%
|
6/16/2010
|
$74.50
|
PP = $74.10
|
|
MB = $77.81
|
Most Recent Note - 8/25/2010 5:39:58 PM
G - After a small gap down today it managed a positive reversal. Recently noted as -"extended from any sound base after recent volume-driven gains, it could go on to produce more climactic gains."
>>> The latest Featured Stock Update with an annotated graph appeared on 8/4/2010. Click here.
View all notes |
Alert me of new notes |
CANSLIM.net Company Profile |
SEC |
Zacks Reports |
StockTalk |
News |
Chart |
Request a new note
C
A N
S L
I M
|
FOSL
-
NASDAQ
Fossil Inc
CONSUMER DURABLES - Recreational Goods, Other
|
$44.71
|
+0.33
0.74% |
$44.93
|
831,381
99.06% of 50 DAV
50 DAV is 839,300
|
$46.30
-3.43%
|
8/10/2010
|
$45.54
|
PP = $42.69
|
|
MB = $44.82
|
Most Recent Note - 8/24/2010 7:27:20 PM
Y - Holding its ground in a very tight trading range since its considerable "breakaway gap" on 8/10/10 for a new 52-week high and all-time high.
>>> The latest Featured Stock Update with an annotated graph appeared on 8/11/2010. Click here.
View all notes |
Alert me of new notes |
CANSLIM.net Company Profile |
SEC |
Zacks Reports |
StockTalk |
News |
Chart |
Request a new note
C
A N
S L
I M
|
GMCR
-
NASDAQ
Green Mtn Coffee Roastrs
FOOD and BEVERAGE - Processed and Packaged Goods
|
$31.11
|
-0.45
-1.43% |
$31.33
|
4,593,242
195.14% of 50 DAV
50 DAV is 2,353,800
|
$33.98
-8.45%
|
8/17/2010
|
$33.62
|
PP = $33.30
|
|
MB = $34.97
|
Most Recent Note - 8/25/2010 11:09:53 AM
G - Gapped down again today, violating an upward trendline defining initial chart support and sinking near its 50 DMA line. Color code is changed to green based on the weak technical action, slumping far below the previously cited pivot point.
>>> The latest Featured Stock Update with an annotated graph appeared on 8/17/2010. Click here.
View all notes |
Alert me of new notes |
CANSLIM.net Company Profile |
SEC |
Zacks Reports |
StockTalk |
News |
Chart |
Request a new note
C
A N
S L
I M
|
MELI
-
NASDAQ
Mercadolibre Inc
INTERNET - Internet Software and; Services
|
$63.59
|
-2.33
-3.53% |
$65.48
|
1,829,147
176.64% of 50 DAV
50 DAV is 1,035,500
|
$70.95
-10.37%
|
5/13/2010
|
$54.21
|
PP = $55.85
|
|
MB = $58.64
|
Most Recent Note - 8/25/2010 2:17:11 PM
G - Considerable loss today with above average volume, sinking near prior highs in the $62 area and its 50 DMA line defining chart support. The pullback may be offering investors a secondary buy point, however weakened market conditions (M criteria) are a concern now arguing against new buying effort until a new follow-through day occurs.
>>> The latest Featured Stock Update with an annotated graph appeared on 7/23/2010. Click here.
View all notes |
Alert me of new notes |
CANSLIM.net Company Profile |
SEC |
Zacks Reports |
StockTalk |
News |
Chart |
Request a new note
C
A N
S L
I M
|
MRX
-
NYSE
Medicis Pharmaceut Cl A
DRUGS - Biotechnology
|
$26.50
|
+0.12
0.45% |
$26.51
|
1,688,198
151.64% of 50 DAV
50 DAV is 1,113,300
|
$28.15
-5.86%
|
8/12/2010
|
$26.88
|
PP = $26.71
|
|
MB = $28.05
|
Most Recent Note - 8/25/2010 6:02:46 PM
Y - Small gain today with above average volume. The high-ranked Medical - Ethical Drugs firm is consolidating near prior chart highs.
>>> The latest Featured Stock Update with an annotated graph appeared on 8/12/2010. Click here.
View all notes |
Alert me of new notes |
CANSLIM.net Company Profile |
SEC |
Zacks Reports |
StockTalk |
News |
Chart |
Request a new note
C
A N
S L
I M
|
Symbol/Exchange
Company Name
Industry Group |
PRICE |
CHANGE
(%Change) |
Day High |
Volume
(% DAV)
(% 50 day avg vol) |
52 Wk Hi
% From Hi |
Featured
Date |
Price
Featured |
Pivot Featured |
|
Max Buy |
MWIV
-
NASDAQ
M W I Veterinary Supply
HEALTH SERVICES - Medical Instruments and; Supplies
|
$54.38
|
+0.90
1.68% |
$55.24
|
58,722
75.67% of 50 DAV
50 DAV is 77,600
|
$54.48
-0.18%
|
7/29/2010
|
$52.05
|
PP = $52.09
|
|
MB = $54.69
|
Most Recent Note - 8/25/2010 6:00:52 PM
Y - Gain today on light volume for a new all-time high, showing impressive strength after rallying up from recent lows in the $46 area that define an important chart support level.
>>> The latest Featured Stock Update with an annotated graph appeared on 7/30/2010. Click here.
View all notes |
Alert me of new notes |
CANSLIM.net Company Profile |
SEC |
Zacks Reports |
StockTalk |
News |
Chart |
Request a new note
C
A N
S L
I M
|
NEM
-
NYSE
Newmont Mining Corp
METALS and MINING - Gold
|
$58.74
|
+1.62
2.84% |
$58.98
|
7,031,928
91.63% of 50 DAV
50 DAV is 7,674,200
|
$63.38
-7.32%
|
6/22/2010
|
$59.60
|
PP = $59.67
|
|
MB = $62.65
|
Most Recent Note - 8/25/2010 5:59:09 PM
G - Gain today with near average volume helped it rally to close just above its 50 DMA line again. Leadership in the Mining - Gold/Silver/Gems group (L criteria) is a nice reassurance.
>>> The latest Featured Stock Update with an annotated graph appeared on 8/6/2010. Click here.
View all notes |
Alert me of new notes |
CANSLIM.net Company Profile |
SEC |
Zacks Reports |
StockTalk |
News |
Chart |
Request a new note
C
A N
S L
I M
|
NEOG
-
NASDAQ
Neogen Corp
DRUGS - Diagnostic Substances
|
$28.98
|
+0.96
3.43% |
$29.06
|
83,762
101.28% of 50 DAV
50 DAV is 82,700
|
$30.39
-4.64%
|
7/22/2010
|
$27.19
|
PP = $27.87
|
|
MB = $29.26
|
Most Recent Note - 8/25/2010 5:09:49 PM
Y- Solid gain today and strong close near session high on average volume, rallying up from its 50 DMA line and prior highs in the $27 area defining important technical support.
>>> The latest Featured Stock Update with an annotated graph appeared on 8/20/2010. Click here.
View all notes |
Alert me of new notes |
CANSLIM.net Company Profile |
SEC |
Zacks Reports |
StockTalk |
News |
Chart |
Request a new note
C
A N
S L
I M
|
NFLX
-
NASDAQ
Netflix Inc
SPECIALTY RETAIL - Music and Video Stores
|
$124.25
|
+2.97
2.45% |
$124.82
|
2,863,991
64.78% of 50 DAV
50 DAV is 4,421,100
|
$140.90
-11.82%
|
8/10/2010
|
$124.05
|
PP = $124.00
|
|
MB = $130.20
|
Most Recent Note - 8/25/2010 5:12:36 PM
G- Small gain today on light volume, bouncing back near its prior high of $124 noted as an important support level to watch. Color code was changed to green based on recent distributional action and its slump below its pivot point.
>>> The latest Featured Stock Update with an annotated graph appeared on 8/10/2010. Click here.
View all notes |
Alert me of new notes |
CANSLIM.net Company Profile |
SEC |
Zacks Reports |
StockTalk |
News |
Chart |
Request a new note
C
A N
S L
I M
|
PAY
-
NYSE
Verifone Systems Inc
COMPUTER HARDWARE - Transaction Automation Systems
|
$24.32
|
+1.90
8.47% |
$25.03
|
6,518,064
601.52% of 50 DAV
50 DAV is 1,083,600
|
$23.75
2.40%
|
8/25/2010
|
$24.30
|
PP = $23.74
|
|
MB = $24.93
|
Most Recent Note - 8/25/2010 5:17:35 PM
Y - Gapped up today and hit a new 52-week high following better than expected results for the quarter ended July 31, 2010 with earnings per share +38% on +24% sales revenues versus the year ago period. Recent quarters showed strong earnings and sales revenues accelerating after a streak of negative comparisons. It was featured in the mid-day report today (read here)rising from a cup-with-handle base. Long ago, based on disappointing fundamental news and very weak technical action, it was dropped from the Featured Stocks list on 12/3/2007 as it gapped down for a considerable loss after the company said it would restate its earnings for the past three quarters, with the added warning that revelations of deeper problems may follow. It has rebounded impressively and is now clear of overhead supply after a powerful technical breakout with 6 times average volume, however the M criteria is now arguing against new buying efforts until a new follow-through day occurs from at least one of the major averages.
>>> The latest Featured Stock Update with an annotated graph appeared on 12/18/2008. Click here.
View all notes |
Alert me of new notes |
CANSLIM.net Company Profile |
SEC |
Zacks Reports |
StockTalk |
News |
Chart |
Request a new note
C
A N
S L
I M
|
Symbol/Exchange
Company Name
Industry Group |
PRICE |
CHANGE
(%Change) |
Day High |
Volume
(% DAV)
(% 50 day avg vol) |
52 Wk Hi
% From Hi |
Featured
Date |
Price
Featured |
Pivot Featured |
|
Max Buy |
ROVI
-
NASDAQ
Rovi Corp
COMPUTER SOFTWARE andamp; SERVICES - Security Software andamp; Services
|
$42.24
|
+0.66
1.59% |
$42.34
|
916,202
81.49% of 50 DAV
50 DAV is 1,124,300
|
$44.96
-6.05%
|
6/3/2010
|
$38.70
|
PP = $40.16
|
|
MB = $42.17
|
Most Recent Note - 8/25/2010 5:21:34 PM
G - Positively reversed today and closed near the session high with a gain on light volume after initially gapping down under its 50 DMA line following the prior session's damaging loss with nearly 2 times average volume. Prior highs in the $40 area and its 50 DMA line define chart support.
>>> The latest Featured Stock Update with an annotated graph appeared on 8/24/2010. Click here.
View all notes |
Alert me of new notes |
CANSLIM.net Company Profile |
SEC |
Zacks Reports |
StockTalk |
News |
Chart |
Request a new note
C
A N
S L
I M
|
SHOO
-
NASDAQ
Steven Madden Limited
CONSUMER NON-DURABLES - Textile - Apparel Footwear
|
$35.50
|
+0.70
2.01% |
$35.56
|
364,188
84.89% of 50 DAV
50 DAV is 429,000
|
$40.98
-13.37%
|
8/5/2010
|
$39.55
|
PP = $41.08
|
|
MB = $43.13
|
Most Recent Note - 8/25/2010 5:44:38 PM
G - Posted a gain today on lighter volume to close just above its 50 DMA line. The next support is at its 200 DMA line and prior chart lows in the $30 area.
>>> The latest Featured Stock Update with an annotated graph appeared on 8/5/2010. Click here.
View all notes |
Alert me of new notes |
CANSLIM.net Company Profile |
SEC |
Zacks Reports |
StockTalk |
News |
Chart |
Request a new note
C
A N
S L
I M
|
SLW
-
NYSE
Silver Wheaton Corp
METALS and; MINING - Silver
|
$21.49
|
+0.96
4.68% |
$21.56
|
5,292,657
116.39% of 50 DAV
50 DAV is 4,547,400
|
$21.89
-1.83%
|
8/25/2010
|
$21.40
|
PP = $21.99
|
|
MB = $23.09
|
Most Recent Note - 8/25/2010 5:48:38 PM
Y - It was featured in today's mid-day report (read here) perched near its all-time high. No overhead supply remains to hinder its upward progress, yet the $21 area has been a stubborn resistance level. This Canada-based firm in the Mining - Gold/Silver/Gems industry had a downward turn in FY '08 earnings (A criteria has been noted as a concern). Current leadership in the group (L criteria) is helping most firms in the group show strength. Its 3 latest quarterly comparisons showed solid sales and earnings increases (good criteria) after 4 prior reports with negative comparisons versus the year ago period.
>>> The latest Featured Stock Update with an annotated graph appeared on 8/25/2010. Click here.
View all notes |
Alert me of new notes |
CANSLIM.net Company Profile |
SEC |
Zacks Reports |
StockTalk |
News |
Chart |
Request a new note
C
A N
S L
I M
|
VIT
-
NYSE
Vanceinfo Tech Inc Ads
COMPUTER SOFTWARE and SERVICES - Business Software and Services
|
$26.75
|
-0.04
-0.15% |
$26.86
|
689,022
128.74% of 50 DAV
50 DAV is 535,200
|
$28.12
-4.87%
|
7/8/2010
|
$25.20
|
PP = $26.58
|
|
MB = $27.91
|
Most Recent Note - 8/25/2010 5:51:45 PM
Y - Finished near the session high today following a damaging loss with 2 times average volume on the prior session. It reversed from its 52-week high after its prior gain was backed by only +21% above average volume. No resistance remains due to overhead supply. Found support near its 50 DMA line last week after enduring distributional pressure.
>>> The latest Featured Stock Update with an annotated graph appeared on 7/26/2010. Click here.
View all notes |
Alert me of new notes |
CANSLIM.net Company Profile |
SEC |
Zacks Reports |
StockTalk |
News |
Chart |
Request a new note
C
A N
S L
I M
|
WCRX
-
NASDAQ
Warner Chilcott Plc
DRUGS - Drug Manufacturers - Other
|
$28.60
|
-0.84
-2.85% |
$29.61
|
2,227,947
141.40% of 50 DAV
50 DAV is 1,575,600
|
$30.57
-6.44%
|
8/23/2010
|
$29.54
|
PP = $29.34
|
|
MB = $30.81
|
Most Recent Note - 8/25/2010 5:55:27 PM
Y - Loss today with above average volume led to a close below its pivot point. It was featured in yellow in the mid-day report on 8/23/10 (read here), rising from a cup shaped base formed since it was noted in the 5/06/10 mid-day report - "Earnings and sales revenues history has been below guidelines of the fact-based system, yet showed drastic increases in the quarter ended Dec 31, 2009. It encountered stubborn resistance in the $29 area since the high-ranked firm hailing from the Medical - Ethical Drugs industry was noted in a handful of Q4 2009 mid-day reports after announcing plans to buy Procter & Gamble Co's prescription drug business in a deal first announced 8/24/09." (Correction notice: Dec '10 references in prior notes should have been Dec '09)
>>> The latest Featured Stock Update with an annotated graph appeared on 8/23/2010. Click here.
View all notes |
Alert me of new notes |
CANSLIM.net Company Profile |
SEC |
Zacks Reports |
StockTalk |
News |
Chart |
Request a new note
C
A N
S L
I M
|
Symbol/Exchange
Company Name
Industry Group |
PRICE |
CHANGE
(%Change) |
Day High |
Volume
(% DAV)
(% 50 day avg vol) |
52 Wk Hi
% From Hi |
Featured
Date |
Price
Featured |
Pivot Featured |
|
Max Buy |
|
|
|
THESE ARE NOT BUY RECOMMENDATIONS!
Comments contained in the body of this report are technical
opinions only. The material herein has been obtained
from sources believed to be reliable and accurate, however,
its accuracy and completeness cannot be guaranteed.
This site is not an investment advisor, hence it does
not endorse or recommend any securities or other investments.
Any recommendation contained in this report may not
be suitable for all investors and it is not to be deemed
an offer or solicitation on our part with respect to
the purchase or sale of any securities. All trademarks,
service marks and trade names appearing in this report
are the property of their respective owners, and are
likewise used for identification purposes only.
This report is a service available
only to active Paid Premium Members.
You may opt-out of receiving report notifications
at any time. Questions or comments may be submitted
by writing to Premium Membership Services 665 S.E. 10 Street, Suite 201 Deerfield Beach, FL 33441-5634 or by calling 1-800-965-8307
or 954-785-1121.
|
|
|


