You are not logged in.
This means you
CAN ONLY VIEW reports that were published prior to Monday, April 14, 2025.
You
MUST UPGRADE YOUR MEMBERSHIP if you want to see any current reports.
AFTER MARKET UPDATE - TUESDAY, AUGUST 25TH, 2009
Previous After Market Report Next After Market Report >>>
|
|
|
|
DOW |
+30.01 |
9,539.29 |
+0.32% |
|
Volume |
1,141,669,380 |
-7% |
|
Volume |
2,000,100,370 |
-3% |
|
NASDAQ |
+6.25 |
2,024.23 |
+0.31% |
|
Advancers |
1,826 |
58% |
|
Advancers |
1,463 |
52% |
|
S&P 500 |
+2.43 |
1,028.00 |
+0.24% |
|
Decliners |
1,179 |
38% |
|
Decliners |
1,245 |
44% |
|
Russell 2000 |
+2.98 |
583.22 |
+0.51% |
|
52 Wk Highs |
92 |
|
|
52 Wk Highs |
74 |
|
|
S&P 600 |
+1.27 |
308.47 |
+0.41% |
|
52 Wk Lows |
1 |
|
|
52 Wk Lows |
7 |
|
|
 |
Major Averages End With Modest Gains On Lighter Volume
Adam Sarhan, Contributing Writer,
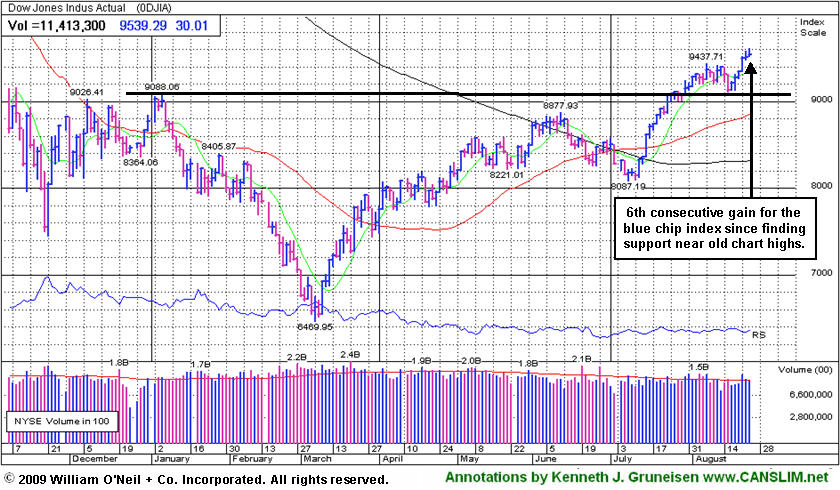
The major averages closed with modest gains after US consumer confidence rose more than forecast and national home prices rose for the first time in three years! Volume was lighter than the prior session levels on both exchanges, which signaled that large institutions were not aggressively accumulating stocks. Advancers led decliners by a 3-to-2 ratio on the NYSE but by a narrower 7-to-6 ratio on the Nasdaq exchange. There were 31 high-ranked companies from the CANSLIM.net Leaders List that made a new 52-week high and appeared on the CANSLIM.net BreakOuts Page, matching the 31 issues that appeared on the prior session. New 52-week highs solidly outnumbered new 52-week lows on both exchanges while new lows were in the single digits again.
It was a relatively busy day on the news front as investors digested a slew of headlines. The Conference Board’s consumer sentiment index rose to 54.1 in August which was the first monthly gain since May and signaled that consumers, the largest segment of GDP, are becoming less concerned about the economy. The real gauge will be when consumer spending data is released, because that will show the extent that consumers actually contributed to the economy.
Elsewhere, the S&P/Case-Shiller home-price index increased +2.9% in the second quarter from the previous three months which was the first increase in home prices since the horrific housing depression began in 2006 and the largest gain in almost four years! Remember that markets (housing included) move in cycles and the fact that home prices have been steadily falling for the past few years suggests the housing bear market is aging and may in fact be over. This statement is not made lightly and is based on the strong technical action of many housing stocks. Housing stocks topped out in the summer of 2005 and it was about a year later when home prices starting coming down. Therefore, the fact that many housing stocks appear to have bottomed suggests higher prices may be on the horizon for the housing market.
President Barack Obama nominated Ben S. Bernanke to a second term (pending Senate approval) which is a strong vote of confidence in Bernanke's actions at the helm. Obama nominated Bernanke, who led the largest expansion of the Federal Reserve's power in its 95-year history to curb the worst financial crisis since the Great Depression, for a second four-year term starting January 31, 2010. In other economic news, the White House Office of Management and Budget released a forecast today that showed they believe the economy will grow +2% in 2010 which is less than the +3.2% forecast released in May. They also believe that unemployment will surpass the +10% level in 2009 and the budget deficit will swell to +$1.5 trillion next year, both higher than the prior estimates.
PICTURED: The Dow Jones Industrial Average posted 6 consecutive gains since finding support near old chart highs.
|
|
|
 |
Biotechnology Index Among Positive Group Influences
Kenneth J. Gruneisen - Passed the CAN SLIM® Master's Exam
Among Tuesday's positive influences were the Retail Index ($RLX +1.78%), Bank Index ($BKX +0.60%), and Broker/Dealer Index ($XBD +1.66%). The Semiconductor Index ($SOX +0.53%) posted a small gain while the Internet Index ($IIX +0.07%) ended close to unchanged and the Networking Index ($NWX -0.18%) edged lower. The Healthcare Index ($HMO +0.25%) and Gold & Silver Index ($XAU +0.53%) posted small gains. Meanwhile, energy shares were weaker and weighed on the Oil Services Index ($OSX -2.23%) and Integrated Oil Index ($XOI -0.45%).
Charts courtesy www.stockcharts.com

PICTURED: The Biotechnology Index ($BTK +2.83%) was a standout gainer as it rallied to a new 2009 chart high.
| Oil Services |
$OSX |
178.36 |
-4.07 |
-2.23% |
+46.93% |
| Healthcare |
$HMO |
1,234.63 |
+3.04 |
+0.25% |
+28.58% |
| Integrated Oil |
$XOI |
988.52 |
-4.43 |
-0.45% |
+0.90% |
| Semiconductor |
$SOX |
300.53 |
+1.58 |
+0.53% |
+41.65% |
| Networking |
$NWX |
212.00 |
-0.39 |
-0.18% |
+47.33% |
| Internet |
$IIX |
204.51 |
+0.14 |
+0.07% |
+52.88% |
| Broker/Dealer |
$XBD |
111.95 |
+1.83 |
+1.66% |
+44.51% |
| Retail |
$RLX |
367.09 |
+6.43 |
+1.78% |
+31.45% |
| Gold & Silver |
$XAU |
146.94 |
+0.78 |
+0.53% |
+18.64% |
| Bank |
$BKX |
46.65 |
+0.28 |
+0.60% |
+5.26% |
| Biotech |
$BTK |
908.88 |
+25.04 |
+2.83% |
+40.44% |
|
|
|
 |
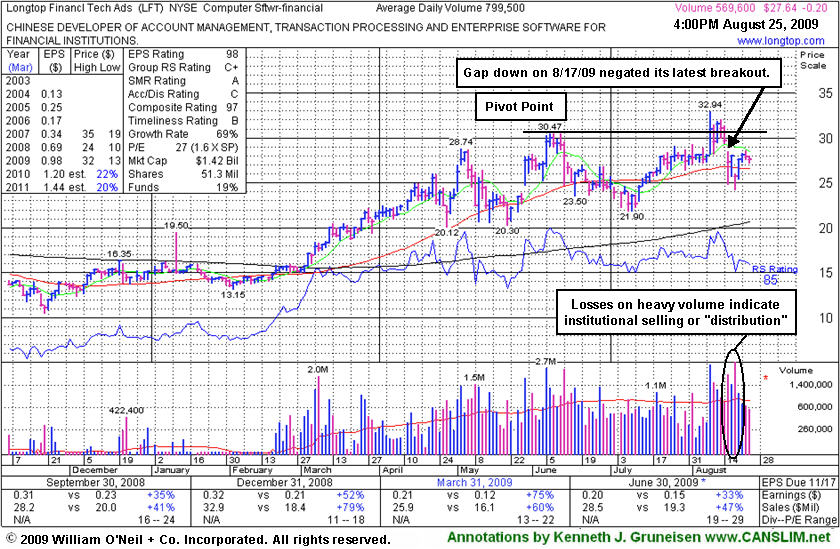
Recent Breakout Was Completely Negated
Kenneth J. Gruneisen - Passed the CAN SLIM® Master's Exam
Longtop Financl Tech Ads (LFT -$0.13 or -0.47% to $27.71) is holding its ground after rebounding above its 50-day moving average (DMA) line. Substantial losses on heavy volume indicative of distributional pressure negated its recent breakout a week after its considerable gap up gain with heavy volume on 8/10/09 had helped it reach a new 52-week high. It gapped down on 8/17/09 for a damaging loss, and after it technically negated its recent breakout the stock's color code was changed to green. It gapped down again on 8/19/09 after reporting results for the quarter ended June 30, 2009, falling substantially on heavy volume 4 times average.
This high-ranked leader needs more time to form a new sound base before it might be considered an ideal buy candidate again, meanwhile investors have reasons for caution. The number of top-rated funds owning an interest in its shares rose from 20 funds in Dec '08 to 38 funds in Jun '09, which is reassuring concerning the L criteria. It has reported strong annual and quarterly earnings increases (good concerning the C & A criteria) backed by strong sales revenues increases. Return on Equity of +20% is above the +17% guideline. Its progress could be hindered by future share offerings. This Chinese Computer Software firm filed a registration of approximately 16 million shares for resale not long ago, yet there have been no subsequent headlines concerning a proposed offering. LFT was first featured at $22.19 on Thursday, April 02, 2009 in the CANSLIM.net Mid Day Breakouts Report (read here).
|
|
|
Color Codes Explained :
Y - Better candidates highlighted by our
staff of experts.
G - Previously featured
in past reports as yellow but may no longer be buyable under the
guidelines.
***Last / Change / Volume quote data in this table corresponds with the timestamp on the note***
Symbol/Exchange
Company Name
Industry Group |
Last |
Chg. |
Vol
% DAV |
Date Featured |
Price Featured |
Latest Pivot Point
Featured |
Status |
| Latest Max Buy Price |
ARO
- NYSE
Aeropostale Inc
RETAIL - Apparel Stores
|
$40.90
|
+1.39
|
4,560,206
152% DAV
3,005,600
|
8/21/2009
(Date
Featured) |
$39.21
(Price
Featured) |
PP = $38.84 |
Y |
| MB = $40.78 |
Most Recent Note - 8/25/2009 4:07:10 PM
Y - Gain today with above average volume for a new high close near its "max buy" level. This high-ranked leader in the Retail - Clothing/shoe group gapped up and hit a new all-time high on 8/21/09, rising from a flat base pattern triggering a technical buy signal. It was featured in yellow with new pivot point and max buy levels noted in the 8/21/09 Mid-Day BreakOuts Report (read here). It has a good annual earnings history (the A criteria), and the 2 latest quarterly comparisons showed +81% and +84% earnings increases, well above the investment system's +25% guideline.
>>> The latest Featured Stock Update with an annotated graph appeared on 8/21/2009. click here.
|
|
C
A
S
I |
News |
Chart |
SEC
View all notes Alert
me of new notes
Company
Profile
|
CPLA
- NASDAQ
Capella Education Co
DIVERSIFIED SERVICES - Education and Training Services
|
$65.02
|
+0.12
|
99,417
50% DAV
200,600
|
7/9/2009
(Date
Featured) |
$59.69
(Price
Featured) |
PP = $62.06 |
Y |
| MB = $65.16 |
Most Recent Note - 8/25/2009 4:09:03 PM
Y - Consolidating in a tight range on very light volume near its 52-week high and "max buy" level. The Commercial Services-Schools Group has shown some leadership but has low ranks, and CPLA's Relative Strength rank has slumped to 52, under the 80+ guideline. Its small supply of only 13.9 million shares in the float could contribute to greater price volatility in the event of institutional accumulation or distribution. The number of top-rated funds owning an interest rose from 91 in Sept '08, to 137 as of June '09, which is reassuring with respect to the I criteria. It has a very good earnings history that satisfies the C & A criteria, while recent quarters showed steady sales revenues increases in the +17-18% range.
>>> The latest Featured Stock Update with an annotated graph appeared on 8/19/2009. click here.
|
|
C
A
S
I |
News |
Chart |
SEC
View all notes Alert
me of new notes
Company
Profile
|
CRM
- NYSE
Salesforce.com Inc
INTERNET - Internet Software & Services
|
$52.34
|
-0.44
|
2,987,962
159% DAV
1,877,000
|
8/16/2009
(Date
Featured) |
$47.12
(Price
Featured) |
PP = $45.59 |
Y |
| MB = $47.87 |
Most Recent Note - 8/25/2009 4:21:10 PM
Y - Holding its ground stubbornly since its "breakaway gap" for a considerable gain on 8/21/09 with more than 5 times average volume. The stock's exceptional action was discussed further in the "Ken's Mailbag" Q&A with a member in the 8/21/09 After Market Update (read here). A Stock Bulletin was published with detailed analysis and an annotated graph on 8/16/09 (read here).
>>> The latest Featured Stock Update with an annotated graph appeared on 8/16/2009. click here.
|
|
C
A
S
I |
News |
Chart |
SEC
View all notes Alert
me of new notes
Company
Profile
|
GMCR
- NASDAQ
Green Mtn Coffee Roastrs
FOOD & BEVERAGE - Processed & Packaged Goods
|
$60.49
|
+1.63
|
1,366,966
81% DAV
1,678,300
|
7/17/2009
(Date
Featured) |
$60.15
(Price
Featured) |
PP = $63.79 |
G |
| MB = $66.98 |
Most Recent Note - 8/25/2009 4:24:10 PM
G - Gain on light volume today leaves it still just under its 50 DMA line which is now downward sloping and a source of technical resistance. The next support is at prior chart lows in the $53 area. Its gap down and considerable loss on 8/17/09 on heavy volume triggered technical sell signals, capping a 6 session losing streak as it violated its 50 DMA line, prior highs in the $62-63 area, and an upward trendline. GMCR traded up more than +168% since appearing with an annotated graph under the headline "It May Soon Be Time To Go Green" when featured in the January 2009 CANSLIM.net News (read here).
>>> The latest Featured Stock Update with an annotated graph appeared on 8/14/2009. click here.
|
|
C
A
S
I |
News |
Chart |
SEC
View all notes Alert
me of new notes
Company
Profile
|
LFT
-
|
$27.71
|
-0.13
|
647,890
81% DAV
799,500
|
8/10/2009
(Date
Featured) |
$31.49
(Price
Featured) |
PP = $30.57 |
G |
| MB = $32.10 |
Most Recent Note - 8/25/2009 4:25:33 PM
G - Holding its ground after rebounding above its 50 DMA line following substantial losses on heavy volume indicative of distributional pressure.
>>> The latest Featured Stock Update with an annotated graph appeared on 8/25/2009. click here.
|
|
C
A
S
I |
News |
Chart |
SEC
View all notes Alert
me of new notes
Company
Profile
|
NTES
- NASDAQ
Netease Inc Adr
INTERNET - Internet Information Providers
|
$42.58
|
+0.30
|
811,636
35% DAV
2,337,300
|
7/17/2009
(Date
Featured) |
$39.29
(Price
Featured) |
PP = $38.74 |
G |
| MB = $40.68 |
Most Recent Note - 8/25/2009 4:26:56 PM
G - Volume is drying up while consolidating above support at its 50 DMA line and above prior chart highs in the $38 area. A 8/13/09 gap down for a considerable loss on nearly 4 times average volume triggered a technical sell signal.
>>> The latest Featured Stock Update with an annotated graph appeared on 8/13/2009. click here.
|
|
C
A
S
I |
News |
Chart |
SEC
View all notes Alert
me of new notes
Company
Profile
|
NVEC
- NASDAQ
N V E Corp
ELECTRONICS - Semiconductor - Specialized
|
$56.09
|
+0.58
|
55,752
58% DAV
96,900
|
3/13/2009
(Date
Featured) |
$33.85
(Price
Featured) |
PP = $49.60 |
G |
| MB = $52.08 |
Most Recent Note - 8/25/2009 4:28:32 PM
G - Consolidating within very close striking range of all-time highs, basing above important initial support at its 50 DMA line and prior chart highs. Quarterly sales revenues in the 6 million dollar range are still rather minuscule, leaving concerns.
>>> The latest Featured Stock Update with an annotated graph appeared on 8/18/2009. click here.
|
|
C
A
S
I |
News |
Chart |
SEC
View all notes Alert
me of new notes
Company
Profile
|
PEGA
- NASDAQ
Pegasystems Inc
COMPUTER SOFTWARE & SERVICES - Business Software & Services
|
$32.97
|
+0.56
|
933,453
272% DAV
342,700
|
7/29/2009
(Date
Featured) |
$27.53
(Price
Featured) |
PP = $27.49 |
G |
| MB = $28.86 |
Most Recent Note - 8/25/2009 4:31:28 PM
G - Small gain today on more than 2 times average volume for a new all-time high. Its 6 session winning streak since holding ground above its 50 DMA line included a big gap up on 8/24/09 for a considerable gain heavy volume. Color code was changed to green based on its distance above its latest pivot point and max buy level.
>>> The latest Featured Stock Update with an annotated graph appeared on 8/24/2009. click here.
|
|
C
A
S
I |
News |
Chart |
SEC
View all notes Alert
me of new notes
Company
Profile
|
UTA
-
|
$12.45
|
-0.07
|
239,871
43% DAV
563,500
|
7/28/2009
(Date
Featured) |
$12.87
(Price
Featured) |
PP = $12.70 |
G |
| MB = $13.34 |
Most Recent Note - 8/25/2009 4:32:25 PM
G - Volume is drying up while consolidating above support at its 50 DMA line and prior chart highs. A negative reversal on 8/13/09 for a loss on very heavy volume was noted as a clear sign of worrisome distributional pressure. Strong action prompted it to be featured in yellow with pivot point and max buy levels noted in the 7/28/09 mid-day breakouts report (read here), with additional analysis included in the after market update (read here).
>>> The latest Featured Stock Update with an annotated graph appeared on 8/20/2009. click here.
|
|
C
A
S
I |
News |
Chart |
SEC
View all notes Alert
me of new notes
Company
Profile
|
|
|
|
THESE ARE NOT BUY RECOMMENDATIONS!
Comments contained in the body of this report are technical
opinions only. The material herein has been obtained
from sources believed to be reliable and accurate, however,
its accuracy and completeness cannot be guaranteed.
This site is not an investment advisor, hence it does
not endorse or recommend any securities or other investments.
Any recommendation contained in this report may not
be suitable for all investors and it is not to be deemed
an offer or solicitation on our part with respect to
the purchase or sale of any securities. All trademarks,
service marks and trade names appearing in this report
are the property of their respective owners, and are
likewise used for identification purposes only.
This report is a service available
only to active Paid Premium Members.
You may opt-out of receiving report notifications
at any time. Questions or comments may be submitted
by writing to Premium Membership Services 665 S.E. 10 Street, Suite 201 Deerfield Beach, FL 33441-5634 or by calling 1-800-965-8307
or 954-785-1121.
|
|
|


